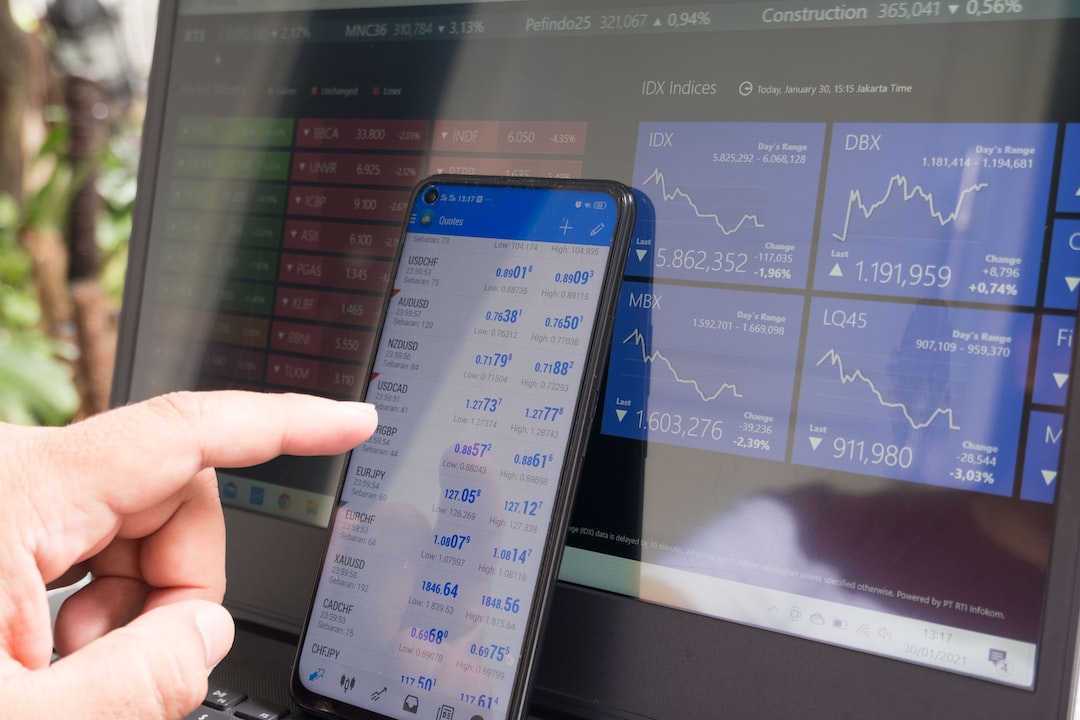
Tick charts are a popular tool used in forex trading to analyze price action on a smaller time frame. Unlike traditional time-based charts, tick charts display a new bar or candlestick only after a certain number of trades or “ticks” have occurred. This means that the time interval between each new bar can vary, depending on market activity. In this article, we’ll explore how to use tick charts in forex trading to help you make more informed trading decisions.
Why use tick charts?
Tick charts offer several advantages over traditional time-based charts, including:
1. More accurate view of price action: Tick charts show every trade that occurs, so you can see more granular price movements that may not be visible on a time-based chart. This can help you identify trends and patterns more easily.
2. Better visualization of market activity: Tick charts can help you see changes in market activity more clearly, as bars or candlesticks are created only when a certain number of trades or ticks occur. This can help you identify key levels of support and resistance and potential entry and exit points.
3. Reduced noise: Because tick charts show only meaningful price movements, they can help filter out market noise and give you a clearer picture of overall market sentiment.
How to set up tick charts
Setting up tick charts in forex trading is relatively straightforward. Most trading platforms offer the option to create tick charts, either as a standalone chart or as an alternative view to traditional time-based charts.
To create a tick chart, follow these steps:
1. Open your trading platform and select the currency pair you want to trade.
2. Click on the charting button, which is usually located in the top toolbar or in a drop-down menu.
3. Choose the “Tick Chart” option.
4. Set the tick interval to the desired number of ticks per bar. This can vary depending on your trading strategy and the volatility of the market. For example, you might choose a tick interval of 10 ticks per bar for a less volatile market or 100 ticks per bar for a more volatile market.
5. Customize the chart settings to your preference, including the chart type (bar or candlestick), color scheme, and time frame.
How to use tick charts in forex trading
Once you’ve set up your tick chart, you can use it to analyze price action and make trading decisions. Here are some tips for using tick charts effectively:
1. Identify key support and resistance levels: Use tick charts to identify areas of support and resistance, which are price levels where the market has historically had difficulty breaking through. These levels can be used to identify potential entry and exit points for your trades.
2. Monitor market sentiment: Use tick charts to monitor changes in market sentiment, which can be indicated by sudden spikes in price or volume. This can help you identify potential trend reversals or breakouts.
3. Analyze price patterns: Use tick charts to analyze price patterns, such as triangles, head and shoulders, and double tops and bottoms. These patterns can help you identify potential entry and exit points for your trades.
4. Use tick charts in conjunction with other technical indicators: Tick charts can be used in conjunction with other technical indicators, such as moving averages and oscillators, to confirm trading signals and help you make more informed trading decisions.
5. Adjust tick interval as needed: Depending on your trading strategy and the volatility of the market, you may need to adjust the tick interval to better capture price movements. For example, you might use a smaller tick interval during periods of high volatility and a larger tick interval during periods of low volatility.
Conclusion
Tick charts can be a powerful tool in forex trading, helping you analyze price action on a smaller time frame and make more informed trading decisions. By setting up tick charts in your trading platform and using them in conjunction with other technical indicators, you can gain a more accurate view of market activity and identify potential entry and exit points for your trades.


