Candlesticks are great because it makes trends visual at first glance. But most candlestick users stay just with that trait and don’t go more in-depth.
Of course, everybody knows some candlestick patterns such as Morning and Evening Stars, Haramis, Dojis and Shooting stars, but what’ is hiding inside the candlestick?. How to extract market sentiment from its shape or pattern?
So, let’s begin!
1 – Unwrapping a Candlestick
A candlestick is condensed information of the price action within its timeframe. The corollary is that if we go to a shorter timeframe, the candlestick now is a pattern of several candlesticks.
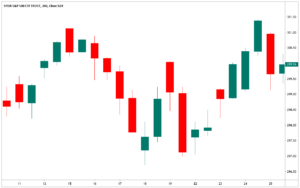
In the chart here we see the unwrapping of a 4H candle into 30-min parts
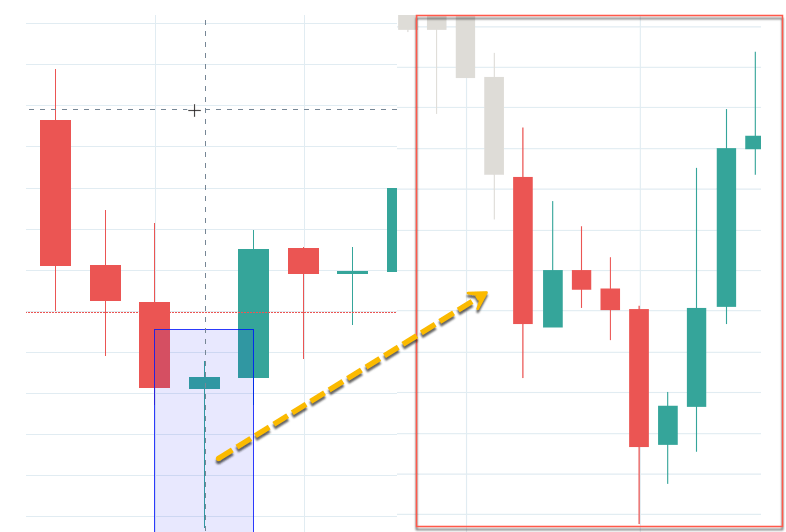
Chart 1 – 4H Hammer Candlestick unwrapped into 30-min candles.
We notice that the candle has one segment dominated by sellers and the other part controlled by buyers.
Which sentiment dominates in sellers at the bottom?
- To the first class belong those traders who could no longer hold the pain of being long and close their position.
- The second class is made of those who came late to the trend and sold believing the trend will last forever, or quite so.
Which sentiment dominates in the way back up?
- Late sellers realized that they were in the losing side, so they needed to close their shorts. That meant, they have to buy, adding to the bullish fuel
- Longs that were taken out of their position see frustrated how the price moves up without them. Hence, some of them retake their longs, while others don’t dare, afraid this is going to be another bull squeeze.
2.- Impulse or correction?
There are only two stages in the market: Impulses and corrections of previous impulses. So how to spot the price is in an impulsive or corrective phase?
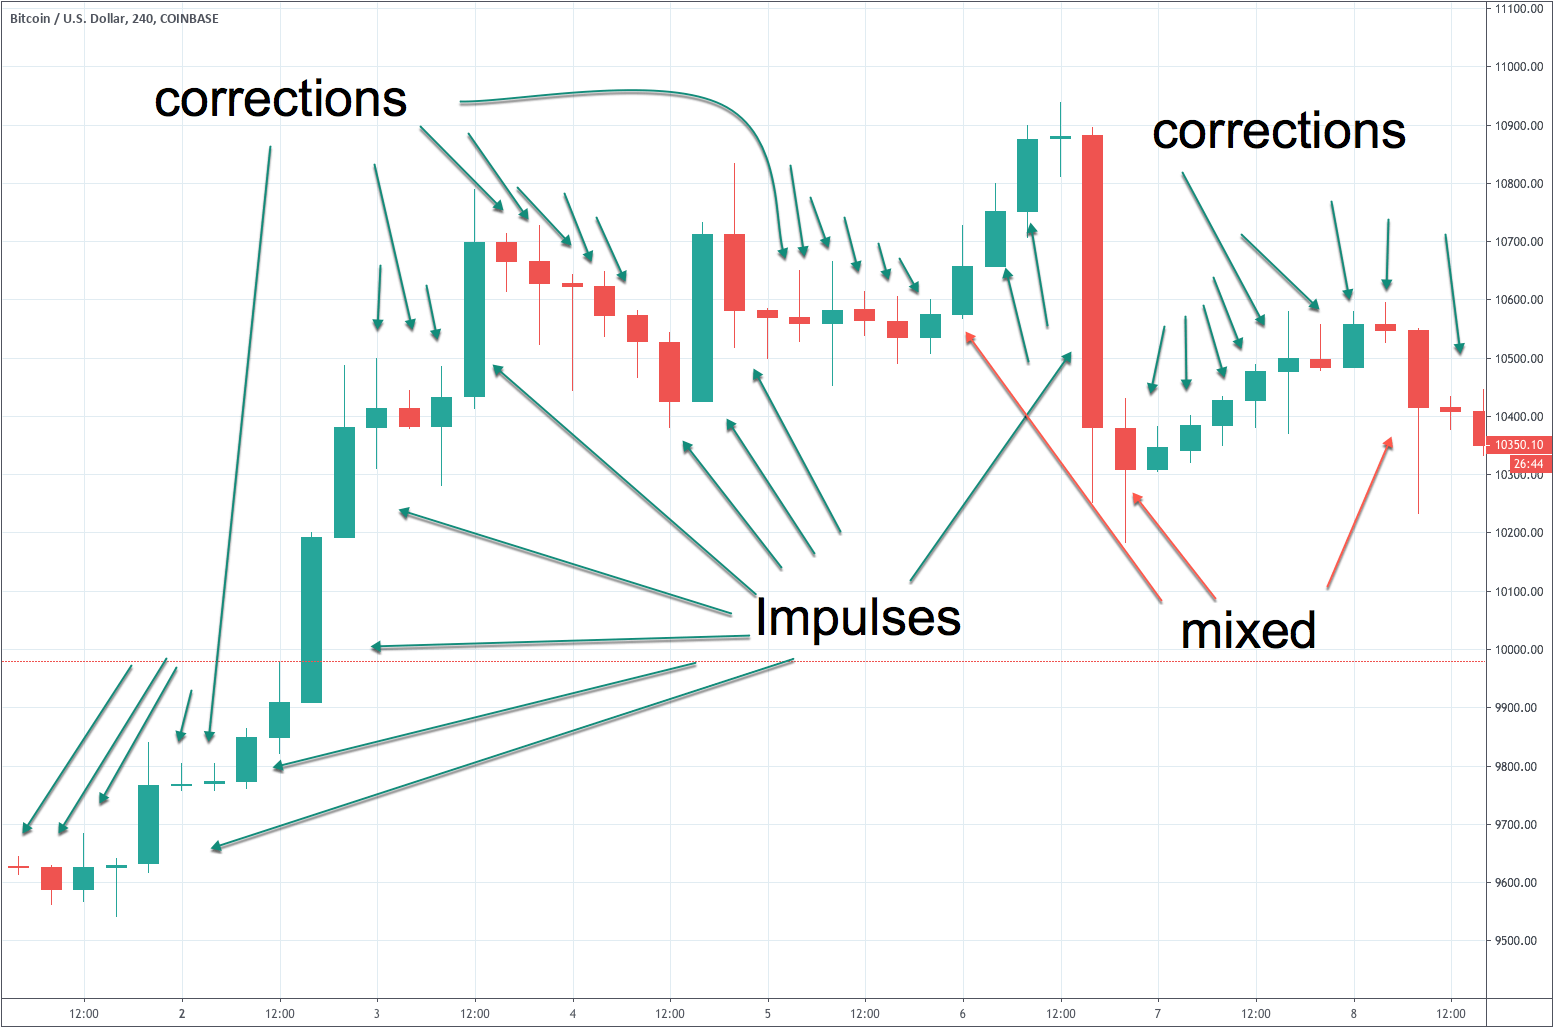
Chart 2 – Candlesticks: impulses and corrections.
Impulses break resistances and move with a clear direction. Impulses are what make trends. Corrections move in ranges, lack direction, and usually retraces some or all the advances of the previous impulse. People usually think in trends as composed by many candlesticks or bars, but we now know that a single candlestick is composed by many shorter-timeframe candlesticks. Therefore, we cannot be surprised if we state that a trend can be made of a single candlestick. That applies also to corrective movements. A corrective movement can be summarised in a single candlestick.
How to know if a candle is impulsive or corrective?
To spot an impulse look for a candlestick with a large body and almost no wicks or shadows. To spot a corrective movement look for small-bodied candles with or without wicks ( usually with wicks). Sometimes we find both characteristics in a candlestick. That may mean it is a combination of impulse and correction. That is ok since there is no law that forbids the start of a correction or impulse in the middle of the timeframe of a candle. Sorry, the universe is not perfect!
3.- Who is in control?
Once we know facts 1 and 2, we are in the position to spot who controls the price action: buyers or sellers.
One clue is, of course how the candlestick closes, but the other clue is where are and how long are wicks. If we spot several candlesticks with large lower wicks we could reason that the buyers are pushing the price above the bottom of the candlesticks. If wicks happen on top we could deduct the opposite: Sellers selling the rally.
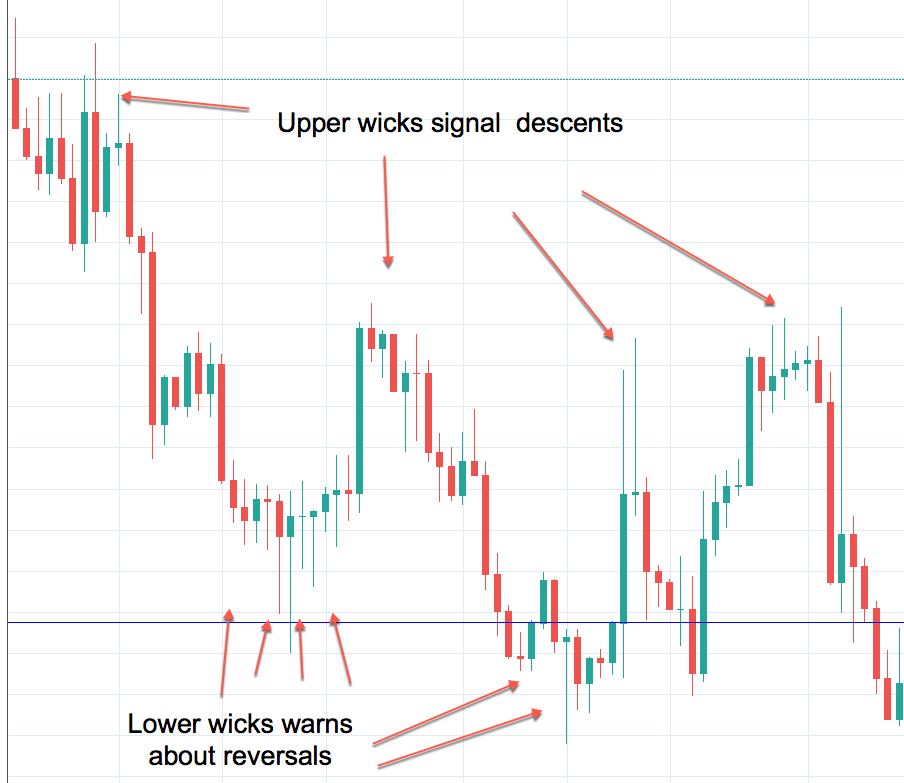
Chart 3 – Candlesticks: Wicks show who controls the price action
A downward trend with a lot of lower wicks is weak. That applies to an upward trend with lots of upper wicks. Therefore, we can detect the market sentiment by just observing the wick appearance on the candlesticks.
Final words
So now we know that there is much more than just fancy colors and trend visualization. We have to inspect and pay attention to body and wicks, also called shadows by Steve Nison. The information provided by a single or a group or candlesticks is worth the time spent.