Stats for Traders V – Assessing the Quality of the Forex Markets
In our previous video offering, we were presented with a way to assess the quality of a trading strategy or system. It was a modification of the T-
Test Called SQN. Essentially, the test is a measure of the signal-to-noise ratio of distribution. Being the mean of the distribution, m, the signal, and one-tenth of the standard deviation, the noise divisor. Therefore, the higher the SQN, the better the signal of the distribution. It means, also, its difference with a zero mean distribution (everything is noise) is larger.
Random Walks
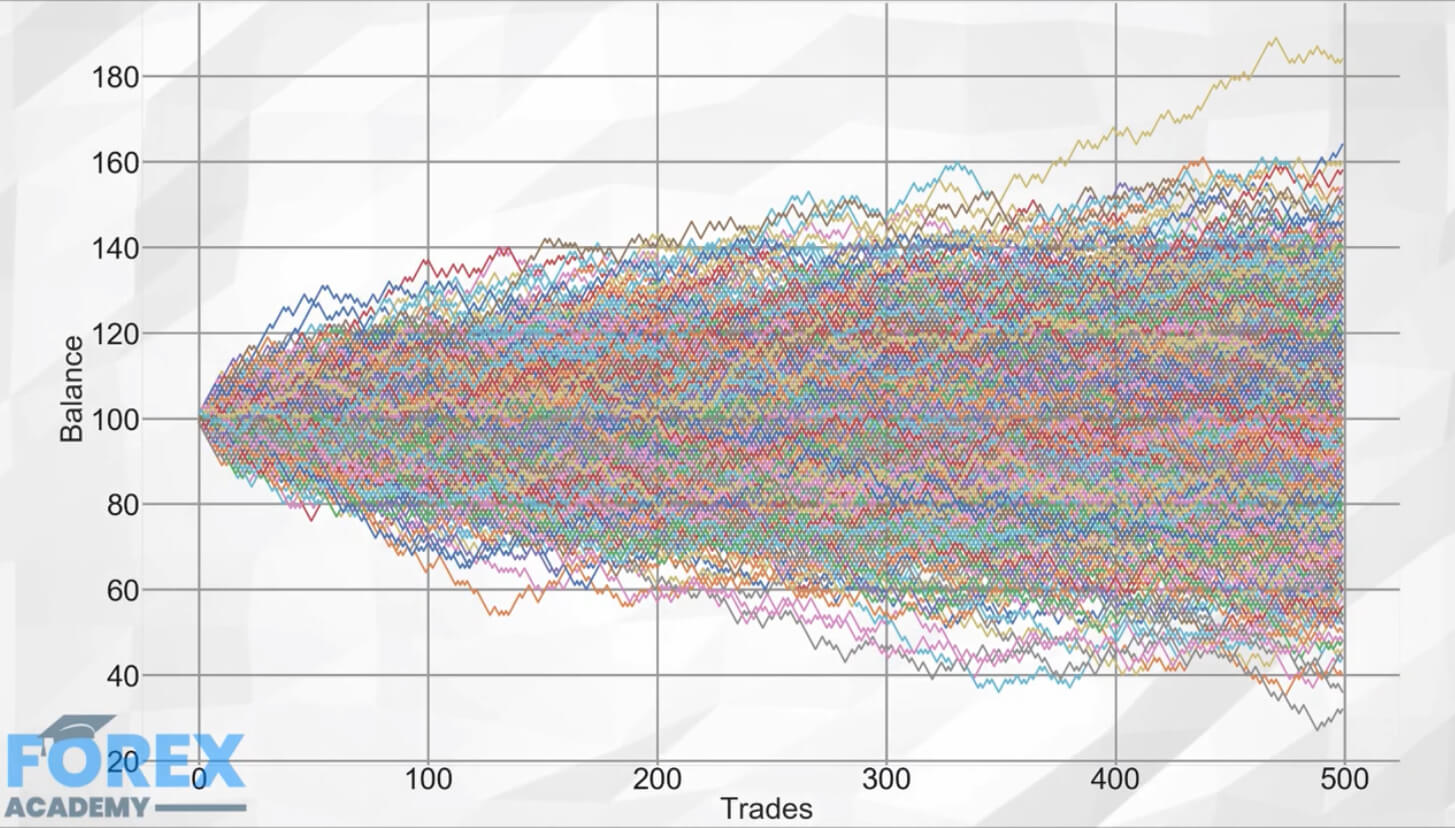
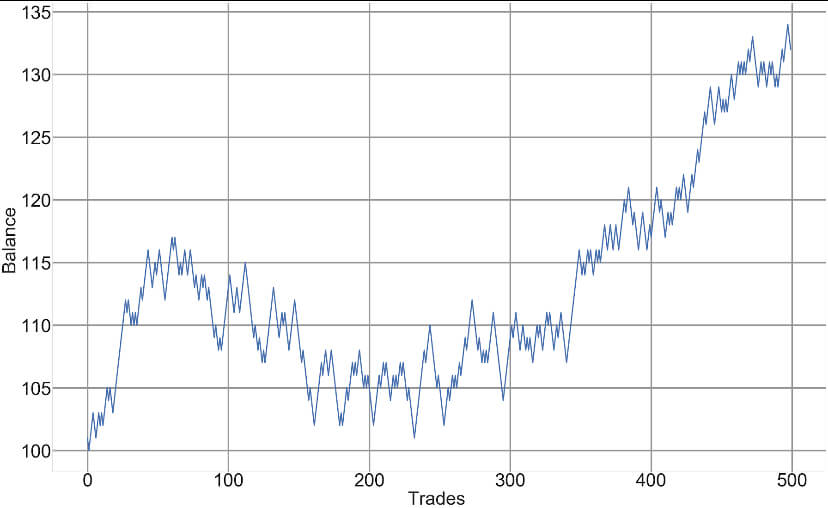
Market prices, although not entirely normal-distributed, short-term, prices approach a Bell curve very much. The picture we see is the composite image of one thousand different games of a coin toss in which the player wins 1 dollar if heads and loses one dollar if tails.
The paths are the history of wins and losses over 500 coin tosses for each game.
We can see that, even it is counterintuitive, not all games end with zero gains. Some paths are luckier, whereas other paths suffer from bad luck.
The figure we see on the image is representative of what is called a diffusion process, with no drift. It is essentially saying it is a complete stochastic or random process with no trend involved.
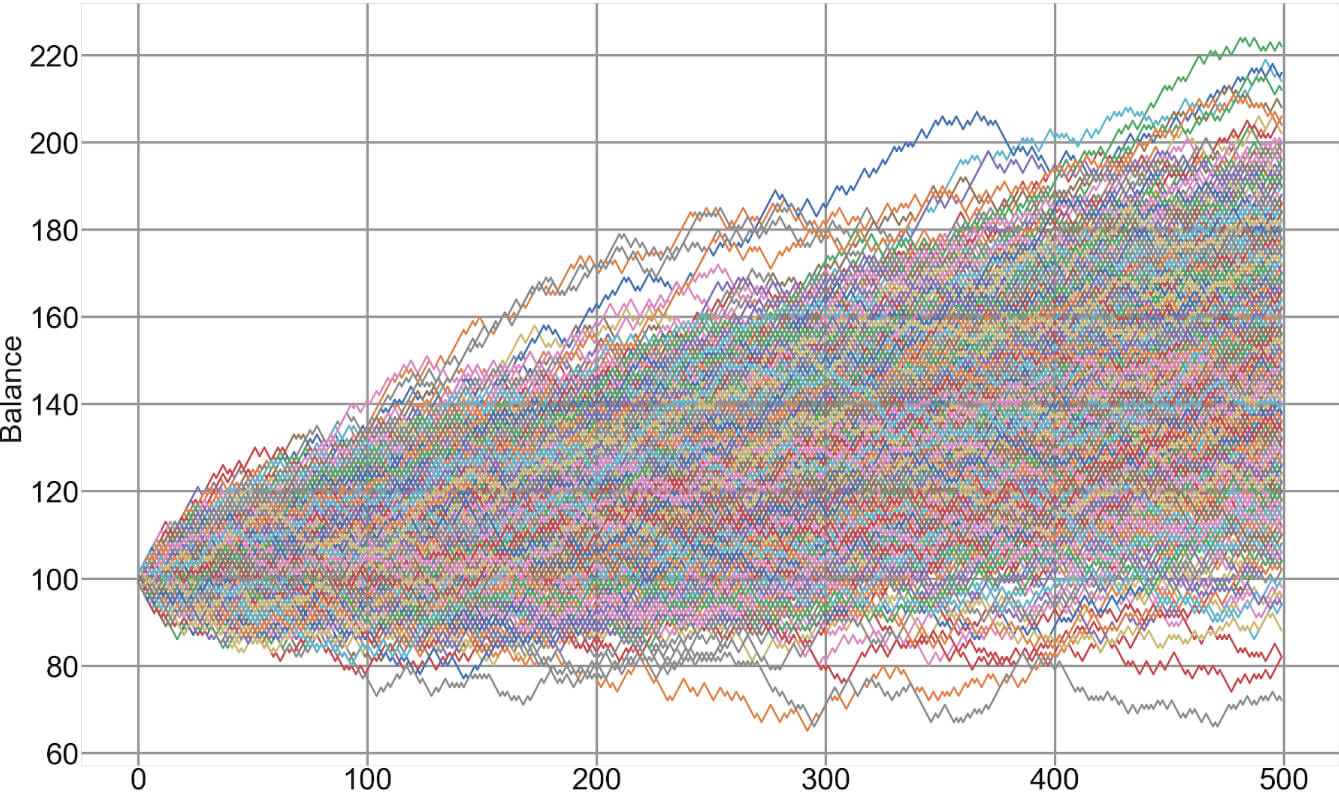
A market depicting a potentially profitable component, usually a slightly positive trend would look like this. In this image we see that although there are some paths luckier than others, the average direction is positive, which is why the smoke cloud points slightly upwards.
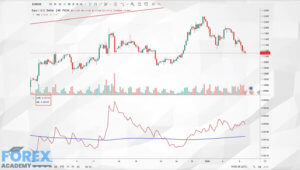
Market prices can be described by a signal component mixed with noise, or random fluctuations.
Sometimes, the market shows a relatively high signal, whereas, on other occasions, it is just noise. To traders, it is essential to distinguish both market states, as it is impossible to profit long-term on a market with just noise.
SQN as a measure of the trading quality of a market
We can rank the markets offered by our forex brokers by their quality or signal to noise ratio, using SQN or a T-Test with less than 100 sample periods. We could apply this measure to our usual timeframes, using from 30 to 60 samples to obtain a quality map of our usual markets. Then we rank them by quality. This measure, together with the volatility stats and the rest of statistical information we already explained in previous videos, allows a savvy trader to choose the current best markets and discard the ones not showing adequate signal-to-noise characteristics.
Range Stats
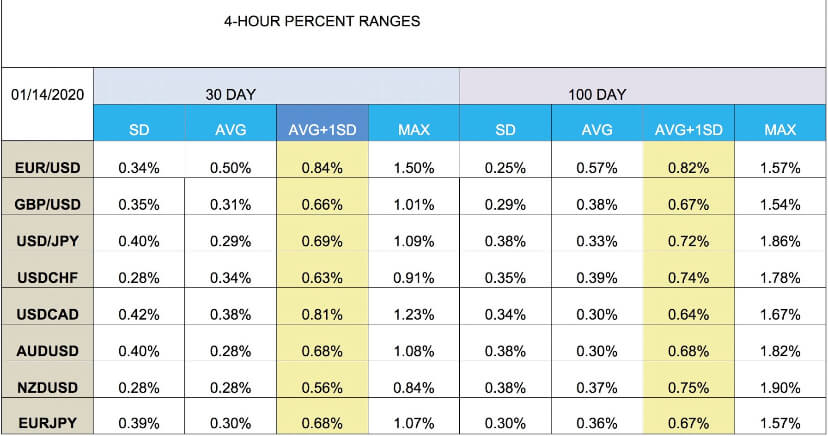
Another interesting measurement that could help us assess potential reward to risk factors and also trim our targets properly is the intraday range measurements. We could set a 30-day, and also a 100-day and yearly stats, of what is normal market ranges percentwise for each asset in our basket. To do this measurement, we first mark the swing highs and lows and register the price differences. Then we apply the statistical measures to get the average and the SD values. A table could tell us what we could expect from the next move and set potential targets at the mean and also at the mean plus one SD.
We can also refine the information by splitting the table into swing high and swing low tables. That kind of information will give us valuable insight into the potential quality of the next trade, including the available range, its likely continuation, the possible reward-risk ratio, and the distance to targets.