How to get an Edge using Statistical Thinking I
Do you know the difference between institutional traders and the average retail trader?
Well, there are many obvious differences, including the capital available to them. Still, the most significant factor is that you blindly believe in technical analysis, whereas they use other higher-level techniques to be ahead of them, ahead of you.
The mathematician is highly paid in the financial markets for a reason: They make the real difference. The marketplace is a battlefield, and quant analysis is analogous to smart drone attacks, whereas trading using TA is like fighting with spears and arrows.
But I don’t have that software!
Of course, pros use large databases and sophisticated analytical software, machine learning, and so forth. If you are serious about trading, you should consider creating your custom analytical software. The use of high-level languages such as Python in combination with Pandas, a terrific statistical package, and a bit of code, would put you into the next level. Still, with patience, dedication, and a spreadsheet, you could collect your own information. Excel also included quite a decent statistical package.
Metatrader 4 to Excel
It is possible to automate your data capture from your MetaTrader 4. MetaTrader 4 has a DDE Link. It is straightforward to get it done.
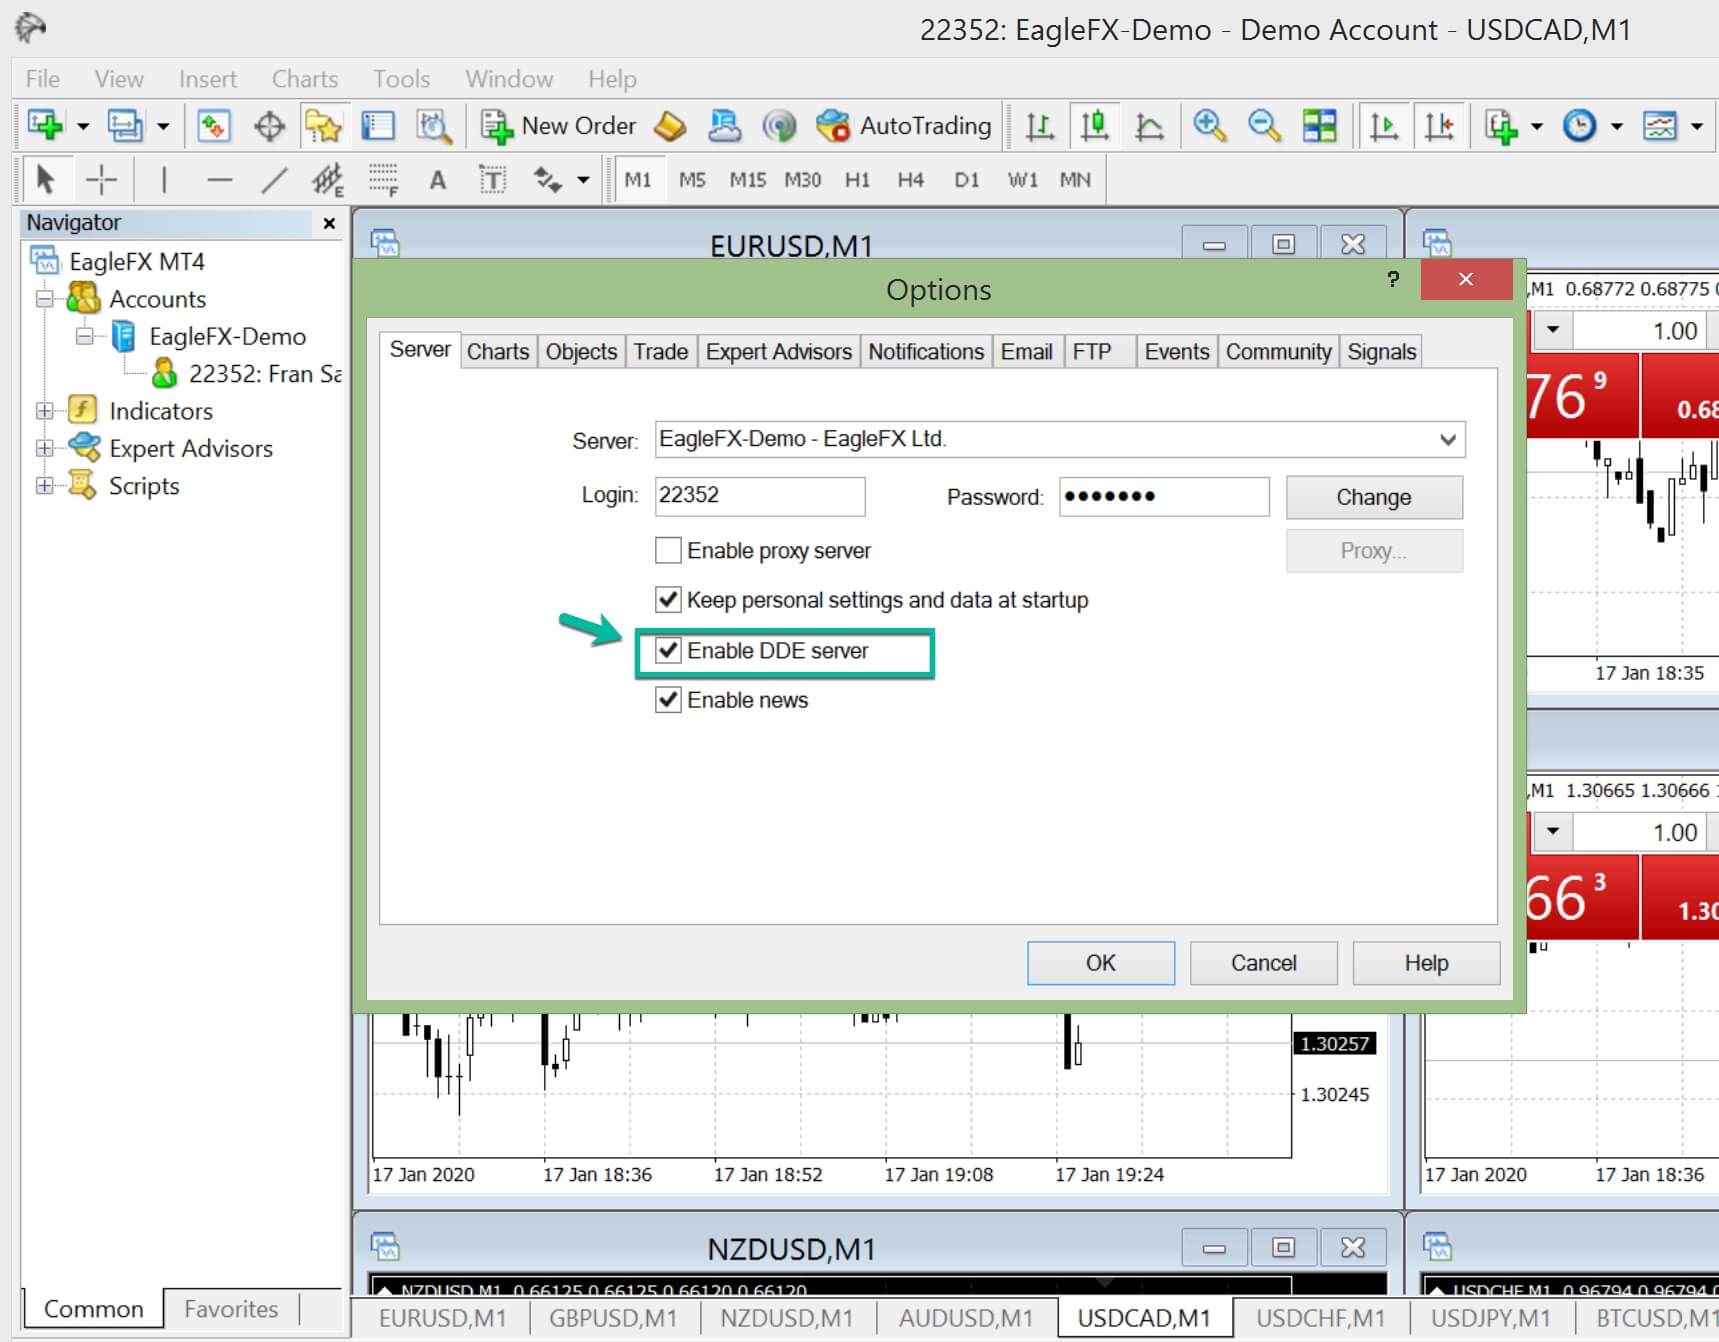
You simply need to enable the MT4 DDE server and place a simple code in the corresponding Excel cells.
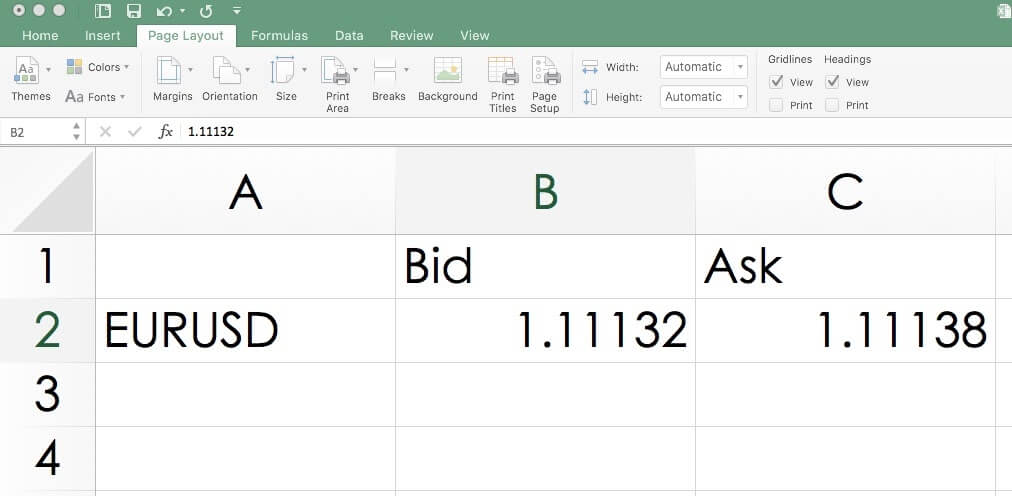
=MT4|BID!EURUSD
=MT4|ASK!EURUSD
=MT4|HIGH!EURUSD
=MT4|LOW!EURUSD
=MT4|TIME!EURUSD
Average Trading Ranges
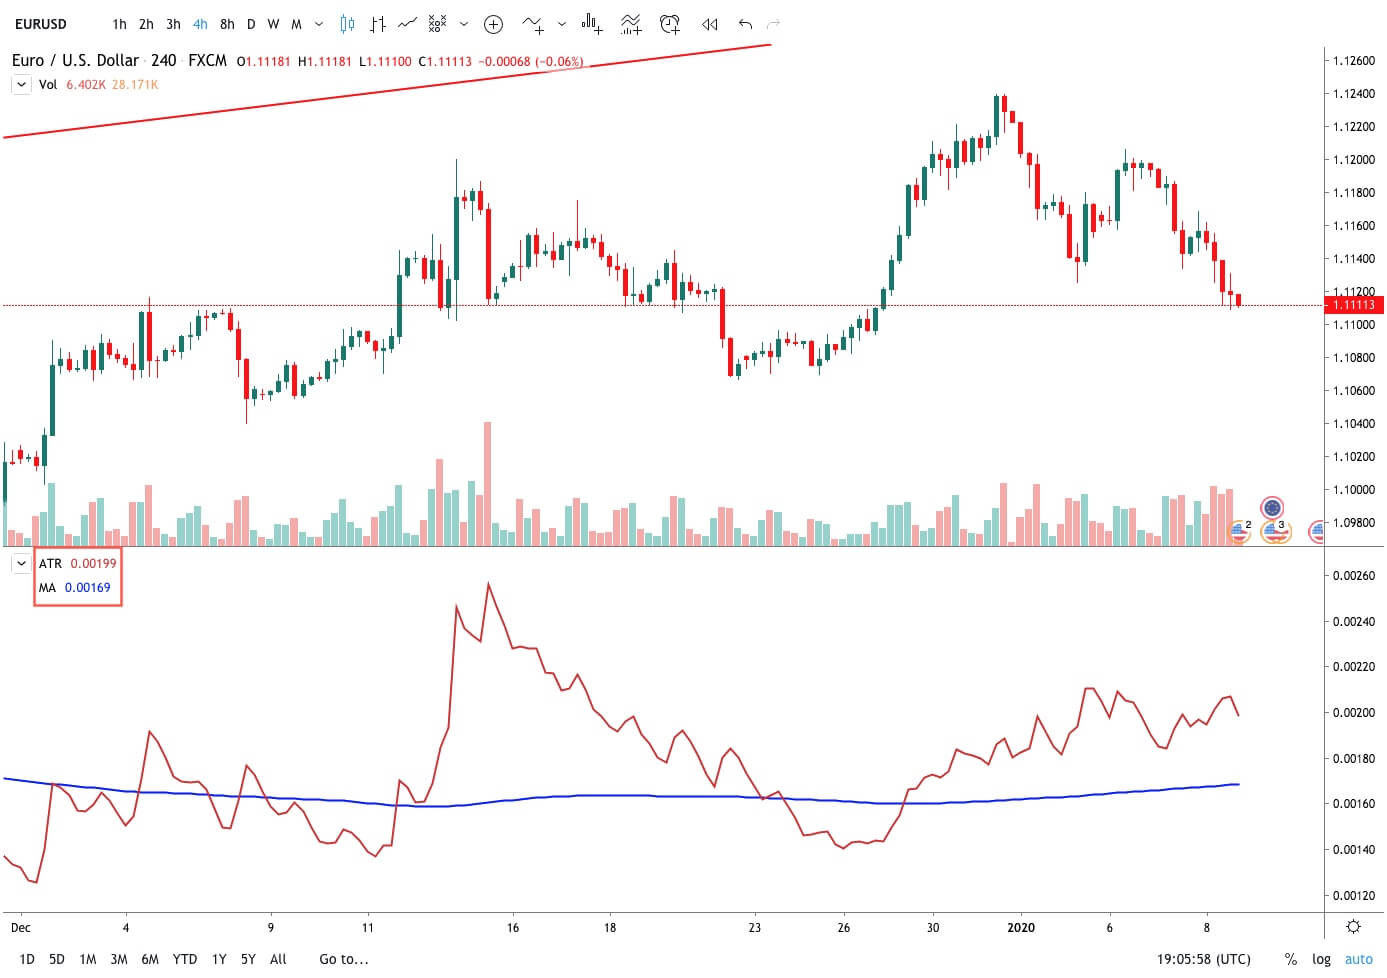
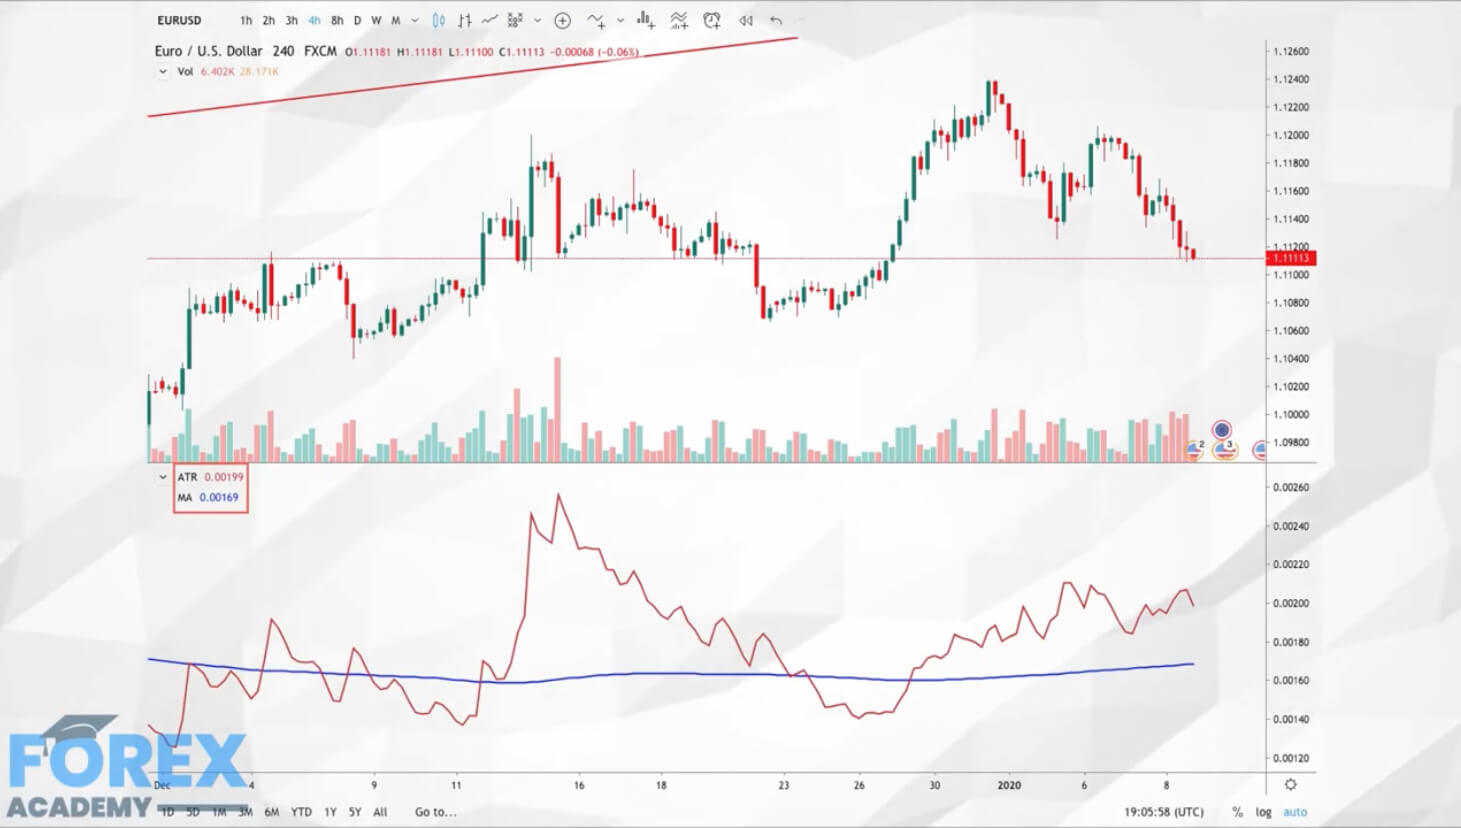
Determine trading ranges can be accomplished using the Average True Range Indicator (ATR). There is no need to collect data to use it, and it will provide you the basic information to know a lot of things. Using a short-term value such as a 10-period ATR will tell you of the Forex pair you intend to trade is experiencing a period of low or high volatility, or if its current range can be considered as normal. This knowledge will show you several interesting facts that may decide if it is worth trading or not.
1.- The ATR is the average range for the period. Therefore, it tells you the expected movement of the timeframe of your chart. So it is at the same time, your risk and your potential profit per timeframe. It tells you several pieces of information:
Your stop loss pip distance divided by the current ATR will say to you the average time it will take the market to reach your stop. For example, in a 4-Hour chart, if your stop-loss is 10 pips away and your STR is 16 pips, you know the average time a bad trade will take to reach your target is 10/16 x 4hours = 2.5 hours.
Your profit distance divided by the current ATR will tell you the average time it will take your trade to reach your target.
Your trading costs, Spread+ Fee+ Slippage multiplied by the profit to ATR ratio computed above, divided by the ATR and multiplied by 100 will tell you the percentage of the projected profits are needed to break-even.
That value will help you to decide the best timeframe for your needs. If you’re aware of the overall cost of the operation, you may realize your mostly working for your broker and that a better timeframe is needed or that the current market ranges are not suitable for trading.
Determining turning points and the concept of range_stats
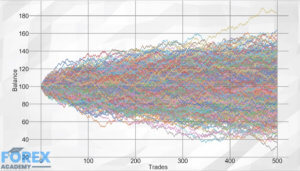
Now, if we collect the averages of trading ranges, we can get a lot of more exciting insights about the market.
What if we could get a real edge over the market, statistically relevant and profitable long term?
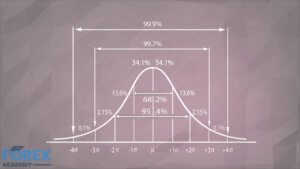
Going back to our previous video about the Normal Distribution, we talked about the Central Limit Theorem. This theorem says that the average value of a collection of samples will be normally distributed.
If we apply this concept to a collection of ranges, we will get a Bell-shaped curve, including its statistical properties.
UP and Down Ranges
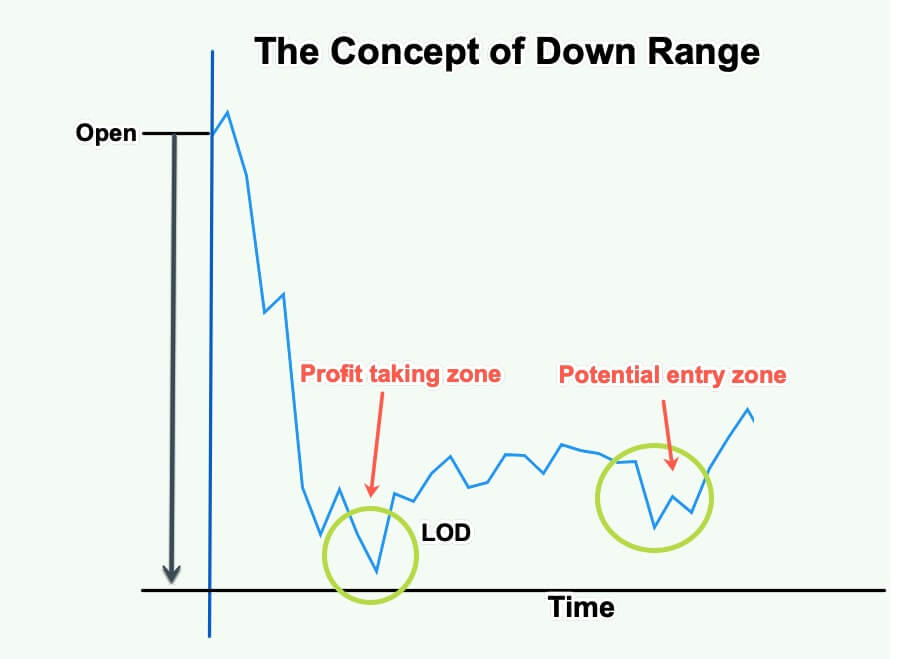
If we have our data collected, we could compute the average range from the opening of our session to the low of the session. Let’s call this piece of data the Down_Range.
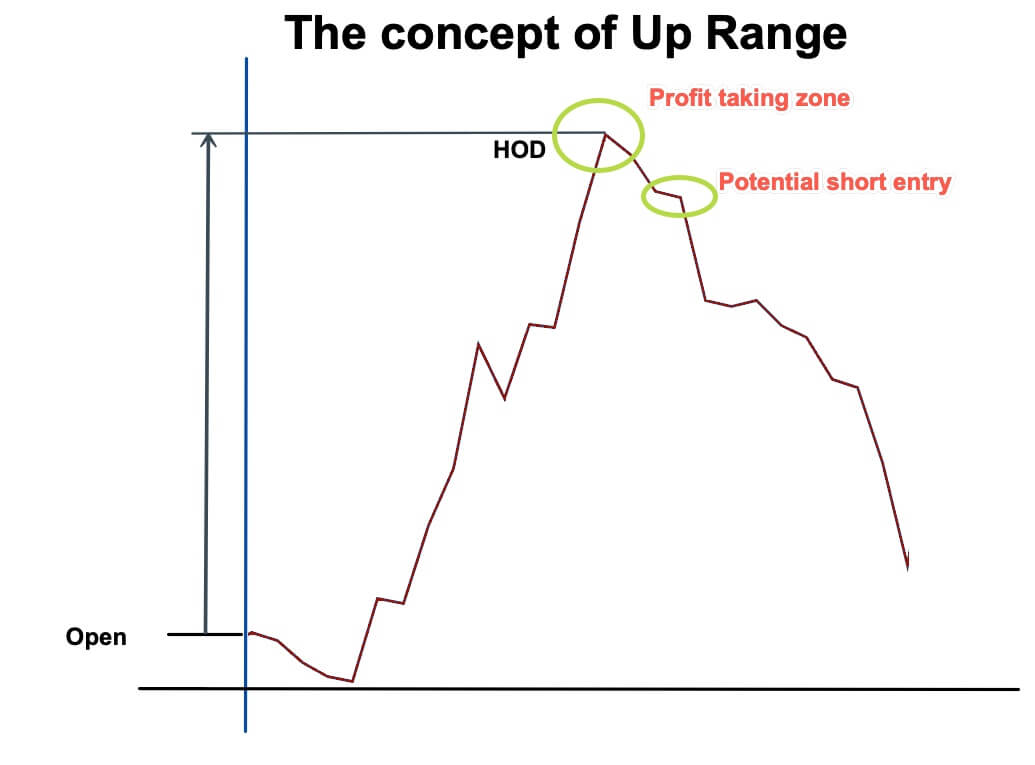
We can do the same for the gain data. That is the range from the opening to the high of the session. That will be called the UP_Range.
If we store the UP__Range and the Down_Range measurements, we can compute the average of the last 30, 50, or 100 days and its standard deviation (SD) and apply some statistical thinking on it.
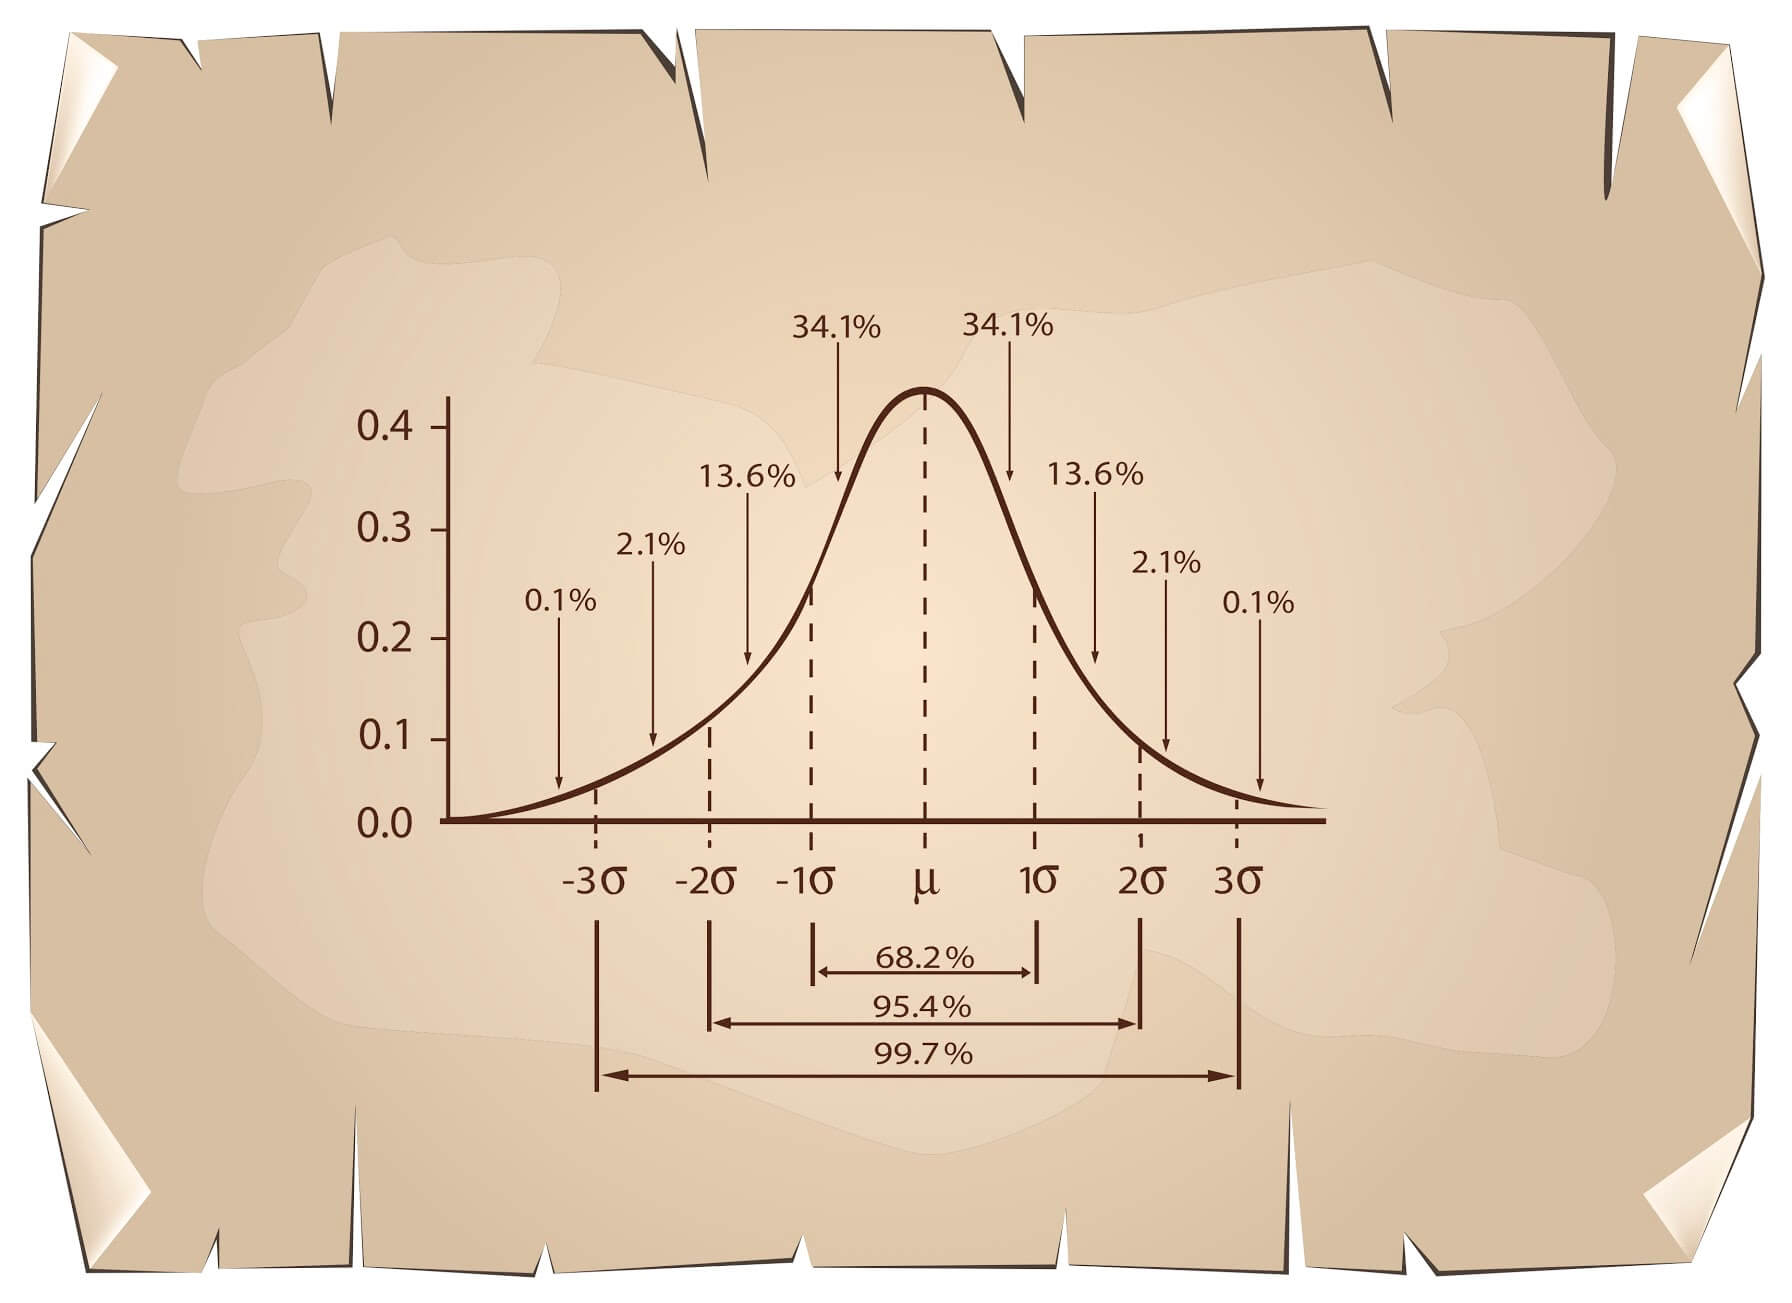
In our previous lesson about the Normal Distribution statistical properties, we’ve learned that 68.2% of the data points belonging to a Normal distribution are located in the region between the average plus and minus one SD. That means only 31.8% of the data points are beyond that area. And looking to the right side, only 15.9% of the ranges are higher than the average plus one SD.
On this fact lies our trading edge: Our data collection of Up and Down ranges tells us how far, on average, the asset moves before turning in the opposite direction.
Thus, our TA signals will be much more statistically significant when the UP or Down typical range has been exceeded by 1SD, there is a high likelihood the currency pair is reversing.
Taking profits can also be aided by this type of strategic information, as we could compute the typical range the asset moves after turning in the opposite direction and apply it to our trade setting.
More on Statistical thinking in our next video.
Reference: Ken Long Tortoise Methods