
In the previous article, we presented the wave identification process starting with the segment as the basic unit of the price movement. In this educational article, we will introduce some rules to support the preliminary analysis.
Price and Time in the Waves Identification
When an Elliott wave analyst decides to study a financial asset, he tends to choose a specific timeframe, and in consequence, he will visualize a defined group of waves. However, in view that the speed of price changes across time, the analyst must be flexible in the timeframe selection process.
The psychology of masses changes over time; this phenomenon can be reflected in the speed of price, making a market more volatile in a specific moment than another. For this reason, it is useful to analyze using different timeframes.
R.N. Elliott, in his work “The Wave Principle,” exposes the importance of selecting different timeframes when the speed of price doesn’t allow us to visualize the different waves adequately.
Directional and Non-Directional Movement Concept
Before starting to analyze the price through time, it is essential to distinguish the concept of directional and non-directional movement. The directional move contains a group of segments that produces a global increase or decrease in the value of a financial asset.
When the price action runs in a directional movement, the segment that moves in the opposite direction of the previous move, never retracing beyond the 61.8% Fibonacci level of that movement.
Directional and Non-Directional Movement in GBPJPY Cross
The following chart illustrates the concept of directional and non-directional movement. The GBPJPY cross in its 2-hour chart exposes the bearish directional movement started on December 13th, 2019, when the price reached 147.954 and ended when the price found support at 141.161 on December 23rd, 2019.
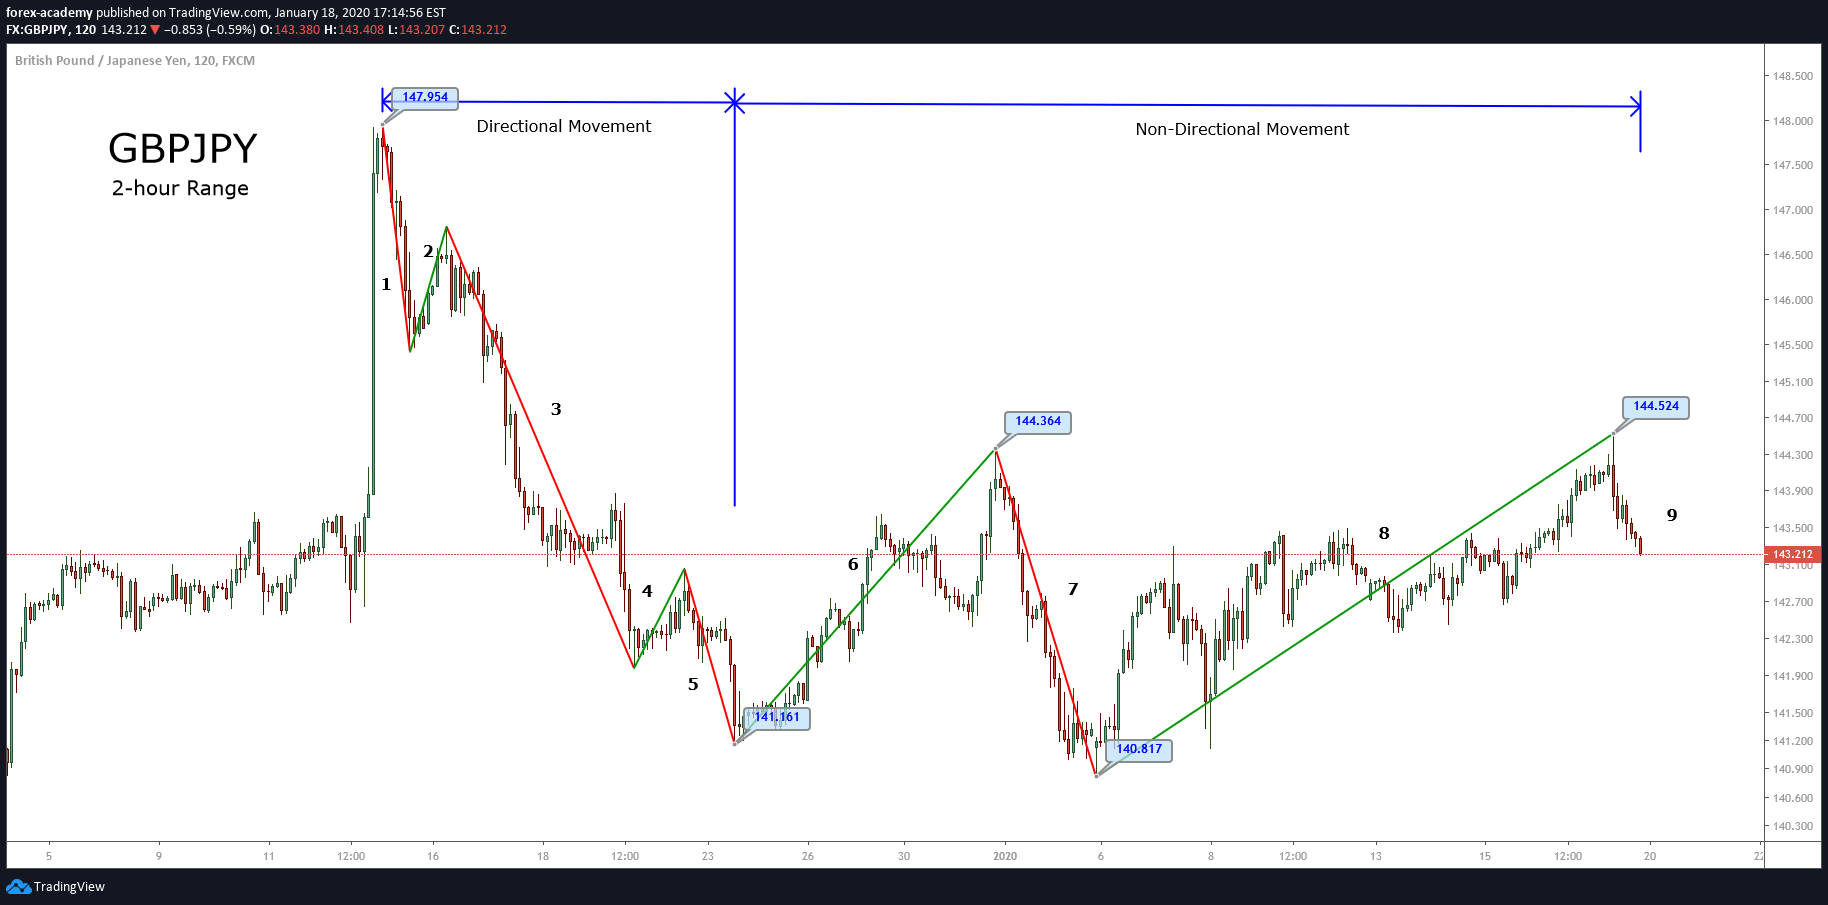
The bearish directional movement ended once the segment identified as “6” surpassed the origin of the last bearish section tagged as “5”.
The sixth segment climbed until 144.364, from there, the cross found fresh sellers, which drove its price to a new low at 140.817. This non-directional movement is identified as the segment “7”.
After this new support, GBPJPY bounced in a segment identified as “8” until 144.524, being the third segment of the non-directional sequence. Currently, the price is retracing in a bearish segment that still is active.
Conclusion
The price moves following a rhythm that changes through time. Sometimes, in a different timeframe, it isn’t straightforward to visualize the Elliott wave formations, in this case, the wave analyst has to be flexible to select a different timeframe to develop its study.
The identification of directional and non-directional movements will allow the analyst to understand and follow the rhythm of the market.
Suggested Reading
– Neely, Glenn. Mastering Elliott Wave: Presenting the Neely Method. Windsor Books. 2nd Edition.