Categories
Forex Videos

How To Get An Edge In Forex Using Statistical Thinking – Trade Like A Forex Titan Part 3

Stats for Traders III – Z-Scores, Market Strength and Market Signal to Noise

Z-Scores


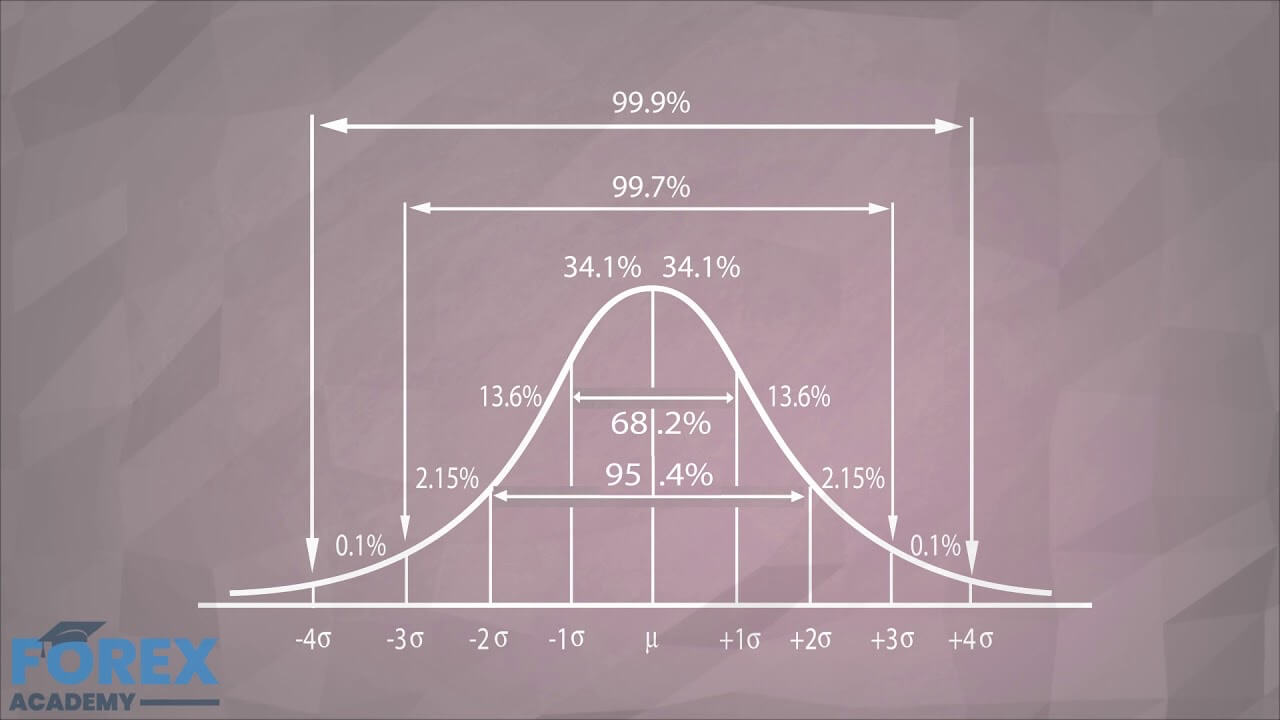
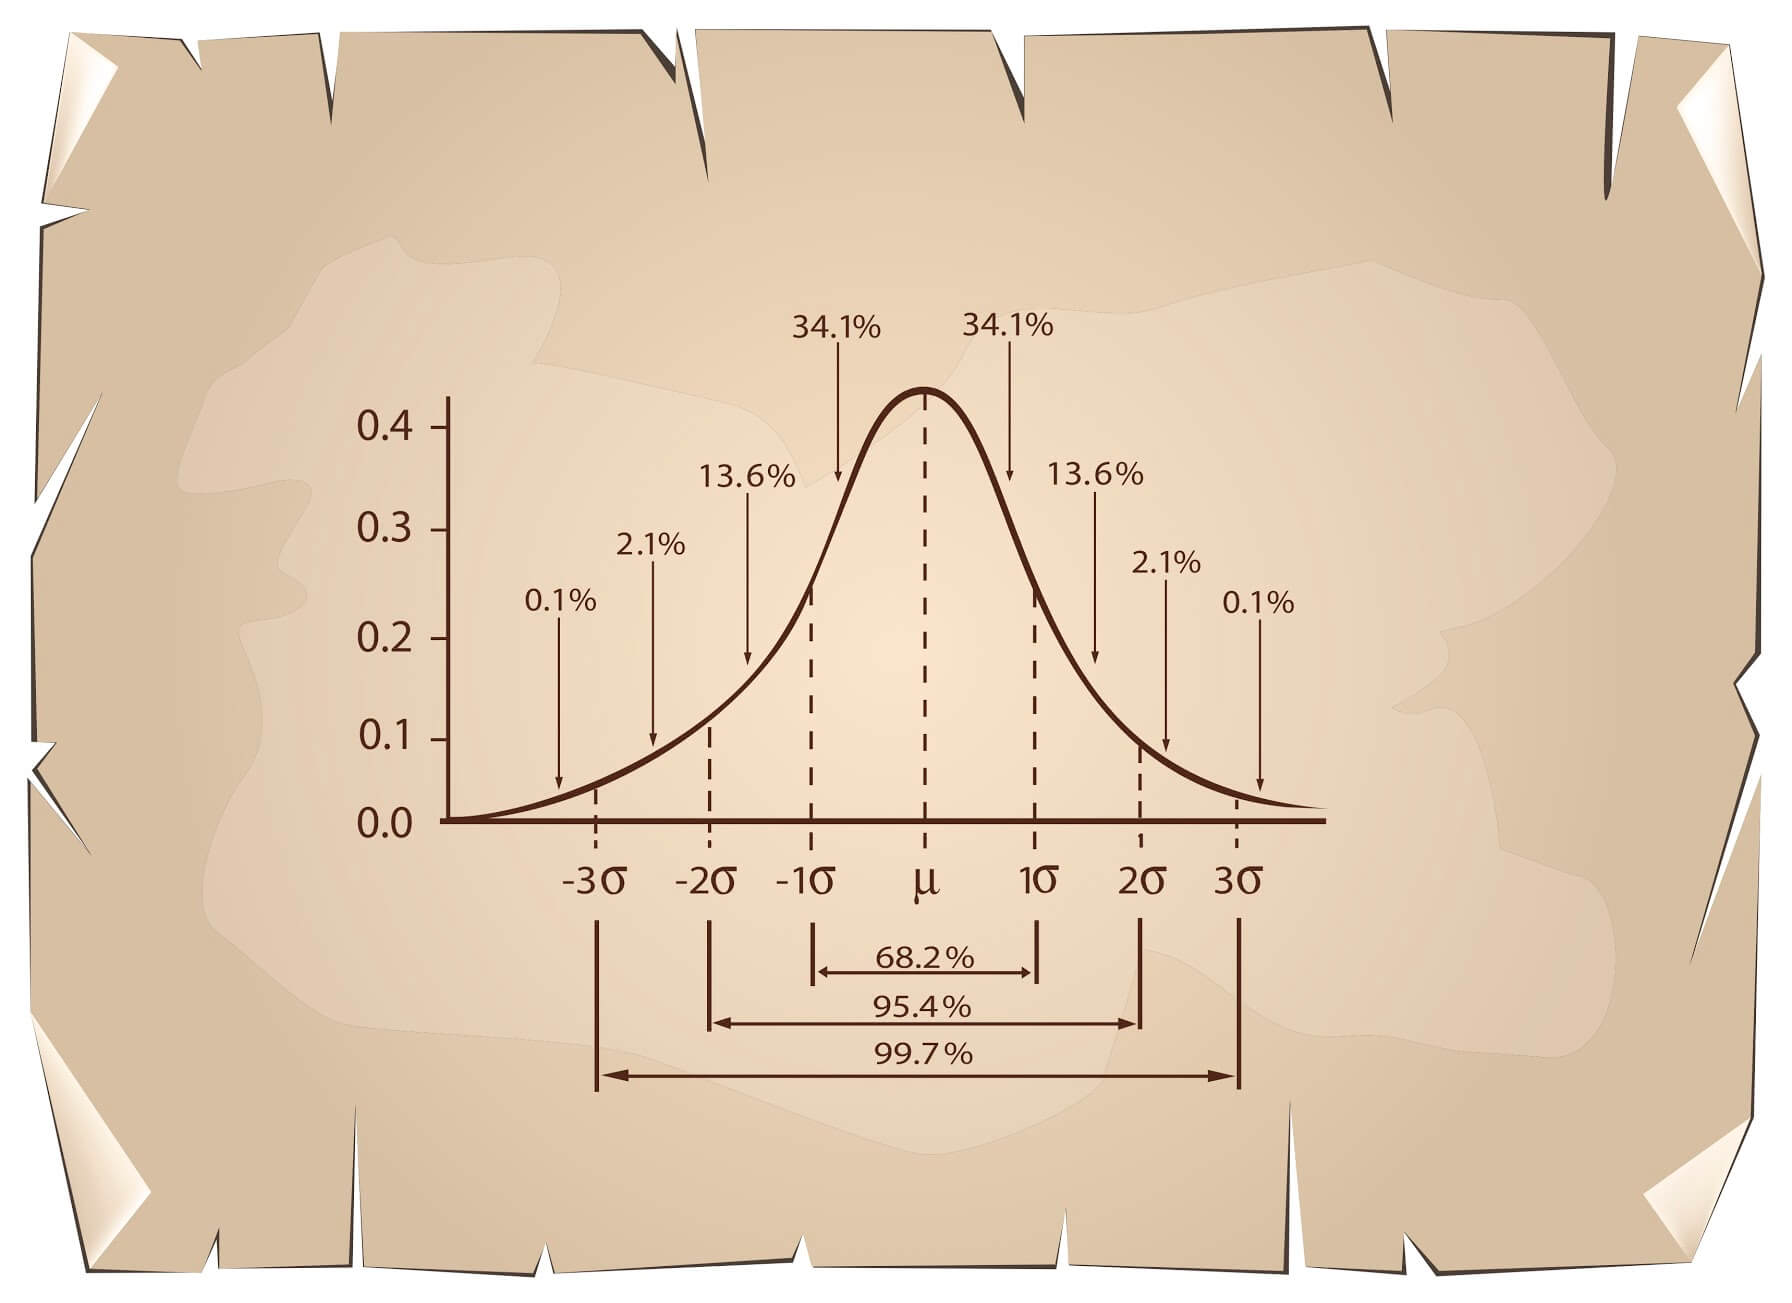
Although all Normal distributions have the same shape, each one has different mean and standard deviations. We know that the area under de curve shows the probability of a new value falling within that area. For instance, we know that the likelihood of a value falling between the mean and +1 standard deviation (SD) of the mean is 34.1%.
So to have a proper picture of where a point is in the distribution, it is essential to standardize it.

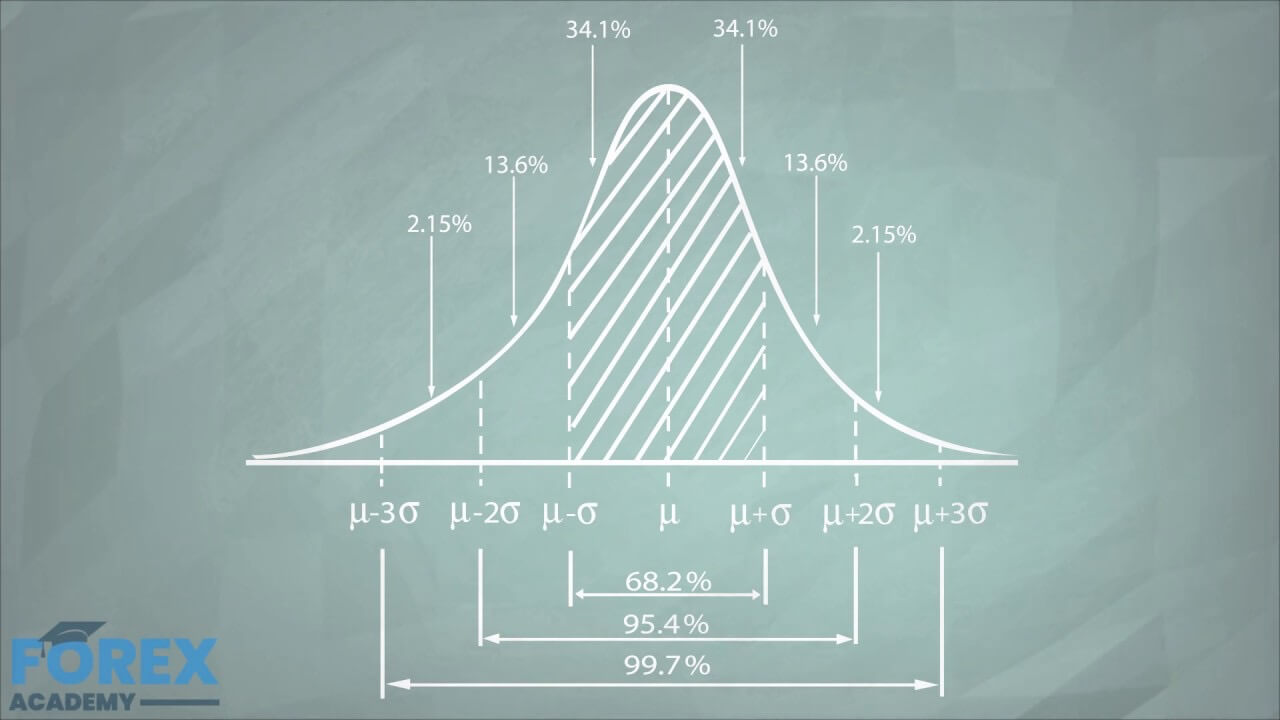
A standardized Normal distribution is called a Z-Distribution. Every value in a Z-Distribution is called a Z-Score and represents the number of standard deviations that value is away from its mean. For example, if a EUR/USD price is +1.5 SD away, the z-score of that value is 1.5.
To compute the Z-Score of a value X, we simply subtract the mean from X and divide its result by SD.

Z = (X-m)/SD,

where m is the mean.

Evaluating the Market with Z -scores
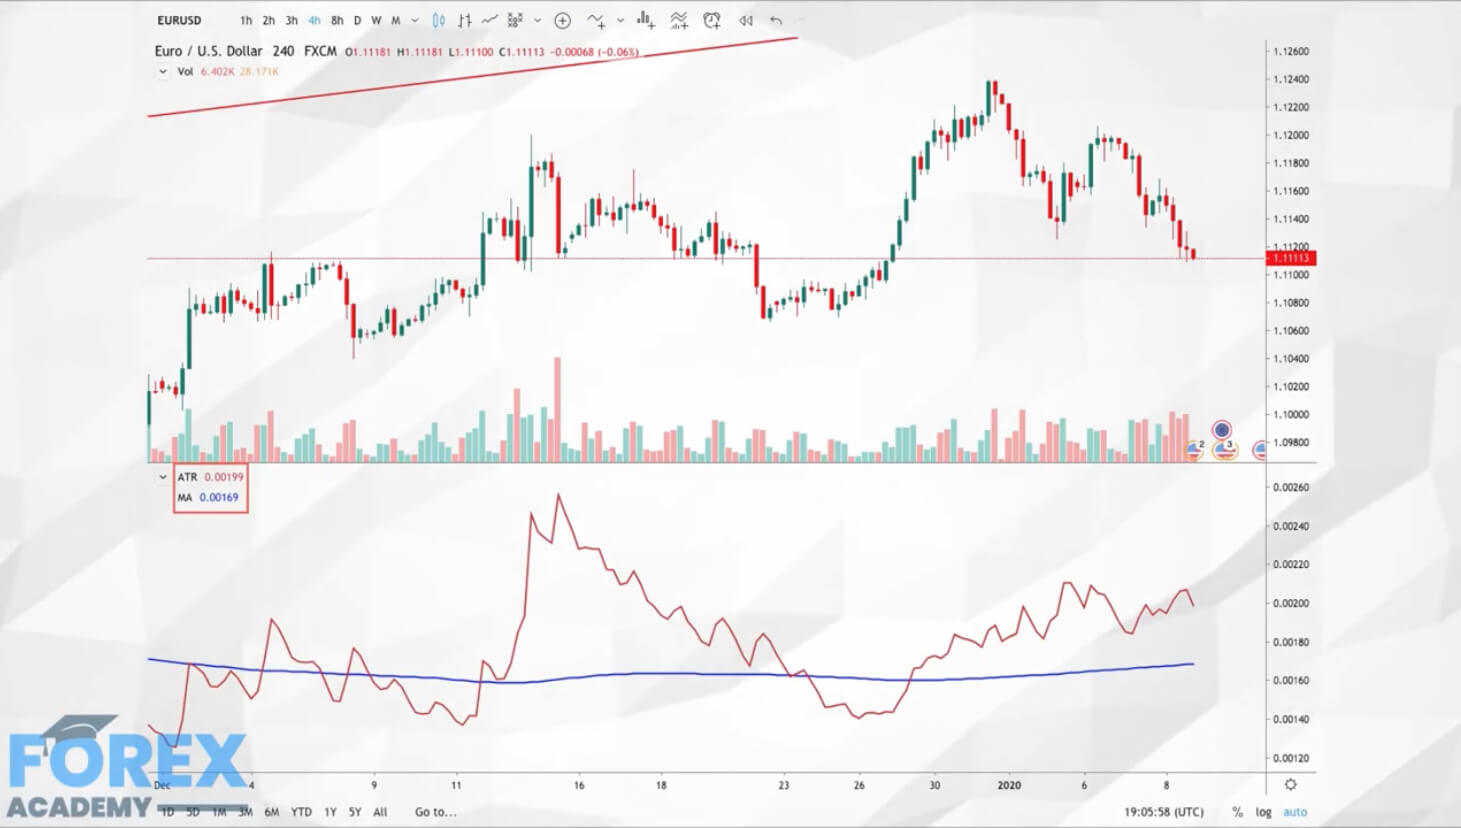
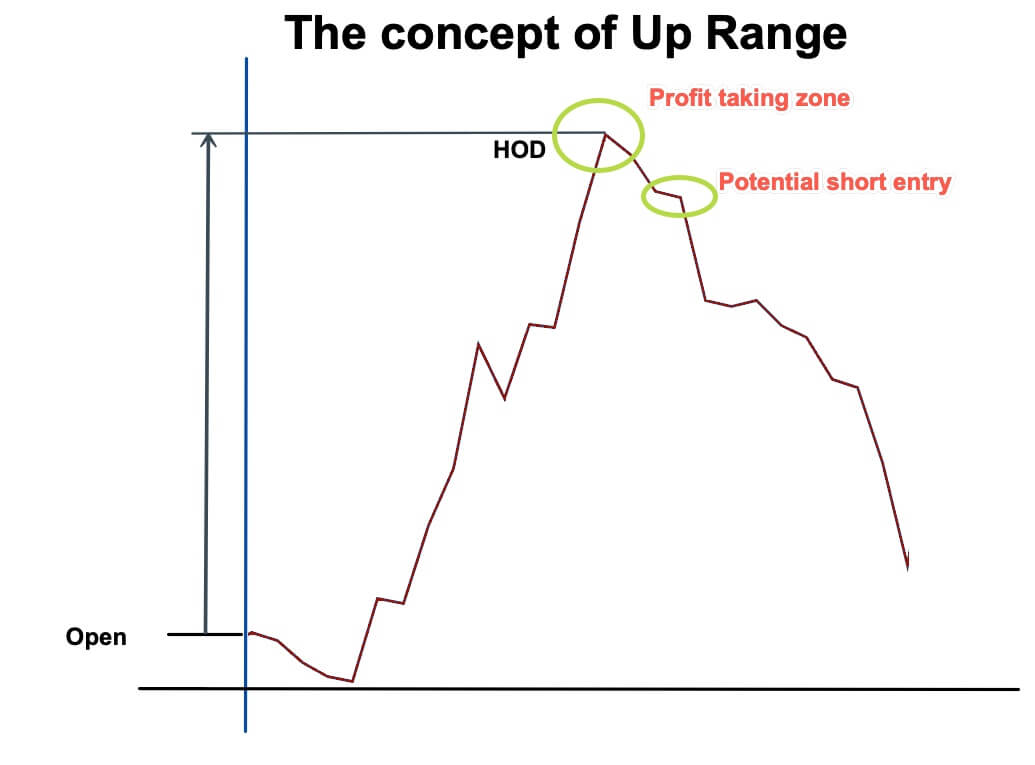
The different currency pairs tend to move in long-term trends and short-term oscillations around their average. The first measure we can do to a currency pair to detect overextension is by a z-score using a short-term period such as 30 sessions. By taking the 30-session average and standard deviation, we can convert all the pair’s values into z-scores and assess how far the price is from the consensus price of the last 30 days.

Statistically Assessing the Strength of the Trend

A trend can be described by a price change. That is, prices making a slope. The slope of the trend shows the strength of the trend. The steeper, the stronger. If the slope is zero or very close to it, the market is ranging.
We can use simple periodic price subtractions, such as used by the Momentum indicator, or we can determine that slope using linear regression formulas and, from those lines, compute the gradients.
With a sizeable historical price database, it is possible to compute the typical slope and the standard deviation of the mean and its standard deviation.


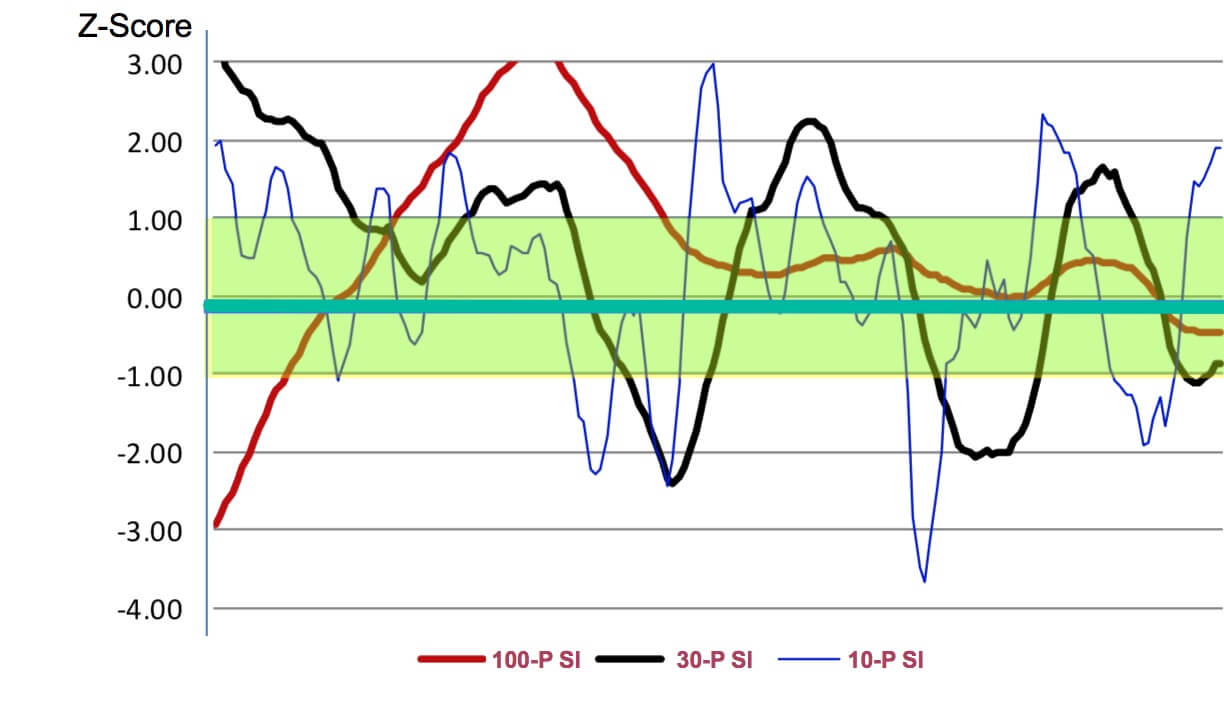
To thoroughly assess a market, we could determine values for each timeframe of interest using 10, 30, and 100 periods. After having these values, we will be able to compare the current slope against its historical model, and the z-score will tell us how far it is from the mean if it is overextended and where on the map is against the other timeframes.

Signal to noise ratio of a market (S/N)

The concept of Signal-to-Noise is to determine how much of the price action is signal versus noise.
Signal is the component that gives a direction: The Close minus the open in absolute values

Signal = ABS( Close – Open)

Noise the range outside this. Thus we can compute the ratio of signal over the total range:

S/N Ratio = Signal/ range.

A day with a 100 percent signal and no noise will occur if the open and the close are at the extremes of the range. 0 percent signal will happen if Open =Close.


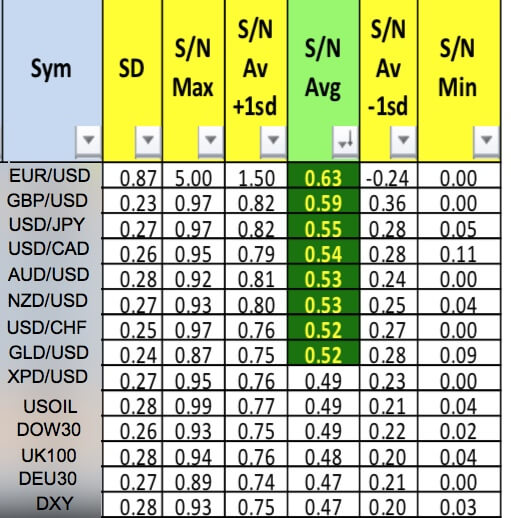
By keeping a record of each forex asset, we could easily evaluate which pairs show more trendiness and less nose. These will be more likely to produce gains. We can also classify S/N information using z-scores and to find where the current signal-to-noise of an asset compares against its average, to time the market in and detect the next wave of increasing signal to noise leg on the cyclic pattern.

Our next episode will deal with ways to evaluate the quality of a trading system and also apply this concept to the markets.

Categories
Forex Daily Topic Forex Videos

How To Get An Edge In Forex Using Statistical Thinking – Trade Like A Forex Titan Part 2

Stats Applied To TradIng Part II

In our last episode, we discussed how to qualify turning points as a filter to validate TA signals based on the intrinsic statistical properties of the Normal Distribution.
In this video, we will continue developing ideas to improve the chances of success in Forex and Crypto trading.

Better Fibonacci Retracements and Extensions


Fibonacci retracement is a prevalent indicator to evaluate retracement entry points, and a Fibonacci extension is also a popular method to assess potential target levels. It is based in the golden ratio, coming from the Fibonacci number sequence. As you should know, the Fibonacci sequence starts by 1,1, and the following members come from the addition of the two previous numbers.


As the numbers grow, a Fibonacci number divided by its previous number in the series gives the golden ratio: 1.6180. The reciprocal, a Fibonacci number divided by the next number, provides the other golden ratio: 0.6180. 0.382 comes from the ratio of a Fibo number and the second next. 0.236 is the result of a Fibo number divide by its 3rd next. 0.1459 results from the division of four distanced Fibo numbers, and we could go on forever. To these ratios, trading software adds the 0.5 and 0.75 levels and the complimentary and extensions.

It is hardly useful to have a forecasting tool that tells you the next retracement could end at 14.6%, 23.8%, 38.2%, 50%, 61.8%, 75%, 85%, or 100% of the last top, but with no likelihood associated with each level.


What if we could classify the retracements and assign them the probability of occurrence? Well, we really can. We could keep a record of all the past retracement, organized for the bull and bear movements, and then bin them in chunks of 10 percent and create a histogram and, from there, assign a probability to each bin. Or, we could just take the average and the standard deviation of all retracements for bulls and bears, separated, and use the well known probabilistic profile of the Normal Distribution to assess probabilities.

That would also apply to extensions. By keeping track of every impulsive movement following a retracement, we can typify the behavior of the asset. We could create the average and standard deviation of the last 30-50-100 occurrences and create a statistical profile similar to the retracement case.

In the case of the retracements, we can see that the average plus 1SD would be very high probability entry points since only 16% of the cases the retracement went further down.
In the case of extensions, the average minus one SD would be a sweet spot for the first take profit level, being the second the average and the third the average plus one SD.

Stop Settings

Until now, we have discussed entry and exit points taken from a statistically minded perspective. What about setting stops in the same way instead of the obvious levels everybody notices, including institutional traders?

Setting stop levels can be rather straightforward if we know the distribution of the prices. If the entry point takes place at the average +1SD retracement level, the average plus 2SD is a good stop level, as the likelihood of the retracement to reach it would be just 5%.
We could, even, keep track of the history of stops, using John Sweeney’s Maximum Adverse Excursion concept. To summarize it, The MAE method is a stop-loss setting system that tries to place the stops at the historical optimal level based on past trades.

The method tracks the price paths during positive trades to see the maximum adverse excursion taken by the trades before moving in our favor. That way, we could detect the level beyond which there is a high probability that the trade will not be profitable. That is the optimal level for the stop-loss.

For more on Stop settings, please read:

Maximum Adverse Excursion

The Case for Average True Range-based Stop-loss Settings

Masteting Stop-Loss setting: How about using Kase Dev-Stops?

Categories
Forex Videos

How To Get An Edge In Forex Using Statistical Thinking – Trade Like A Forex Titan Part 1

How to get an Edge using Statistical Thinking I

Do you know the difference between institutional traders and the average retail trader?
Well, there are many obvious differences, including the capital available to them. Still, the most significant factor is that you blindly believe in technical analysis, whereas they use other higher-level techniques to be ahead of them, ahead of you.

The mathematician is highly paid in the financial markets for a reason: They make the real difference. The marketplace is a battlefield, and quant analysis is analogous to smart drone attacks, whereas trading using TA is like fighting with spears and arrows.

But I don’t have that software!

Of course, pros use large databases and sophisticated analytical software, machine learning, and so forth. If you are serious about trading, you should consider creating your custom analytical software. The use of high-level languages such as Python in combination with Pandas, a terrific statistical package, and a bit of code, would put you into the next level. Still, with patience, dedication, and a spreadsheet, you could collect your own information. Excel also included quite a decent statistical package.

Metatrader 4 to Excel

It is possible to automate your data capture from your MetaTrader 4. MetaTrader 4 has a DDE Link. It is straightforward to get it done.


You simply need to enable the MT4 DDE server and place a simple code in the corresponding Excel cells.


=MT4|BID!EURUSD
=MT4|ASK!EURUSD
=MT4|HIGH!EURUSD
=MT4|LOW!EURUSD
=MT4|TIME!EURUSD

Average Trading Ranges


Determine trading ranges can be accomplished using the Average True Range Indicator (ATR). There is no need to collect data to use it, and it will provide you the basic information to know a lot of things. Using a short-term value such as a 10-period ATR will tell you of the Forex pair you intend to trade is experiencing a period of low or high volatility, or if its current range can be considered as normal. This knowledge will show you several interesting facts that may decide if it is worth trading or not.
1.- The ATR is the average range for the period. Therefore, it tells you the expected movement of the timeframe of your chart. So it is at the same time, your risk and your potential profit per timeframe. It tells you several pieces of information:

Your stop loss pip distance divided by the current ATR will say to you the average time it will take the market to reach your stop. For example, in a 4-Hour chart, if your stop-loss is 10 pips away and your STR is 16 pips, you know the average time a bad trade will take to reach your target is 10/16 x 4hours = 2.5 hours.
Your profit distance divided by the current ATR will tell you the average time it will take your trade to reach your target.
Your trading costs, Spread+ Fee+ Slippage multiplied by the profit to ATR ratio computed above, divided by the ATR and multiplied by 100 will tell you the percentage of the projected profits are needed to break-even.
That value will help you to decide the best timeframe for your needs. If you’re aware of the overall cost of the operation, you may realize your mostly working for your broker and that a better timeframe is needed or that the current market ranges are not suitable for trading.

Determining turning points and the concept of range_stats

Now, if we collect the averages of trading ranges, we can get a lot of more exciting insights about the market.
What if we could get a real edge over the market, statistically relevant and profitable long term?
Going back to our previous video about the Normal Distribution, we talked about the Central Limit Theorem. This theorem says that the average value of a collection of samples will be normally distributed.
If we apply this concept to a collection of ranges, we will get a Bell-shaped curve, including its statistical properties.

UP and Down Ranges


If we have our data collected, we could compute the average range from the opening of our session to the low of the session. Let’s call this piece of data the Down_Range.

We can do the same for the gain data. That is the range from the opening to the high of the session. That will be called the UP_Range.
If we store the UP__Range and the Down_Range measurements, we can compute the average of the last 30, 50, or 100 days and its standard deviation (SD) and apply some statistical thinking on it.

In our previous lesson about the Normal Distribution statistical properties, we’ve learned that 68.2% of the data points belonging to a Normal distribution are located in the region between the average plus and minus one SD. That means only 31.8% of the data points are beyond that area. And looking to the right side, only 15.9% of the ranges are higher than the average plus one SD.
On this fact lies our trading edge: Our data collection of Up and Down ranges tells us how far, on average, the asset moves before turning in the opposite direction.
Thus, our TA signals will be much more statistically significant when the UP or Down typical range has been exceeded by 1SD, there is a high likelihood the currency pair is reversing.
Taking profits can also be aided by this type of strategic information, as we could compute the typical range the asset moves after turning in the opposite direction and apply it to our trade setting.

More on Statistical thinking in our next video.

Reference: Ken Long Tortoise Methods

Categories
Forex Daily Topic Forex Videos

The Basics Of Statistical Analysis In Forex Part 1 – Understand Your Edge

The Basics Of Statistical Analysis In Forex Part 1 – Understand Your Edge

Anyone interested in Forex trading needs a basic knowledge of statistics, and even the basic rules governing probabilistic calculation. Do not quiver yet. We promise you that this will be simple and entertaining, at the same time.

But why do we need all this?
A possible answer can be found in our latest video article “Why Knowing your Strategy parameters makes sense.” But, ultimately, because if you are serious about your profession as a trader, this is one essential ability to hold.

Basic terms we need to know

Probability: this area of math study involves predicting the likelihood of various outcomes. For instance, the possibility of your next trade is a winner. This mathematical area is a modern development of what early on was the mathematics of gambling. Probability theory is also related to the theory of errors, of which Pierre-Simon Laplace was the first to propose back in 1774 analytical formulas about the frequency of errors.


Statistics: We can define statistics as a collection of facts belonging to a collection of events, objects, or, more generally, a set. There are two kinds of statistics: Descriptive statistics try to describe a set in such a useful way. We can, for instance, describe a typical Englishman by its average height, weight, number of hours of sleep, the average income, the average number of males, and so on. Another type of statistics is “Inferential statistics” or statistical inference. Sometimes, it is not practical (or impossible) to measure all items produced by a process, such as on trading. Therefore, we take a sample of the whole data collection, and through it, try to infer general properties or forecast or approximate its future events.


Chance: We refer to chance if we know the event is uncertain to occur. Of course, if we see the event will always happen, for instance, the sunrise, the chance is 100 percent sure to occur. In trading, we use it in connection with the probability of a trade to be a winner or a loser. Generally, we refer to the chance of occurrence when we lack the specific knowledge for an event to happen. Still, we might infer its probability based on the previous events statistics.


Stochastic: When the chance is involved, the process is called stochastic or having stochastic relations. Stochastic is the opposite of deterministic. Newton’s Laws are deterministic. There is no element of chance involved. But practical measurements of objects following these laws involve some elements of chance since instruments have intrinsic errors and people measuring it also err.

Random: Random is an event that cannot be predicted. For instance, Nobody can predict the future price of an asset. Not even the price it will have the next mintute. A random sample is when every member of the set or collection has an equal probability of being chosen for the sample set. If some elements are more likely to appear then others, then this particular sample is not random. In trading, a random market is unpredictable. Is the noise of the price. Nobody can profit in a random market long term. But, sometimes, the market is a mix of randomness and bias or trend. In that case, traders who caught the trend can be profitable.