Stats for Traders III – Z-Scores, Market Strength and Market Signal to Noise
Z-Scores
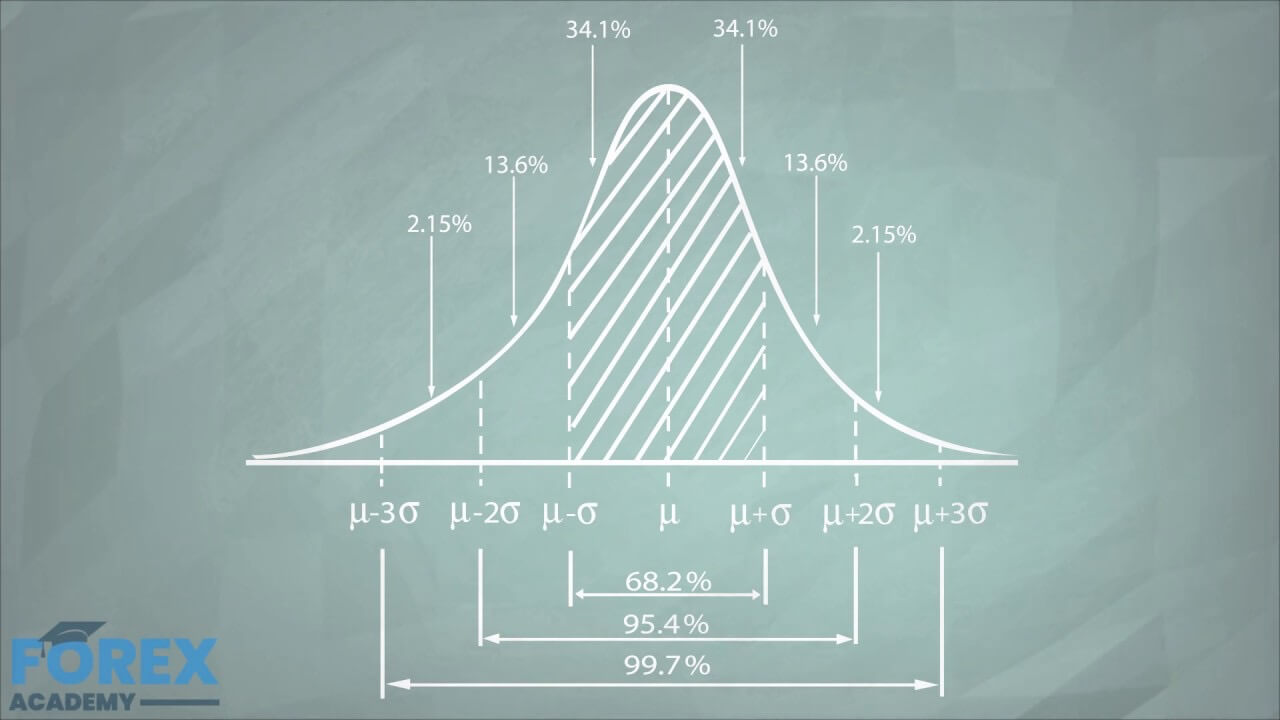
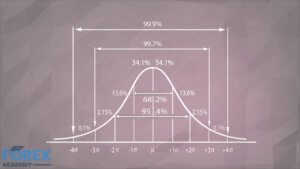
Although all Normal distributions have the same shape, each one has different mean and standard deviations. We know that the area under de curve shows the probability of a new value falling within that area. For instance, we know that the likelihood of a value falling between the mean and +1 standard deviation (SD) of the mean is 34.1%.
So to have a proper picture of where a point is in the distribution, it is essential to standardize it.
A standardized Normal distribution is called a Z-Distribution. Every value in a Z-Distribution is called a Z-Score and represents the number of standard deviations that value is away from its mean. For example, if a EUR/USD price is +1.5 SD away, the z-score of that value is 1.5.
To compute the Z-Score of a value X, we simply subtract the mean from X and divide its result by SD.
Z = (X-m)/SD,
where m is the mean.
Evaluating the Market with Z -scores
The different currency pairs tend to move in long-term trends and short-term oscillations around their average. The first measure we can do to a currency pair to detect overextension is by a z-score using a short-term period such as 30 sessions. By taking the 30-session average and standard deviation, we can convert all the pair’s values into z-scores and assess how far the price is from the consensus price of the last 30 days.
Statistically Assessing the Strength of the Trend
A trend can be described by a price change. That is, prices making a slope. The slope of the trend shows the strength of the trend. The steeper, the stronger. If the slope is zero or very close to it, the market is ranging.
We can use simple periodic price subtractions, such as used by the Momentum indicator, or we can determine that slope using linear regression formulas and, from those lines, compute the gradients.
With a sizeable historical price database, it is possible to compute the typical slope and the standard deviation of the mean and its standard deviation.
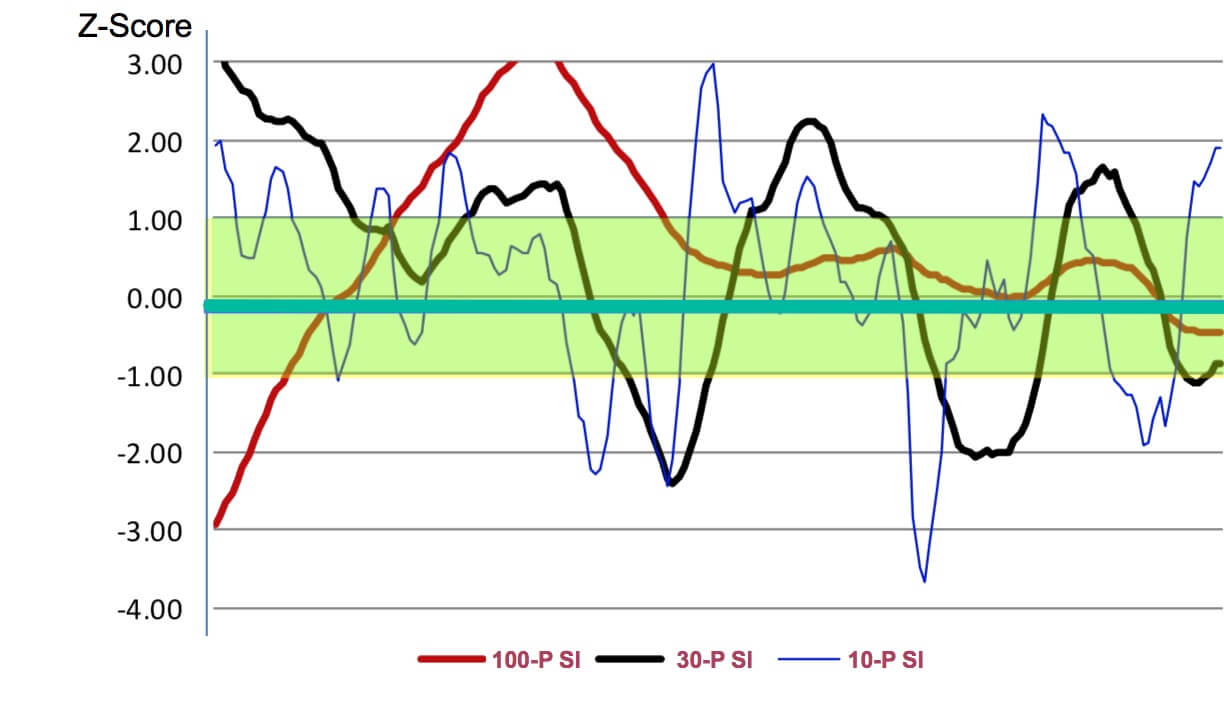
To thoroughly assess a market, we could determine values for each timeframe of interest using 10, 30, and 100 periods. After having these values, we will be able to compare the current slope against its historical model, and the z-score will tell us how far it is from the mean if it is overextended and where on the map is against the other timeframes.
Signal to noise ratio of a market (S/N)
The concept of Signal-to-Noise is to determine how much of the price action is signal versus noise.
Signal is the component that gives a direction: The Close minus the open in absolute values
Signal = ABS( Close – Open)
Noise the range outside this. Thus we can compute the ratio of signal over the total range:
S/N Ratio = Signal/ range.
A day with a 100 percent signal and no noise will occur if the open and the close are at the extremes of the range. 0 percent signal will happen if Open =Close.
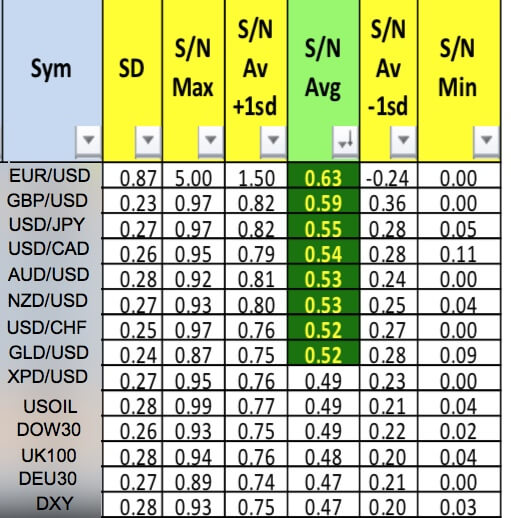
By keeping a record of each forex asset, we could easily evaluate which pairs show more trendiness and less nose. These will be more likely to produce gains. We can also classify S/N information using z-scores and to find where the current signal-to-noise of an asset compares against its average, to time the market in and detect the next wave of increasing signal to noise leg on the cyclic pattern.
Our next episode will deal with ways to evaluate the quality of a trading system and also apply this concept to the markets.

