Into the Hardcore of Technical Analysis
One of the most common mistakes new traders make is to overload their screens with technical indicators. And where they were looking for signals, they end up clogging up the screens with indicators. The problem with having too many is that they often send conflicting messages. This means that they cannot see the wood for the trees!.
There are literally dozens of technical indicators available to traders nowadays, including leading and lagging indicators. An example of a lagging indicator would be a moving average, and an example of a leading one would be price action itself. Some indicators tend to identify opportunities in range-bound markets; others identify opportunities in trending markets.
Leading indicators, including price action, work especially well during periods of sideways market movements.
In a sideways moving market, lagging indicators are almost useless because the market has no clear direction. They can often provide random indications. None of these indicators can make valid predictions about future market movements. Because some indicators are lagging – which is to say they show where the market’s historical price action – the higher the time frame, the more laggy the indicator.
When developing a successful trading strategy, it is wise to use a combination of price action and technical analysis. This is because technical analysis does outline some very good statistical observations in the market. As such, price action will often trade very uniquely around technical areas of interest and can reveal indications of future price movements.
Example A
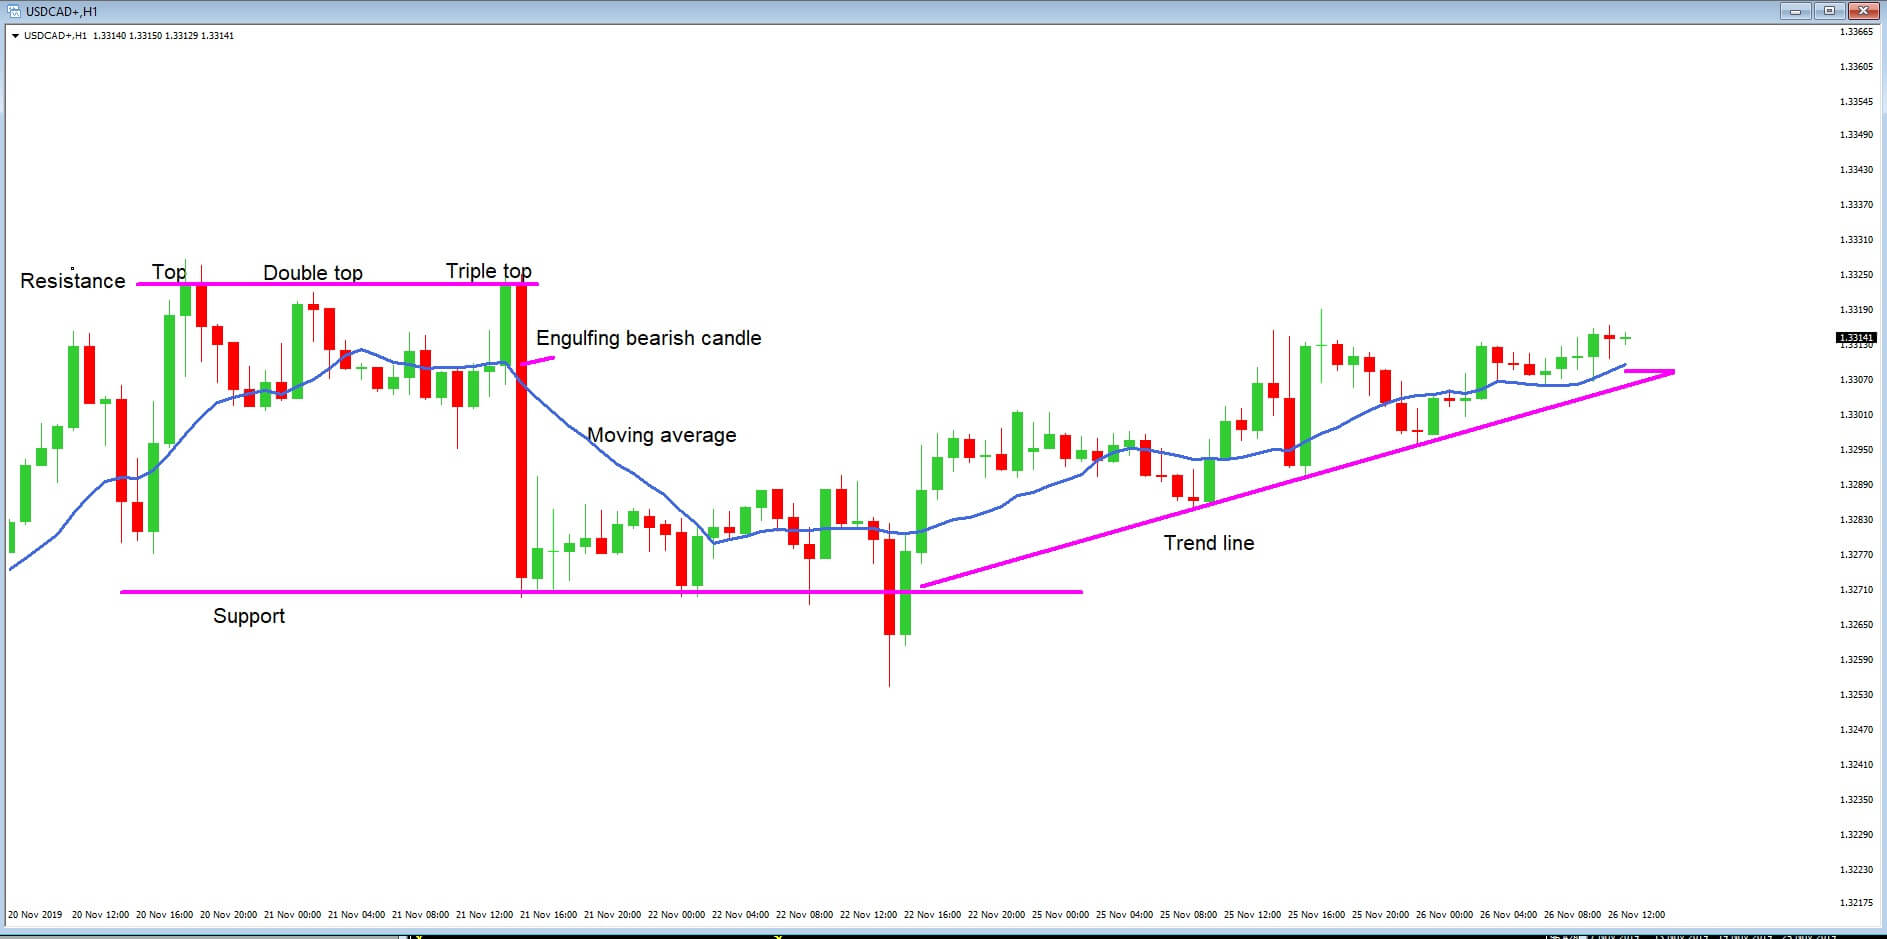
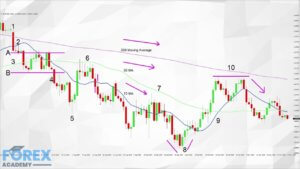
In example A, which is a 1-hour time frame of the USDCAD pair, we have a host of information already on the chart as provided by price action in the form of our favored Japanese candlesticks, the blue moving average indicator, and some comments and lines we have drawn onto our chart.
We can see that on the left of the chart, that price action attempted to break above our area of resistance on three occasions. Where we see the ‘triple top’ failed attempt to break above the area of resistance, and where subsequently bulls threw the towel in, and bears gained the stronghold, as denoted by our engulfing bearish candle.
The moving average offered very little guidance during this period of sideways trading activity. However, when price action fails to break through and remain below the support level after a few occasions, price action then starts to trend upwards, and this is where the moving average becomes more useful.
In this chart alone, we have areas of support and resistance, increases in volume, and trend lines, which are all critical components of technical analysis.
Example B
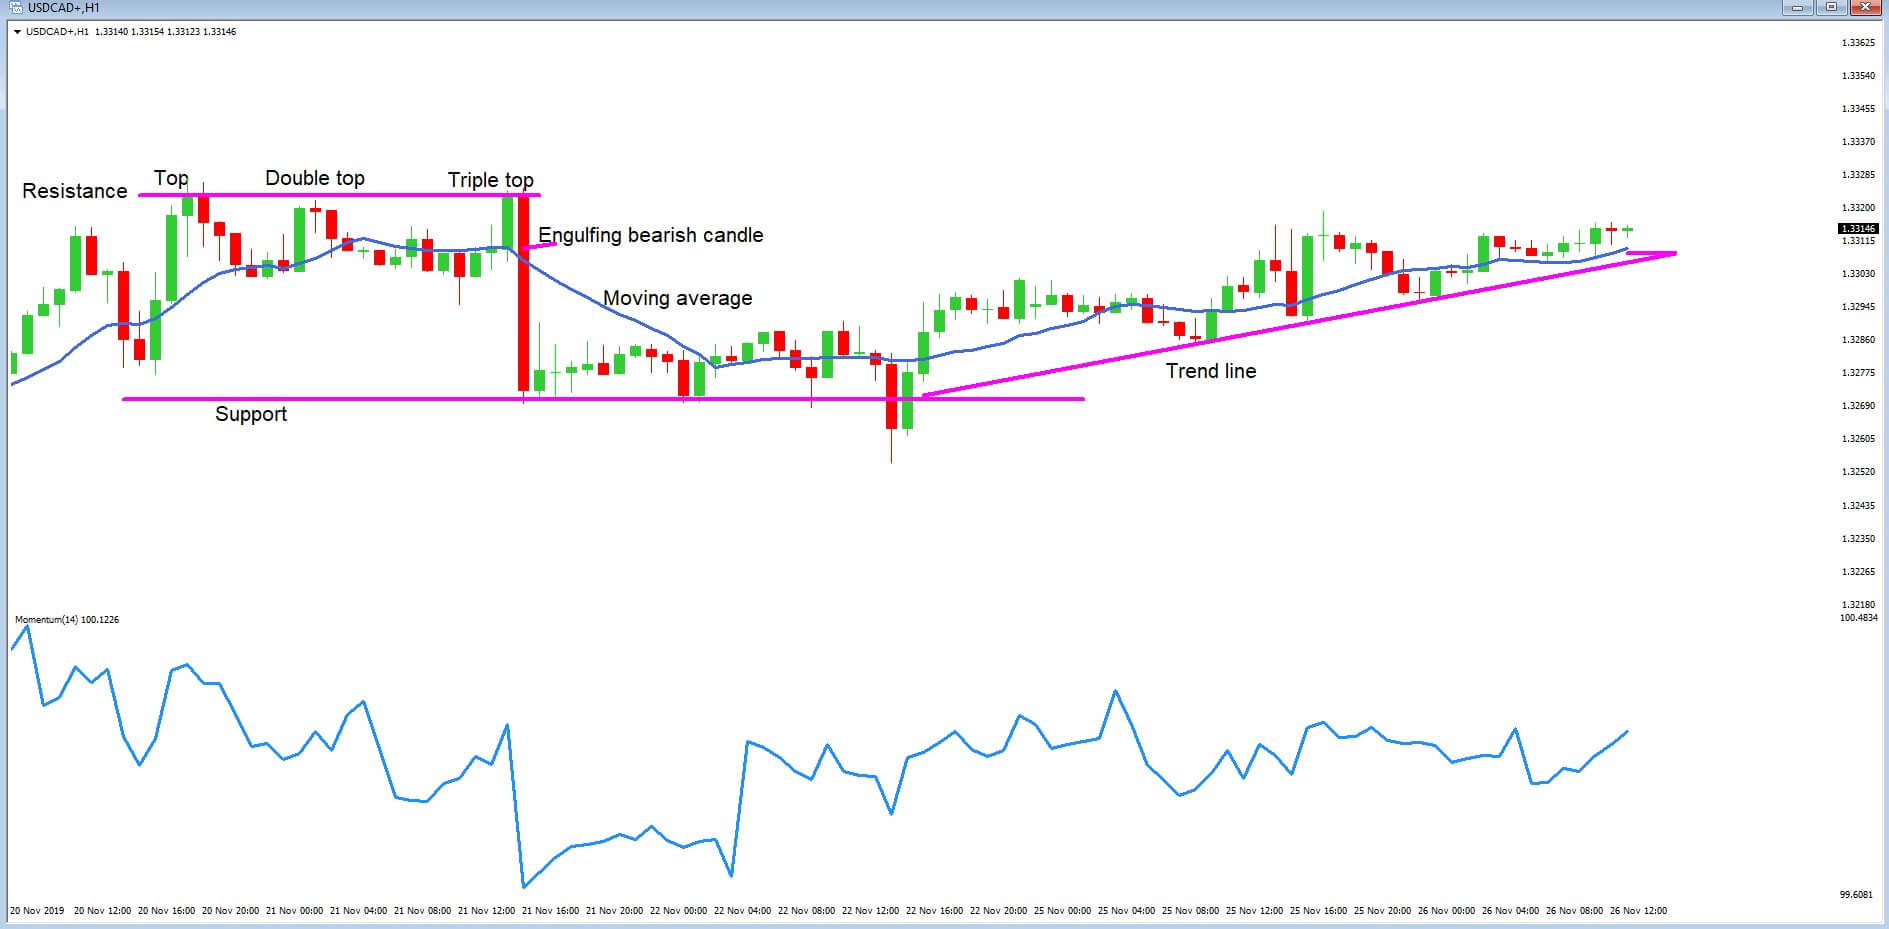
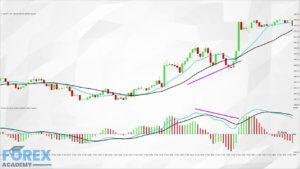
In example B, we return to our chart; however, this time, we have added a momentum indicator which shows the location of the close relative to the high-low range over a set period of time. In this case, the last 14 candles which are displayed on the chart as an average line.
Example C
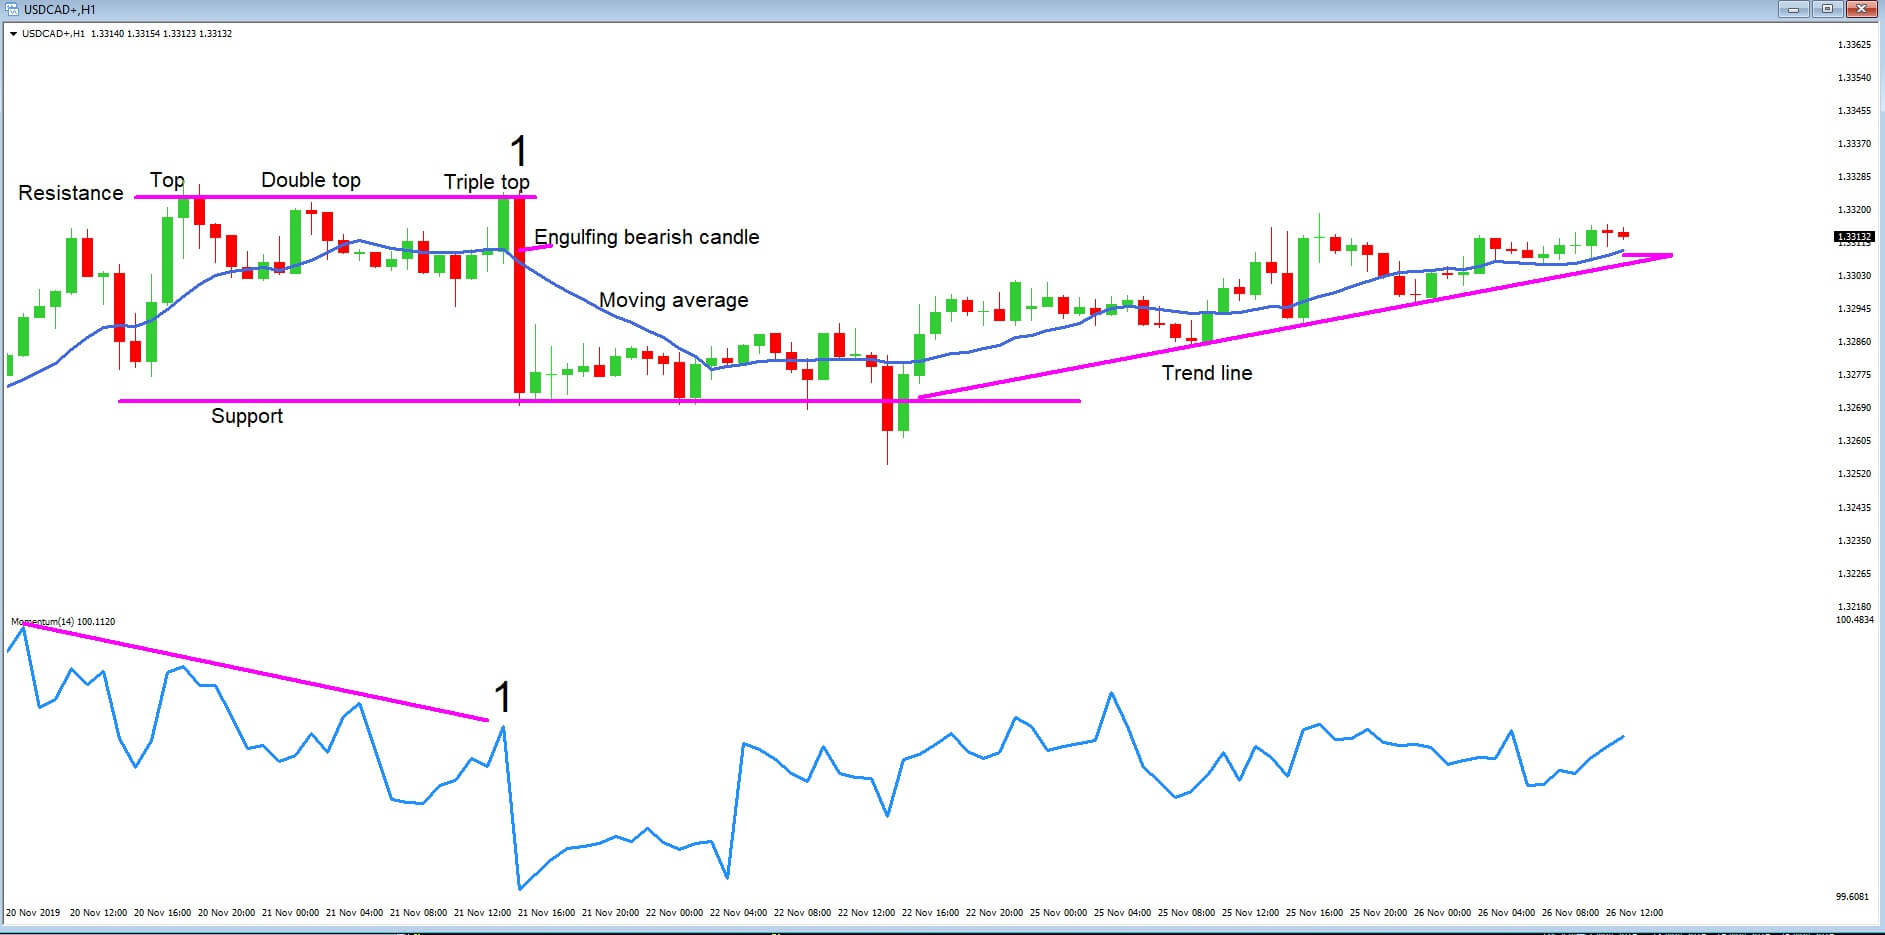
In example C, we can see that momentum was falling lower when price action hit our triple top area of resistance at position 1. Therefore, the momentum indicator was a red flag for buyers and an opportunity for sellers at this point. When an indicator fails to keep up with price action, such as in this setup, it is known as divergence.
Example D
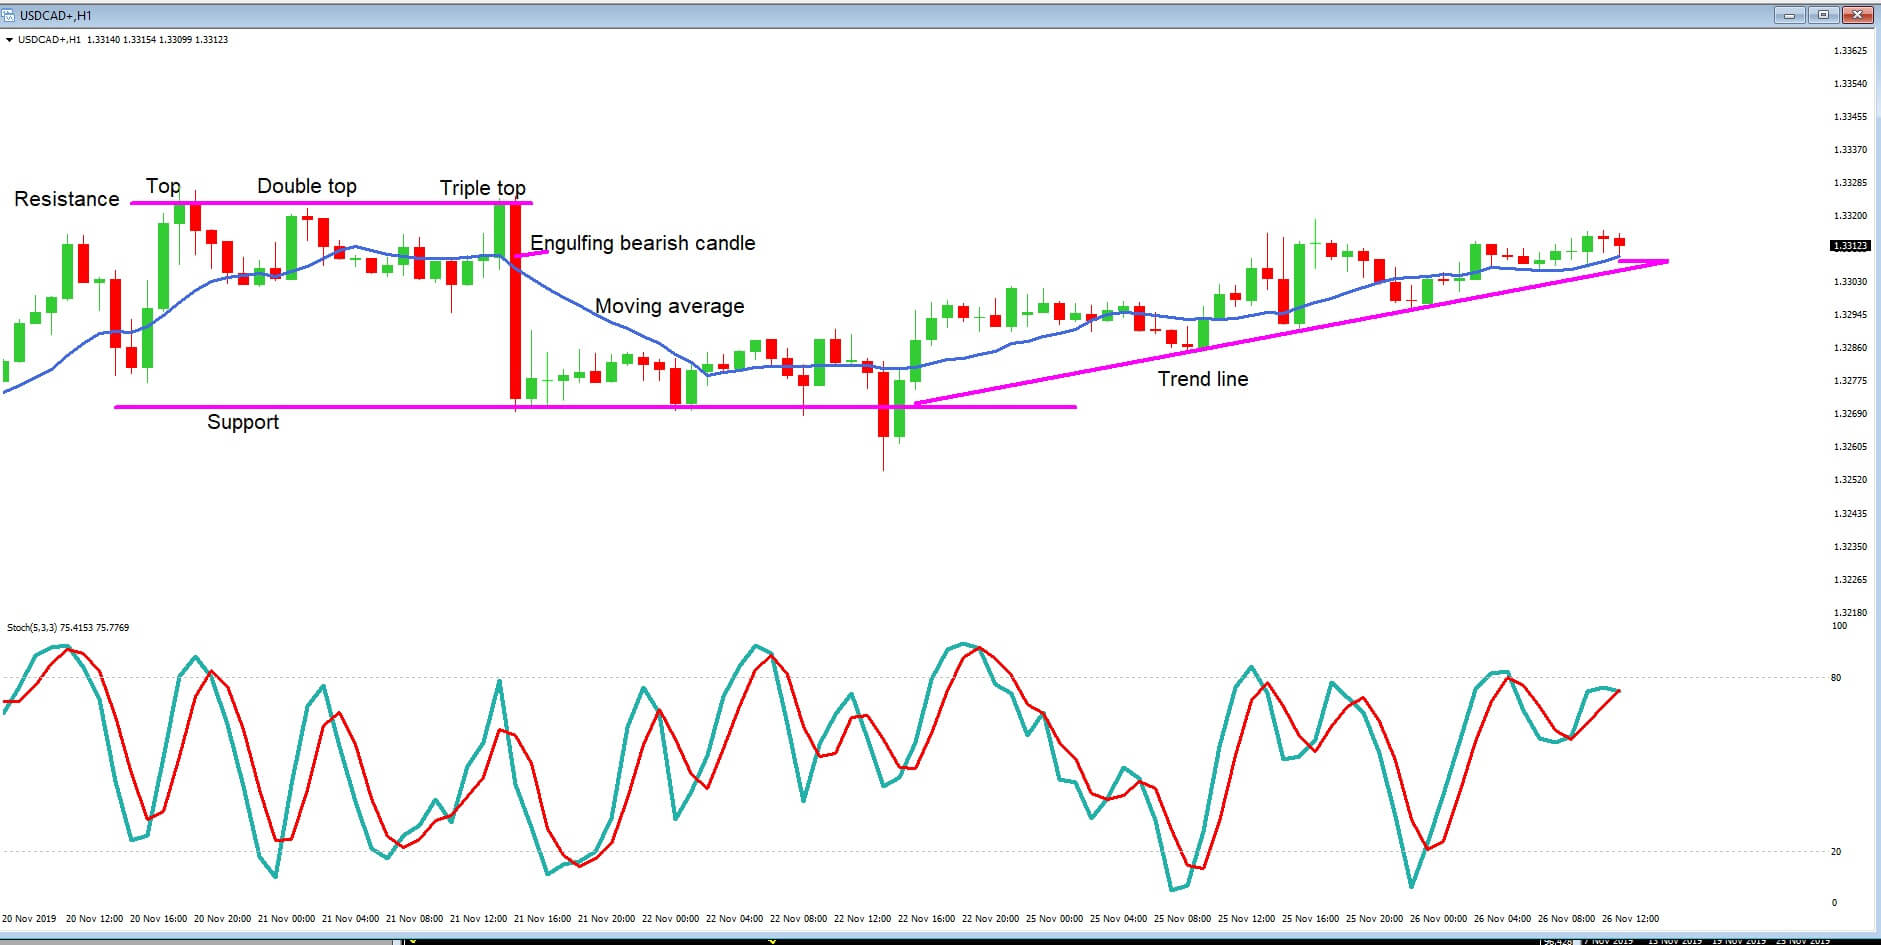
Example D shows another very widely used indicator: the stochastic oscillator. The basic premise is that when the two moving averages move above the key 80 level, an asset is said to be overbought, and when they move below the key 20 level, an asset is said to be oversold.
Example E
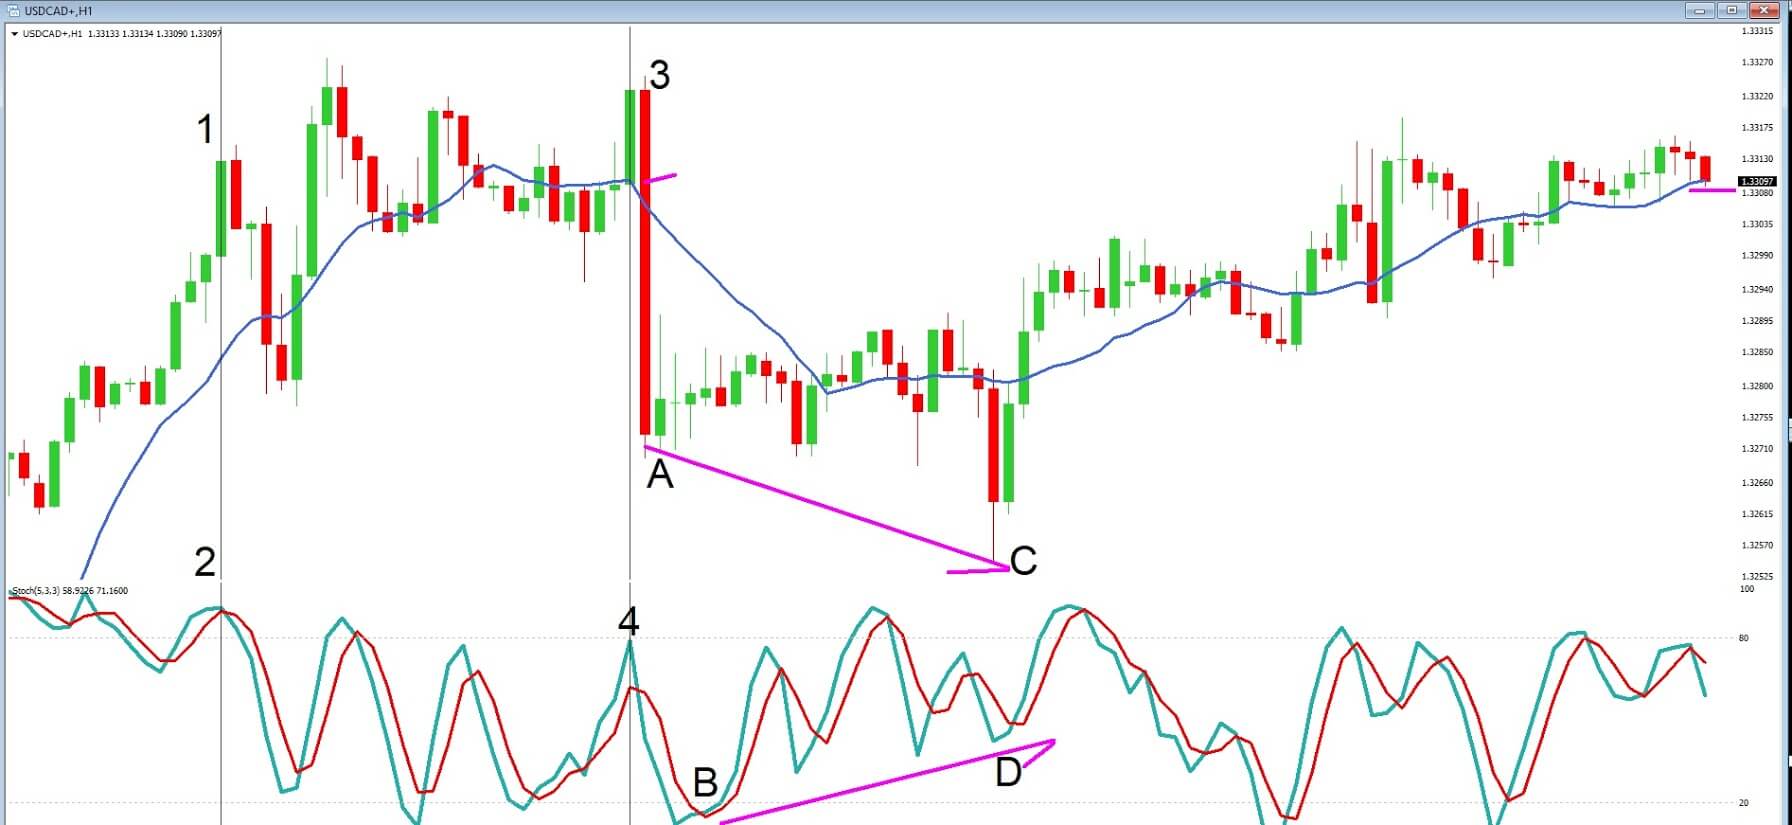
We return to these charts, in example E, where we have cleared away some of the clutter. If we draw a line from position 1 to position 2, we can see that our stochastic has breached the 80-line, showing that price action is overbought, and we see a pullback in price action. At position 3, where our momentum indicator was running out of steam at this point, we also see our stochastic is overbought at position 4, and subsequently, we see price action retreat lower in the form of our engulfing candlestick.
Divergence is also commonly observed when using the stochastic oscillator. We can see that position A to position B is an area of being oversold, and while price action moves higher, it is followed by a sharp move lower at position C. But the overall movement of our stochastics at point D is higher than our low at point B, showing divergence between the indicator and price action and warning traders that bearish price action is running out of steam, and where the subsequent move is higher.
Not every trade is exactly the same, and therefore no matter how many times you use a successful setup, it will not produce winning trades 100% of the time.