Categories
Forex Basics

10 Incredibly Surprising Stats About Forex Trading

Both aspiring and expert forex traders can benefit from learning informative statistics about the forex market; however, you’ll often find a long list of boring facts and numbers when you look up the subject. We wanted our readers to have the chance to learn something new without feeling bored, so we scoured the internet to find the most surprising stats about the forex market out there. 

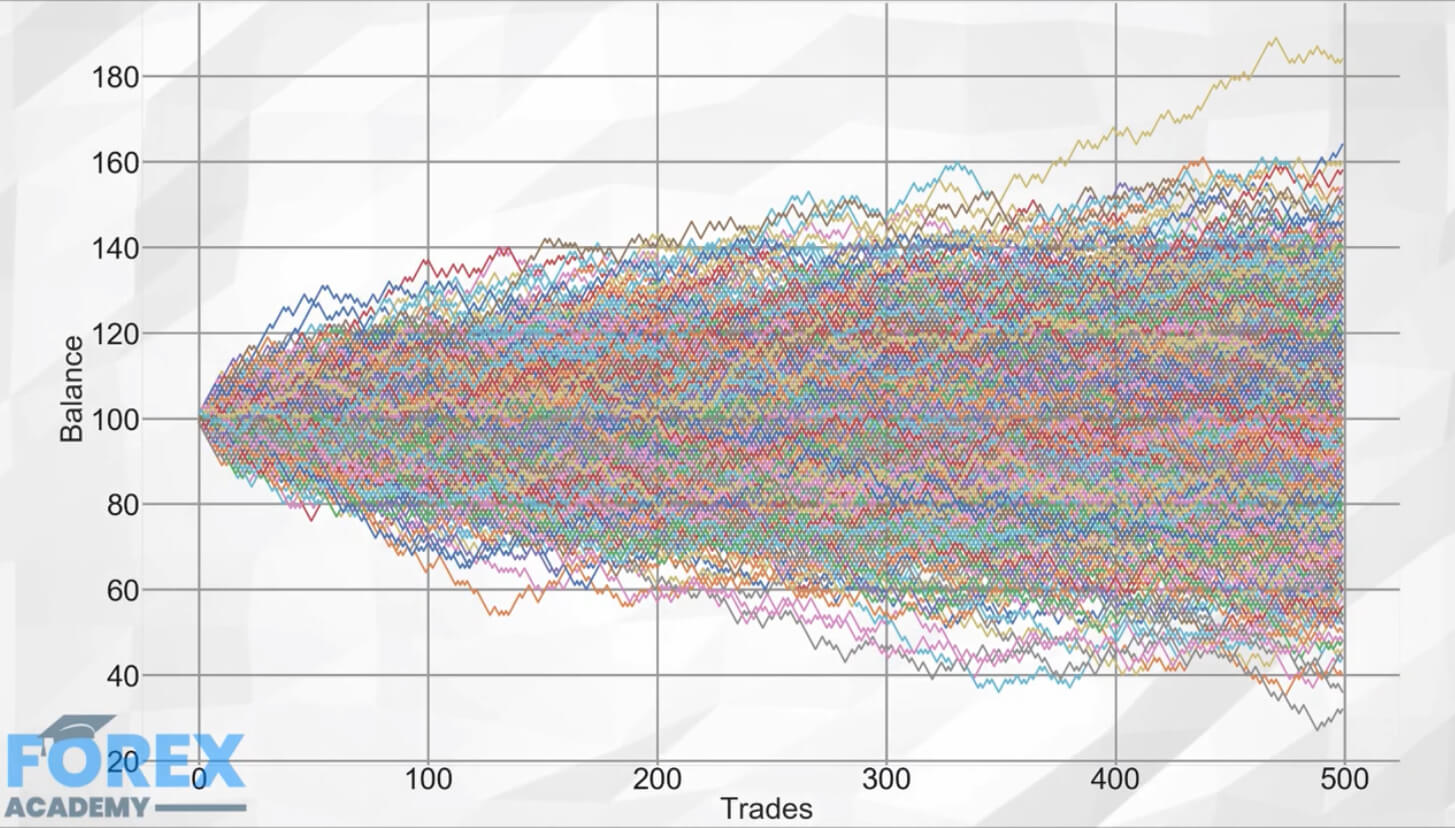
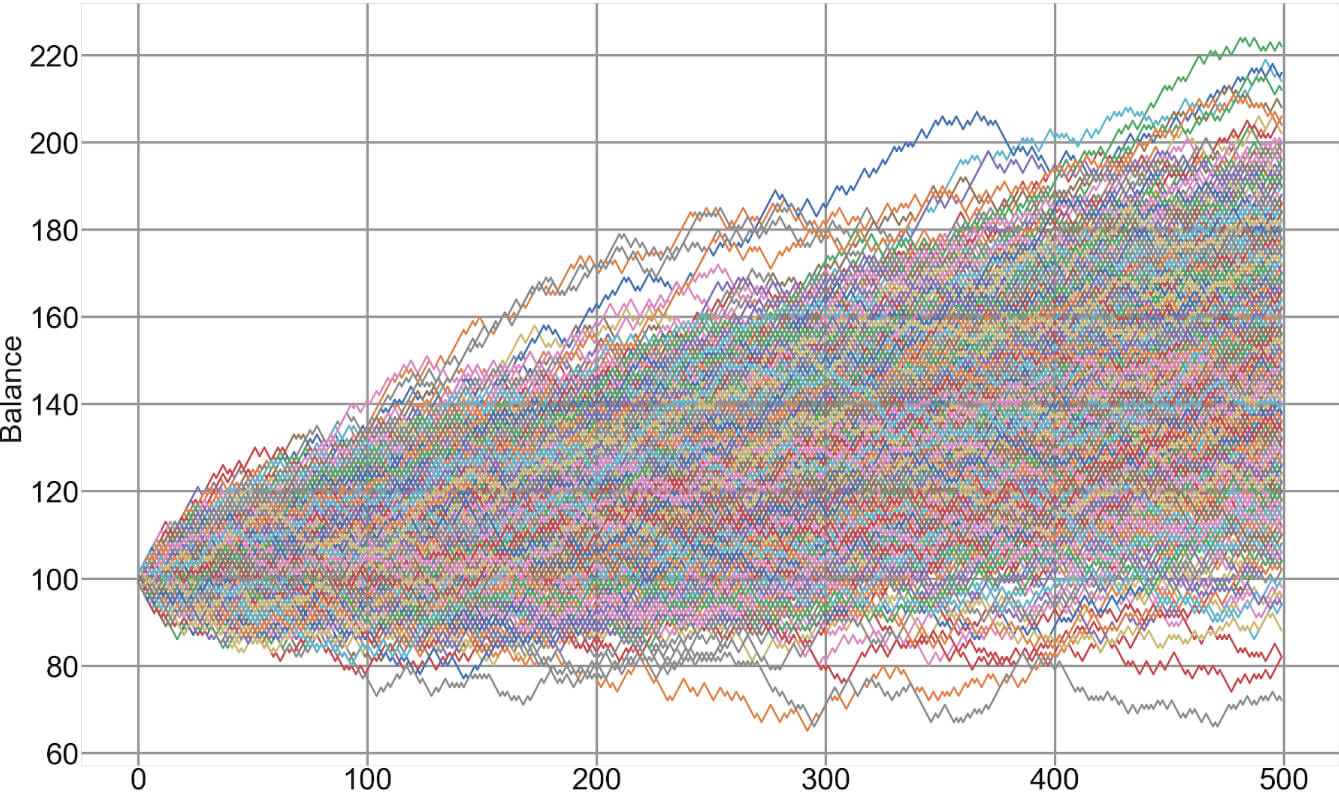
Statistic #1: Only 10% of forex traders succeed

Our first statistic is both depressing and surprising, but the good news is that it isn’t difficult to avoid becoming one of the failed traders we’re speaking of. The majority of this percentage is made up of aspiring traders that either opened a trading account without proper education or with unrealistic expectations. The misconception that forex trading is just a quick way to get rich draws in traders, then they give up quickly when they realize that they may have unrealistic expectations. 

Statistic #2: 51.6% of traders prefer Android smartphones over iPhones

People across the world have been arguing over whether Android or iPhone is better for more than a decade. We’ve heard a lot of arguments supporting the iPhone for all of its unique features; however, iPhone users might be surprised to hear that Android not only sells more phones than Apple, but the smartphone brand is also preferred by forex traders by approximately 14.3%. 

Statistic #3: A Whopping 90% of successful forex traders claim to use expert advisors

An expert advisor is a trading robot that executes trades on behalf of the trader. There are a lot of different types of EAs out there that enter and exit trades based on different principles. Although there are highly profitable trading robot options out there, many traders can be apprehensive about using them because they may fail and also because many EAs cost at least a few hundred dollars, meaning that you’ll be out of a decent chunk of money if you invest in an unprofitable robot. This is why it’s surprising to hear that so many successful traders actually depend on these services. 

Statistic #4: 27% of forex traders are aged between 18 to 32 years old

When you picture a forex trader, your mind might think of someone in their forties or fifties, or maybe even older. However, forex traders are getting started at much younger ages these days. Another 28% of forex traders are between 35 to 44 years old, meaning that younger traders make up more than half of the total forex traders in the world.  

Statistic #5: More than $5 trillion is traded in the forex market each day

It’s surprising enough to hear that an almost unheard of amount of money passes through the forex market every single day, but did you know that forex trading has more money flow through it than the stock market? It can be harder to find exact figures, but price points seem to fall more in the range of billions when you’re looking at the stock market, which gives forex a substantial lead. 

Statistic #6: 41% of all forex transactions occur in the United Kingdom

The most popular currency pair is the United States Dollar, so you might be shocked to learn that almost half of all forex transactions actually occur in the United Kingdom. If you’re wondering how many transactions take place in the United States, the answer is only about 19%. 

Statistic #7: Only 7% of traders have 10 or more years of experience

If you’re feeling like you’re at a disadvantage because you have little experience trading forex, you might be surprised to hear that traders with 1-3 years of experience make up 39% of forex traders, while another 31% have less than one year’s worth of experience. 

Statistic #8: 40% of forex traders choose to trade because they want to be their own boss

The number one reason why people decide to trade comes down to being their own boss, with almost half of all traders claiming this to be their top motivation, even more so than simply making money. Of course, forex does offer a lot of perks that you can’t find with a regular job.

Statistic #9: More than 45% of traders don’t spend money on learning resources

When you become a trader, you can find a lot of resources online for free, but some may believe that the resources you pay for would offer better educational opportunities. This isn’t necessarily the case, as nearly half of all forex traders opted not to pay a cent for any learning resources in the past year. 

Statistic #10: Approximately 89.1% of forex traders are men

You might have assumed that the number of male traders outweighs the number of female traders, but it’s surprising to hear just how much larger that percentage is. Of course, this is a great incentive for aspiring female traders to get out there and even out those stereotypes. 

Categories
Forex Videos

How To Get An Edge In Forex Using Statistical Thinking – Trade Like A Forex Titan Part 6

Stats for Traders VI – Evidence-Based Trading

In our previous videos on stats for traders, we came to appreciate the power of the statistical methods to assess several aspects of the price action — ranges, volatility, swing-high, and swing-low lengths.


The use of the average and the standard deviation in combination with the statistical characteristics of the Normal Distribution


allows the knowledgeable trader to establish volatility evaluation, potential excursion lengths, profit targets, stop-loss optimization, and reward-to-risk ratios.

Also, not only can stats find valuable information about our trading system, but we can apply the same SQN formulas to market conditions.

TA Trading


When dealing with the decision about how to profit from the market, technical analysts learned to plan trades based on signals. Entries and exits based on rules. If X and Y conditions happen, then buy, with a stop below this bottom and a profit target at this level.” The rules decide, bar by bar, the estate of the trade. Traders using price action rely on short patterns, from one to four bars, aided by support/resistance levels to decide entry and exit points.

The Predictive Approach to Trading

A statistical model, on the other hand, uses predictive modeling, employing mathematically sophisticated algorithms to examine historically-derived indicators such as price, volatility, volume, trends, to identify repeatable patterns that show predictable potential. A predictable model could find relations between patterns and a forward-looking target variable.

This technique has multiple benefits


The patterns found won’t be evident to TA-based trading
The patterns discovered are not apparent to humans
It will include intricate patterns with a lot more statistical significance than a couple of bars
Predictive modeling is more friendly to advanced statistical analysis. If the logic is automated, highly sophisticated algorithms can be incorporated into the pattern-discovery process.

How does it work?
The predictive modeling also relies on patterns that repeat themselves. The model studies the historical market data and tries to discover repeatable and profitable patterns. Based on past observations, the model will be able to predict if the market could soon rise, drop, or stay quiet. In the case of a price movement, it attempts to find by how much.

Indicators and Targets
Predictive modeling usually does not work with raw market data. The raw data is transformed into two classes of new data: Indicators and targets. These new data sets are used to train the model.

Indicators

Indicators are data sets whose values describe only past information. When the system is operating in real-time, an indicator will be computable if there is sufficient historical data to satisfy its definition.
As an example, we could define an indicator called trend as the percent change of market price from close five bars ago to the present bar. If both prices are known, the “trend” indicator will have a value.

Targets

Targets are variables that only look at the future in time. It behaves as a regression model, which tries to predict a future point based on past points. Thus, targets manifest future price behavior of the market. For example, a variable called daily_return could be defined as the percent from the current open to the next day open. Using historical data, this variable could be computed for all but the last two bars.

The key concept
The key idea of predictive modeling is that indicators may exhibit information that can be applied to predict targets.
Key concept image
Example: Let’s consider two indicators: trend and volatility and one target: daily_return
If we provide the model with several years of data and ask it to learn how to predict good daily_return from trend and volatility, then we may use it in real-time to calculate from the current prices that trend =0.2240, volatility = 1.5890 and a model output of daily-return = 0.1650. Therefore, based on the current prediction, the market is likely to rise considerably (16.5%). Thus we should consider taking a long position.

From Predictions to Decisions
It seems logical to think that extreme predictions are more likely to occur than short ones. If the model predicts a 0.01 percent rise for tomorrow’s session, a rational person would be less likely to engage in a long trade than when the prediction is a 5 percent move up. This intuition is correct. Large predicted movements also have more likelihood to succeed than tiny projections.

The most common method to making trade decisions is to compare the predicted value to a fixed threshold, taking a long position only when the threshold is surpassed by the long threshold, and take a short position when the prediction is below the short threshold.
It seems evident that the magnitude of the threshold is a trade-off between the number of trades and the accuracy rate of the system. Thus by choosing the appropriate level of threshold, we can decide whether to have a system that trades often with lousy accuracy or a system with a few trades but highly accurate.

Takeaways
Takeaways

Of course, this methodology is only applicable through the use of algorithmic trading. It may be out of reach of the normal trader, but the lessons learned here can help us create a similar methodology using just the tools we have understood in previous videos.
Through the use of statistically based data such as Up_range, Down_range, stat-based intraday ranges, stops, and targets, applying signal-to-noise and SQN computations to the different markets. So now, we can make a consistent trading system that is backed by stats, and which is out of the radars of the market makers and institutional traders.


References: David Aronson, Timothy Masters – Statistically Sound Machin Learning for Algorithmic Trading of Financial instruments.

Categories
Forex Videos

How To Get An Edge In Forex Using Statistical Thinking – Trade Like A Forex Titan Part 5


Stats for Traders V – Assessing the Quality of the Forex Markets

In our previous video offering, we were presented with a way to assess the quality of a trading strategy or system. It was a modification of the T-

Test Called SQN. Essentially, the test is a measure of the signal-to-noise ratio of distribution. Being the mean of the distribution, m, the signal, and one-tenth of the standard deviation, the noise divisor. Therefore, the higher the SQN, the better the signal of the distribution. It means, also, its difference with a zero mean distribution (everything is noise) is larger.

Random Walks

Market prices, although not entirely normal-distributed, short-term, prices approach a Bell curve very much. The picture we see is the composite image of one thousand different games of a coin toss in which the player wins 1 dollar if heads and loses one dollar if tails.
The paths are the history of wins and losses over 500 coin tosses for each game.
We can see that, even it is counterintuitive, not all games end with zero gains. Some paths are luckier, whereas other paths suffer from bad luck.
The figure we see on the image is representative of what is called a diffusion process, with no drift. It is essentially saying it is a complete stochastic or random process with no trend involved.


A market depicting a potentially profitable component, usually a slightly positive trend would look like this. In this image we see that although there are some paths luckier than others, the average direction is positive, which is why the smoke cloud points slightly upwards.

Market prices can be described by a signal component mixed with noise, or random fluctuations.

Sometimes, the market shows a relatively high signal, whereas, on other occasions, it is just noise. To traders, it is essential to distinguish both market states, as it is impossible to profit long-term on a market with just noise.

SQN as a measure of the trading quality of a market

We can rank the markets offered by our forex brokers by their quality or signal to noise ratio, using SQN or a T-Test with less than 100 sample periods. We could apply this measure to our usual timeframes, using from 30 to 60 samples to obtain a quality map of our usual markets. Then we rank them by quality. This measure, together with the volatility stats and the rest of statistical information we already explained in previous videos, allows a savvy trader to choose the current best markets and discard the ones not showing adequate signal-to-noise characteristics.

Range Stats

Another interesting measurement that could help us assess potential reward to risk factors and also trim our targets properly is the intraday range measurements. We could set a 30-day, and also a 100-day and yearly stats, of what is normal market ranges percentwise for each asset in our basket. To do this measurement, we first mark the swing highs and lows and register the price differences. Then we apply the statistical measures to get the average and the SD values. A table could tell us what we could expect from the next move and set potential targets at the mean and also at the mean plus one SD.
We can also refine the information by splitting the table into swing high and swing low tables. That kind of information will give us valuable insight into the potential quality of the next trade, including the available range, its likely continuation, the possible reward-risk ratio, and the distance to targets.

Categories
Forex Daily Topic Forex Videos

How To Get An Edge In Forex Using Statistical Thinking – Trade Like A Forex Titan Part 4

Stats for Traders IV – Determine the quality of a trading system

To determine if something is good or just a product of randomness is not easy. The pharma industry spends years and costly double-blind studies to determine if a new chemical compound is better than a placebo (distilled water, or just a pill of sugar). This kind of evidence is needed because, as we have seen, almost nothing is sure in mother nature.

How to determine the goodness of data set


Taking the example of the pharma industry, to assess the properties of the new drug, scientists basically create two data sets. One dataset contains all the data measurements of the specimens taking the placebo and another dataset recording the same data of the specimens being administered the drug. So they end up with two groups, and, basically, they want to know if both groups belong to the same statistical distribution or from a different one. The statistical test to do this analysis is called the T-Test.

The T-Test

A T-test allows us to compare the average values of the two data sets and determine if they came from the same population. In the case of Pharma, the placebo group is the equivalent of a random sample with a zero mean, and scientists apply the T-Test to see if the average parameters of the group treated with the drug are similar or different from the placebo group. In the case of a trading system, we would like to know how far is the trading system away from a random trading system. The T-Test will answer not just the question of whether the system or strategy has the edge over a random pick, but it enables us to qualify and rank systems.

For a T-Test to be valid, we need to ensure several details! Scales of measurement must be standardized in both data sets. That means, the collection of the data should be standardized with one unit of trade, and preferably also using units of a standard Risk as a description of profits and losses.

The data collected is representative of the system. That means the data should be collected under all possible conditions the system will experience. The number of samples must be as large as feasible, and to comply with point 2 from a large historical database to account for every possible market situation: Bull, bear, sideways with low, mid and high volatility.
The standard deviation on both samples – random and strategy – should be similar. Making sure point 1 is guaranteed, point 4 is also insured.

The basic formula for when the size of both groups is equal:

t = (m1 — m2) / (σ / √N )

where m1 and m2 are the averages of the two groups and sigma σ is the standard deviation of the samples (assuming equal sigma on both)
if m2 is zero (random) the formula simplifies to:

Q = m / (σ / √N )
Where we have changed the t letter for Q, meaning quality, therefore knowing the average m and standard deviation sigma (σ) of a trading system, we can compute its quality Q.

We can look at m as the signal of our system

And σ / √N as the nose of the system.

Therefore, to maximize Q, we need to make m large and the denominator σ / √N as small as possible.

Qualifying trading systems.
From the Q equation, we can see that the denominator σ / √N is the ratio of the standard deviation and the square root of N, the number of trades. This makes it hard to compare systems with a different number of trades since it will make substantially better the same trade system as the number of samples grows.

SQN
Dr. Van K Tharp came with the idea of capping N the trade number to 100, even when the test is made with a large sample number. This way, we can compute m, the mean with all available data, but cut N to 100 to calculate the Q metric. That formula modification is called SQN, or System Quality Number.

SQN is
Q = m / (σ / √N ) when the sample size N is below 100 and
Q = m / (σ / 10 ) when the sample size N exceeds 100.

The SQN reveals if the system is worth trading. Systems below 1 are hard to trade because it presents a noise figure higher than the signal. That will create lots of doubts on a trader because, on multiple occasions, the system will underperform. An SQN of 1.5 is a very decent system, that can be traded with discipline. Systems beyond 2 are sound. If by chance, you end up with a system with SQN greater than 3, you’re a lucky fellow. Please call and share it with us.

The next release will explain how to make use of the SQN to assess the health of the markets.