Stats for Traders IV – Determine the quality of a trading system

To determine if something is good or just a product of randomness is not easy. The pharma industry spends years and costly double-blind studies to determine if a new chemical compound is better than a placebo (distilled water, or just a pill of sugar). This kind of evidence is needed because, as we have seen, almost nothing is sure in mother nature.
How to determine the goodness of data set
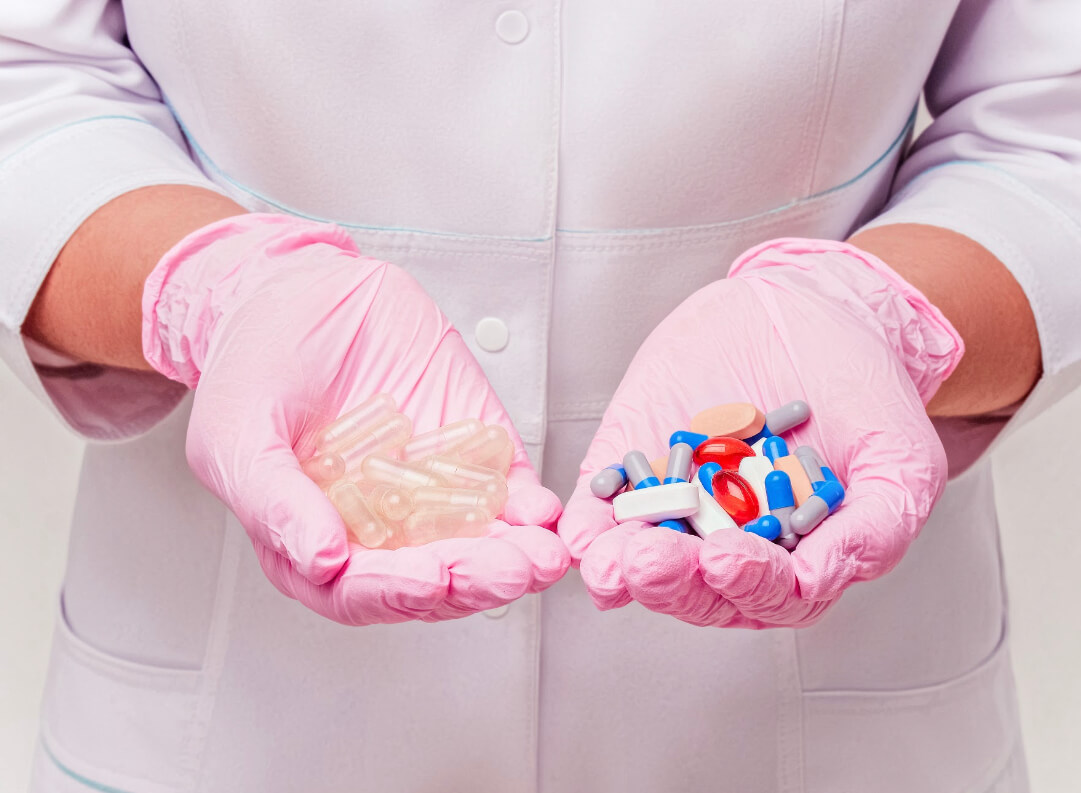
Taking the example of the pharma industry, to assess the properties of the new drug, scientists basically create two data sets. One dataset contains all the data measurements of the specimens taking the placebo and another dataset recording the same data of the specimens being administered the drug. So they end up with two groups, and, basically, they want to know if both groups belong to the same statistical distribution or from a different one. The statistical test to do this analysis is called the T-Test.
The T-Test
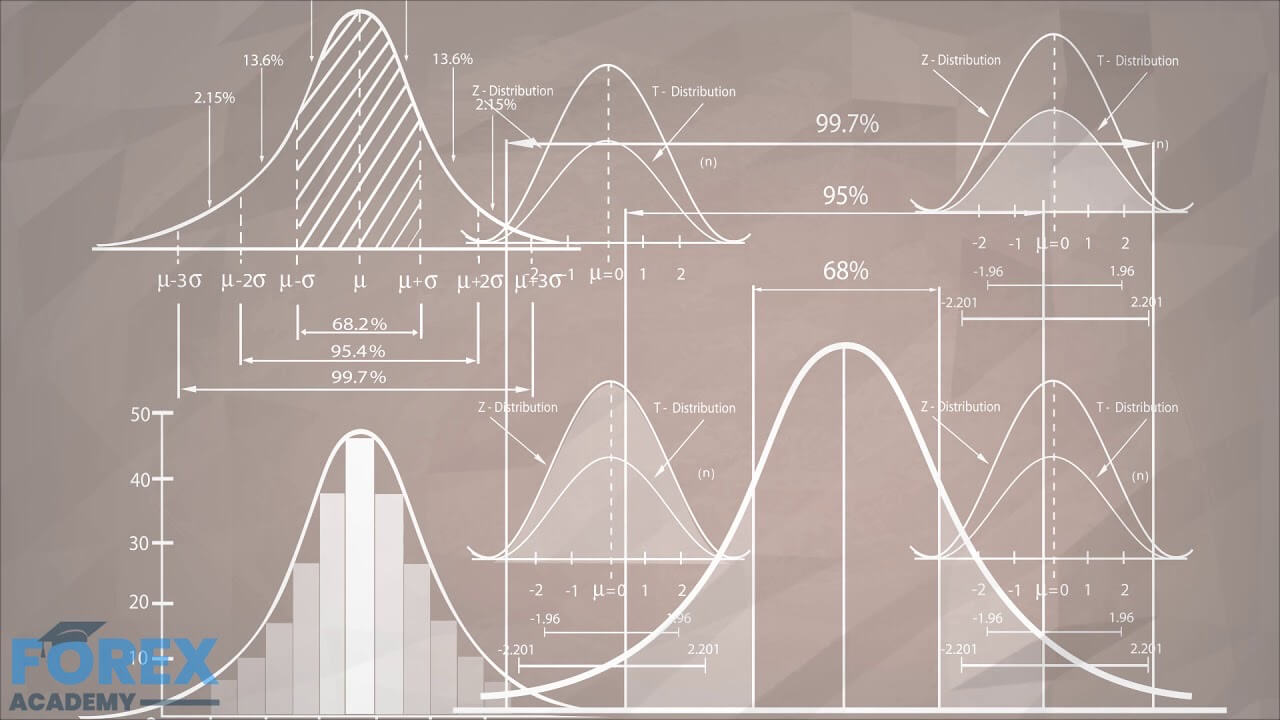
A T-test allows us to compare the average values of the two data sets and determine if they came from the same population. In the case of Pharma, the placebo group is the equivalent of a random sample with a zero mean, and scientists apply the T-Test to see if the average parameters of the group treated with the drug are similar or different from the placebo group. In the case of a trading system, we would like to know how far is the trading system away from a random trading system. The T-Test will answer not just the question of whether the system or strategy has the edge over a random pick, but it enables us to qualify and rank systems.
For a T-Test to be valid, we need to ensure several details! Scales of measurement must be standardized in both data sets. That means, the collection of the data should be standardized with one unit of trade, and preferably also using units of a standard Risk as a description of profits and losses.
The data collected is representative of the system. That means the data should be collected under all possible conditions the system will experience. The number of samples must be as large as feasible, and to comply with point 2 from a large historical database to account for every possible market situation: Bull, bear, sideways with low, mid and high volatility.
The standard deviation on both samples – random and strategy – should be similar. Making sure point 1 is guaranteed, point 4 is also insured.
The basic formula for when the size of both groups is equal:
t = (m1 — m2) / (σ / √N )
where m1 and m2 are the averages of the two groups and sigma σ is the standard deviation of the samples (assuming equal sigma on both)
if m2 is zero (random) the formula simplifies to:
Q = m / (σ / √N )
Where we have changed the t letter for Q, meaning quality, therefore knowing the average m and standard deviation sigma (σ) of a trading system, we can compute its quality Q.

We can look at m as the signal of our system

And σ / √N as the nose of the system.
Therefore, to maximize Q, we need to make m large and the denominator σ / √N as small as possible.
Qualifying trading systems.
From the Q equation, we can see that the denominator σ / √N is the ratio of the standard deviation and the square root of N, the number of trades. This makes it hard to compare systems with a different number of trades since it will make substantially better the same trade system as the number of samples grows.

SQN
Dr. Van K Tharp came with the idea of capping N the trade number to 100, even when the test is made with a large sample number. This way, we can compute m, the mean with all available data, but cut N to 100 to calculate the Q metric. That formula modification is called SQN, or System Quality Number.
SQN is
Q = m / (σ / √N ) when the sample size N is below 100 and
Q = m / (σ / 10 ) when the sample size N exceeds 100.
The SQN reveals if the system is worth trading. Systems below 1 are hard to trade because it presents a noise figure higher than the signal. That will create lots of doubts on a trader because, on multiple occasions, the system will underperform. An SQN of 1.5 is a very decent system, that can be traded with discipline. Systems beyond 2 are sound. If by chance, you end up with a system with SQN greater than 3, you’re a lucky fellow. Please call and share it with us.
The next release will explain how to make use of the SQN to assess the health of the markets.