Stats for Traders VI – Evidence-Based Trading
In our previous videos on stats for traders, we came to appreciate the power of the statistical methods to assess several aspects of the price action — ranges, volatility, swing-high, and swing-low lengths.
The use of the average and the standard deviation in combination with the statistical characteristics of the Normal Distribution
allows the knowledgeable trader to establish volatility evaluation, potential excursion lengths, profit targets, stop-loss optimization, and reward-to-risk ratios.
Also, not only can stats find valuable information about our trading system, but we can apply the same SQN formulas to market conditions.
TA Trading
When dealing with the decision about how to profit from the market, technical analysts learned to plan trades based on signals. Entries and exits based on rules. If X and Y conditions happen, then buy, with a stop below this bottom and a profit target at this level.” The rules decide, bar by bar, the estate of the trade. Traders using price action rely on short patterns, from one to four bars, aided by support/resistance levels to decide entry and exit points.
The Predictive Approach to Trading

A statistical model, on the other hand, uses predictive modeling, employing mathematically sophisticated algorithms to examine historically-derived indicators such as price, volatility, volume, trends, to identify repeatable patterns that show predictable potential. A predictable model could find relations between patterns and a forward-looking target variable.
This technique has multiple benefits
The patterns found won’t be evident to TA-based trading
The patterns discovered are not apparent to humans
It will include intricate patterns with a lot more statistical significance than a couple of bars
Predictive modeling is more friendly to advanced statistical analysis. If the logic is automated, highly sophisticated algorithms can be incorporated into the pattern-discovery process.
How does it work?
The predictive modeling also relies on patterns that repeat themselves. The model studies the historical market data and tries to discover repeatable and profitable patterns. Based on past observations, the model will be able to predict if the market could soon rise, drop, or stay quiet. In the case of a price movement, it attempts to find by how much.
Indicators and Targets
Predictive modeling usually does not work with raw market data. The raw data is transformed into two classes of new data: Indicators and targets. These new data sets are used to train the model.
Indicators
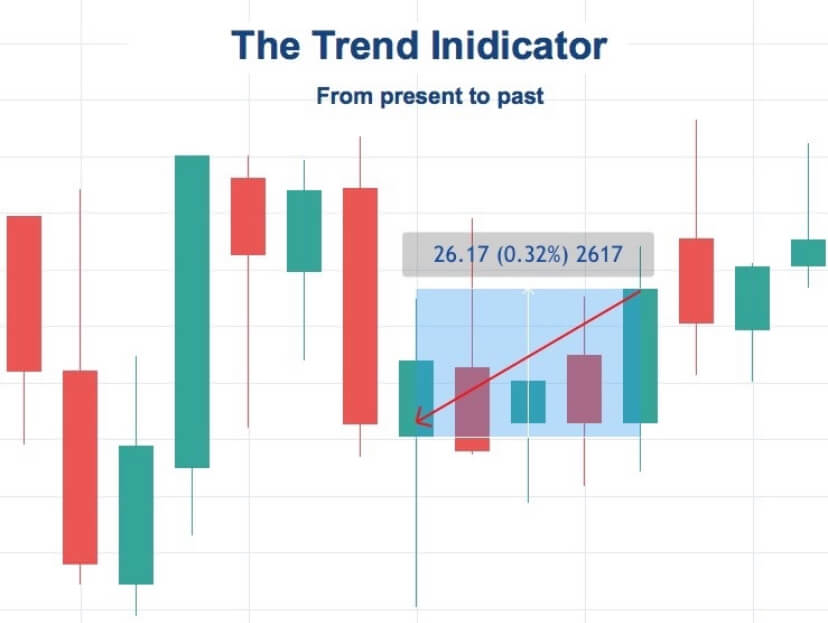
Indicators are data sets whose values describe only past information. When the system is operating in real-time, an indicator will be computable if there is sufficient historical data to satisfy its definition.
As an example, we could define an indicator called trend as the percent change of market price from close five bars ago to the present bar. If both prices are known, the “trend” indicator will have a value.
Targets
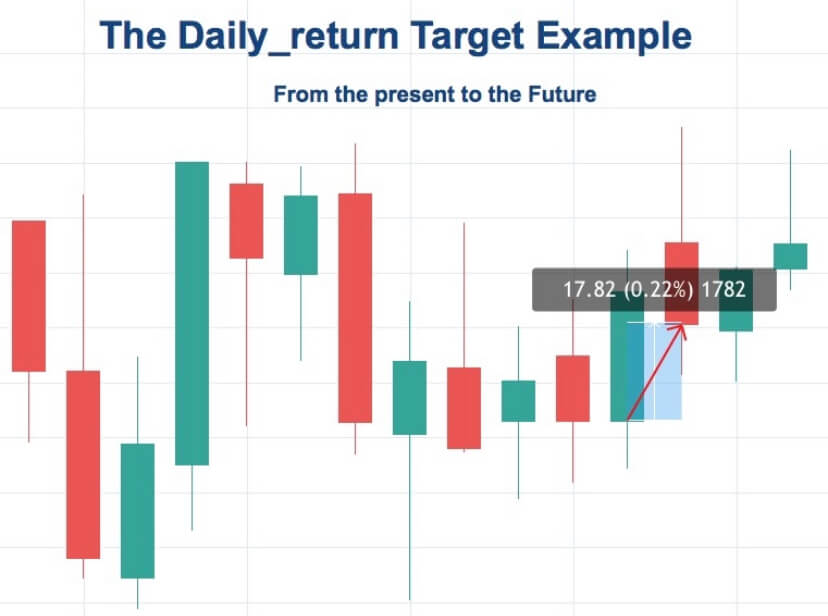
Targets are variables that only look at the future in time. It behaves as a regression model, which tries to predict a future point based on past points. Thus, targets manifest future price behavior of the market. For example, a variable called daily_return could be defined as the percent from the current open to the next day open. Using historical data, this variable could be computed for all but the last two bars.
The key concept
The key idea of predictive modeling is that indicators may exhibit information that can be applied to predict targets.
Key concept image
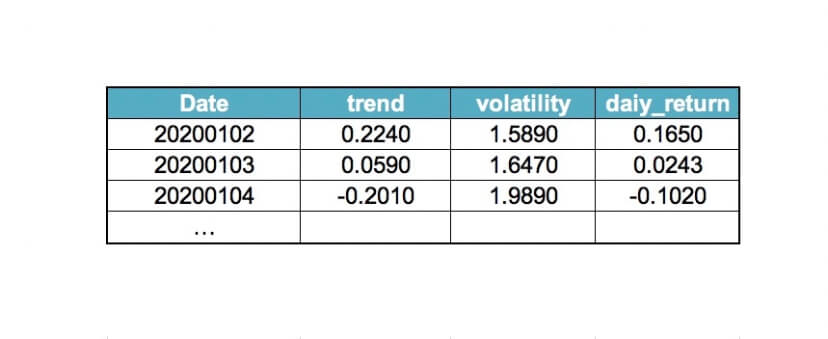
Example: Let’s consider two indicators: trend and volatility and one target: daily_return
If we provide the model with several years of data and ask it to learn how to predict good daily_return from trend and volatility, then we may use it in real-time to calculate from the current prices that trend =0.2240, volatility = 1.5890 and a model output of daily-return = 0.1650. Therefore, based on the current prediction, the market is likely to rise considerably (16.5%). Thus we should consider taking a long position.
From Predictions to Decisions
It seems logical to think that extreme predictions are more likely to occur than short ones. If the model predicts a 0.01 percent rise for tomorrow’s session, a rational person would be less likely to engage in a long trade than when the prediction is a 5 percent move up. This intuition is correct. Large predicted movements also have more likelihood to succeed than tiny projections.
The most common method to making trade decisions is to compare the predicted value to a fixed threshold, taking a long position only when the threshold is surpassed by the long threshold, and take a short position when the prediction is below the short threshold.
It seems evident that the magnitude of the threshold is a trade-off between the number of trades and the accuracy rate of the system. Thus by choosing the appropriate level of threshold, we can decide whether to have a system that trades often with lousy accuracy or a system with a few trades but highly accurate.
Takeaways
Takeaways
Of course, this methodology is only applicable through the use of algorithmic trading. It may be out of reach of the normal trader, but the lessons learned here can help us create a similar methodology using just the tools we have understood in previous videos.
Through the use of statistically based data such as Up_range, Down_range, stat-based intraday ranges, stops, and targets, applying signal-to-noise and SQN computations to the different markets. So now, we can make a consistent trading system that is backed by stats, and which is out of the radars of the market makers and institutional traders.
—
References: David Aronson, Timothy Masters – Statistically Sound Machin Learning for Algorithmic Trading of Financial instruments.