In today’s lesson, we are going to demonstrate an example of a double top that drives the price towards the downside in an intraday chart. The double top/double bottom usually makes the price bearish if they are formed in a major chart. However, they work in the same way in minor charts as well. Let us find out how it drives the price in an H1 chart. Let us get started.

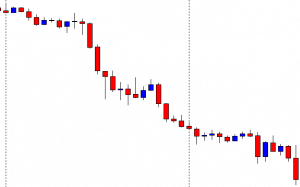
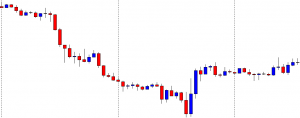
It is an H1 chart. The chart shows that the price makes a long bearish move. The chart belongs to the sellers. The sellers may wait for the price to make a bullish correction and produce a bearish reversal candle at flipped resistance to go short in the pair.
The chart makes a strong bullish move instead, upon producing a bullish engulfing candle. The last candle comes out as a bullish engulfing candle after consolidation. It seems that the buyers are dominating the minor charts.
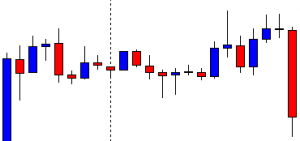
The price does not continue its bullish move. It has been in long consolidation. The price is roaming around the level of resistance, where it has had a bounce. A bullish breakout may attract the buyers to go long in the pair. On the other hand, a bearish reversal candle at a double top resistance may make the sellers wait to go short in the pair below the neckline.
The chart produces a long bearish candle closing below the neckline. It suggests that the Bear may dominate in the pair. The sellers are to wait for the price to consolidate and produce a bearish reversal candle to go short in the pair. Let us find out what happens.
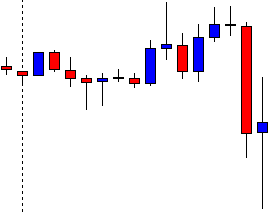
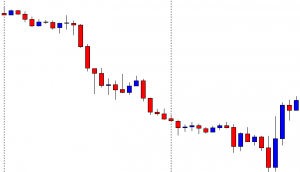
The next candle comes out as a spinning top closing within the breakout level. It seems that the pair is getting ready to get bearish. The sellers are to keep their close eyes in the pair to get a bearish reversal candle and a breakout at the lowest low to trigger a short entry.
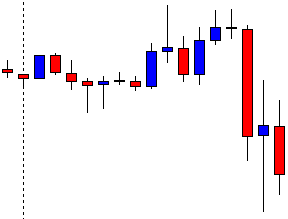
Here it comes. The pair produces a bearish engulfing candle. The candle’s body engulfs the last candle’s body. However, the sellers may wait for the price to make a breakout at the lowest low of the last candle (wick’s lowest low). It is very important as far as intraday trading is concerned.
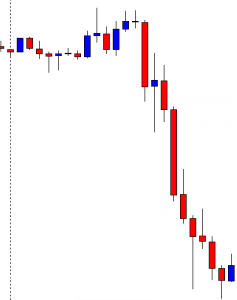
The price breaches the wick’s lowest low and heads towards the South with good bearish momentum. It travels a long way by offering 1:2 risk-reward. It’s a good thing about intraday trading that it offers good risk-reward.
We have demonstrated an example of a double top driving the price towards the downside in the H1 chart. They work in any time frame from 1M to 1Month. However, it is better not to use it in too minor time frames such as the 1M, 5M, 15M.