Moving Average (MA) is the most widely used indicator which has long been used by the traders in the financial markets. It is a trend detecting indicator. Since detecting trends is one of the most important key components of trading, visual representation of a trend by Moving Average makes it be a favorite indicator among the financial traders.

There are multiple Moving Average strategies used by traders. In this lesson, we are going to learn a strategy called “Three SMAs”. It is a strategy with three Simple Moving Averages; these are Simple Moving Average 200, Simple Moving Average 100 and Simple Moving Average 50.
Let us now have a look at how a chart looks like with “Three SMAs”.
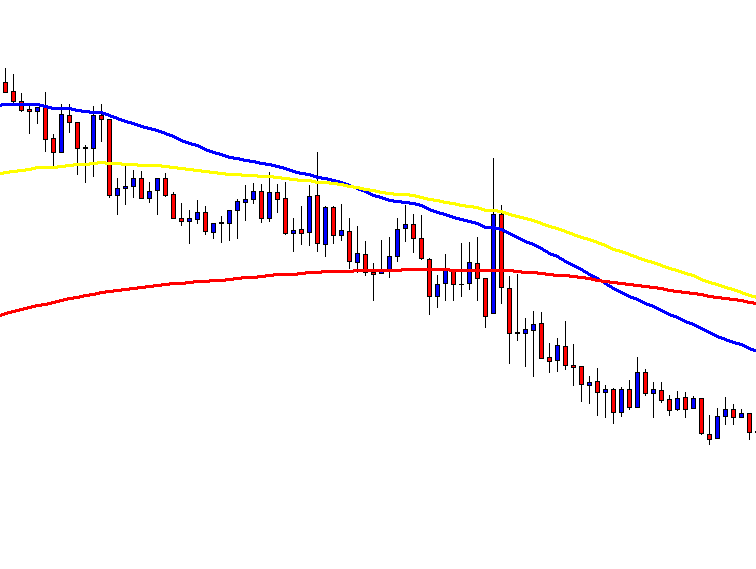
This is how the charts look like most of the time. The red one is 200-period Simple Moving Average, the yellow one is the 100-period SMA and the blue one is 50-period SMA. It is better to use different colors so that we can identify them easily.
In the chart above, we see that the price gets caught in between those Moving Averages to start with. The price comes further down, but the 50-SMA stays between the100-SMA and the 200-SMA. What does “Three SMAs” suggest to us here? It suggests that the price does not have a solid trend.
In the naked eyes, the price action suggests that the asset is down-trending. However, by having “Three SMAs”, we can identify solid down-trend has not been established yet. This is why many price action traders use “Three SMA’s” to be sanguine about the trend. Ideally, this is not a chart that we should look for entries.
The question is how a trading chart should look like with “Three SMAs” to look for entries. Let us have a look at the chart below.
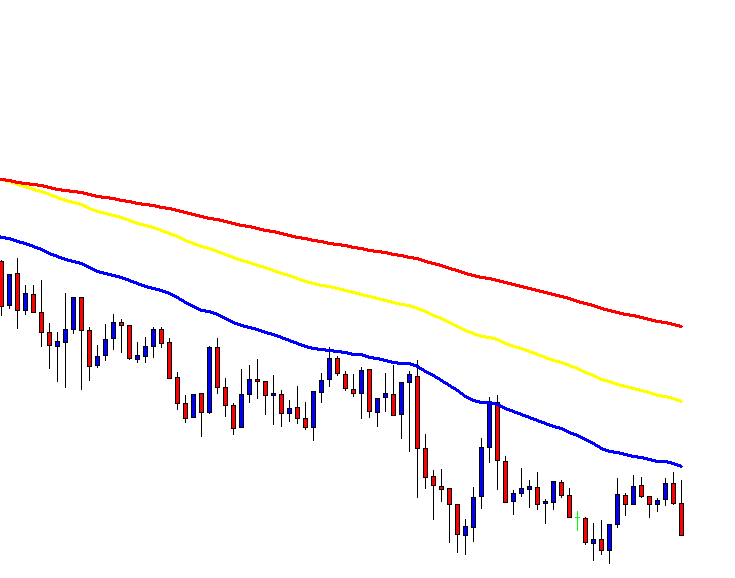
The difference is very evident here. See how they have been lined up. Moving Average 200 stays on the top; Moving Average 100 stays in between; Moving Average 50 stays at the bottom. This is an ideal chart with “Three SAM’s” to look for short entries.
In the case of price is up-trending, this is how it looks like.
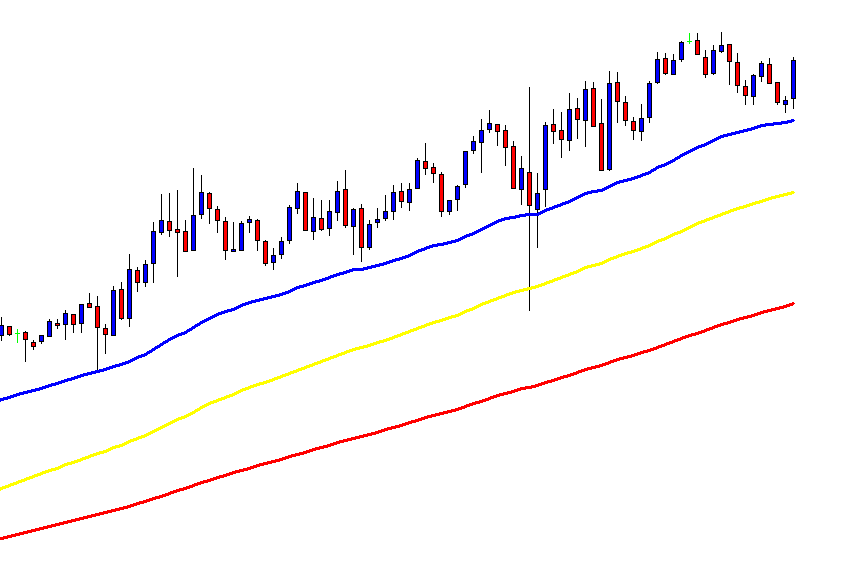
In a buying market, they are to be lined up just another way round than the selling market. Look at the chart above. The Moving Average 200 stays at the bottom, Moving Average 100 stays in between and Moving Average 50 stays at the top. In this chart, we shall look for long entries.
“Three SMAs” indicators work wonderfully well with intraday trading. In this lesson, we have used a 15-minute chart and three SMAs with periods of 50,100 and 200. If we want to use other charts such as H1 or H4, we have to change the values. However, the best combination for “Three SMAs” is Moving Averages of 50,100 and 200 on the 15M chart.
We now understand how “Three SMA’s” may help us understand the trend. Thus, “Three SMA’s” may be integrated with any other strategies for taking entries. Moreover, only “Three SMAs” itself offers us entries as well. In our next article, we will demonstrate how entries are to be taken based on “Three SMAs”. Stay tuned.