In today’s lesson, we are going to demonstrate an intraday chart that ends up offering an entry. Intraday trading can be prolific if it is done in the right way. In today’s example, the price heads towards the North by making a good bullish move. It seems that the bull is in control. However, the price gets bearish later and ends up offering entry to the sellers. Let us find out how that happens.
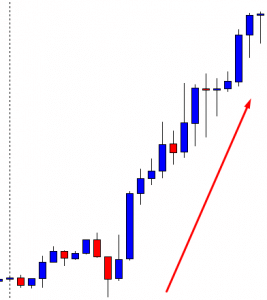
It is an H1 chart. The chart shows that the price makes a good bullish move. The last candle comes out as a hanging man. The price does not make any bearish correction, so the daily candle closes without having an upper shadow. It suggests that the bull may dominate in the pair the next day.
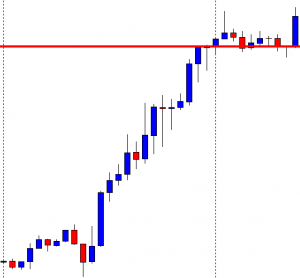
The next day, the price makes a bullish breakout at the last day’s highest high. The pair is trading above the level. Ideally, the price above the last day’s highest high means the bull is in control. However, in this chart, the price does not make any bearish correction before making the breakout. Thus, the buyers are to wait for the price to consolidate and produce a bullish reversal candle to go long in the pair.
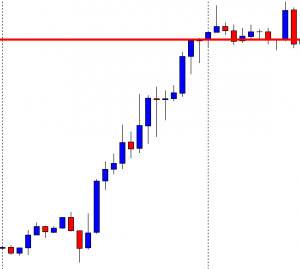
The next candle comes out as a bearish engulfing candle. The candle closes below the breakout level. If the level works as a level of resistance, the sellers may come into play and go short in the pair. Let us find out what happens next.
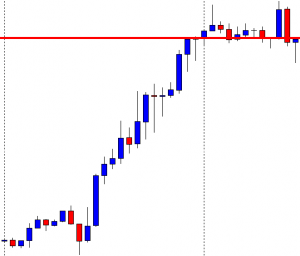
The next candle comes out as a hammer closing within the breakout level. It looks good for the sellers. The sellers may wait for the price to produce a bearish reversal candle and go short below the hammer’s lowest low.
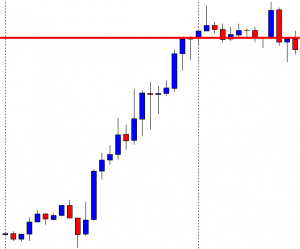
The chart produces a bearish engulfing candle closing below the hammer’s body. The sellers may trigger a short entry below the hammer’s lower shadow. The last day’s lowest low offers the price to travel towards the North with a good reward.
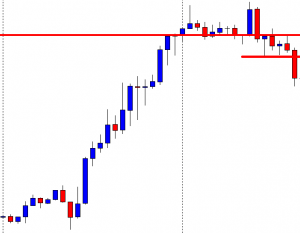
One of the candles comes out as a bearish Marubozu candle closing well below the hammer’s lowest low. The entry may be triggered earlier just by using price breakout. Some traders may wait for a 15M breakout to trigger the entry, and some even wait for an H1 breakout. Ideally, a 15M breakout is good enough to trigger such entry. Traders may set their stop loss above the breakout level since it is the new resistance and Take profit with 2R. If they set the stop loss above the trend’s highest high, they may set take profit at the previous day’s lowest low. Let us find out how the entry goes.
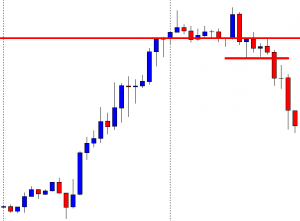
The price heads towards the South with good bearish momentum. It hits 2R in a hurry. The way it has been going, it may hit the previous day’s lowest low soon as well.
To do intraday trading, pay attention to the last day’s highest high and lowest low, breakout, breakout confirmation, and reversal candle. Do some backtesting and then try live trading with a tiny lot at the beginning. Once you have mastered this, it can make your hand full.


