
In today’s lesson, we are going to demonstrate an example of the daily-H4 chart combination trading. The H4 chart offers a long entry. The chart’s breakout and level of support are to be spotted with some calculation. We try to learn those from today’s lesson.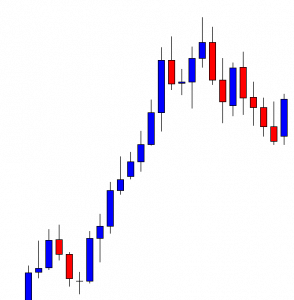
This is the daily chart. The chart shows that the price makes a very strong bullish move. It then makes a bearish correction. At the correction, it produces a bullish engulfing candle once but continues its journey towards the South. The daily-H4 chart combination traders may have flipped over to the H4 chart upon having that bullish engulfing candle. Anyway, look at the last candle. It is a strong bullish reversal candle. The buyers may flip over to the H4 chart to go long in the pair.
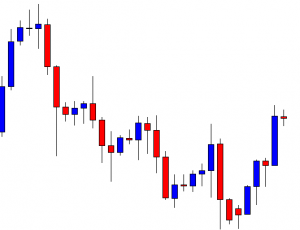
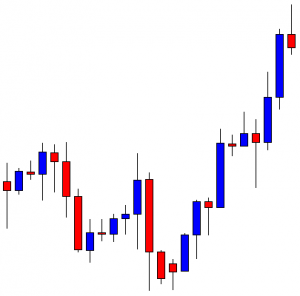
This is how the H4 chart looks. The last candle comes out as a doji candle. The buyers are to wait for the price to consolidate and produce a bullish candle to trigger a long entry.
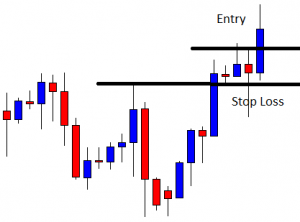
The chart shows that the price consolidates and produces a bullish engulfing candle. Let’s focus on those two drawn levels. We may not count the lower spike of that spinning top to draw the support line. We try to draw the line by using a flipped level that holds some candle’s wicks and bodies of all the candles. To draw the level of resistance, we count the spike of the spinning top (the last rejection) but skip some part of the upper shadow of a candle. Yes, it is not a bad idea to draw a breakout level by using spikes to some extent. In most cases, however, significant rejection, along with candles’ bodies, matters a lot. Let us assume that we trigger a long entry in this chart.
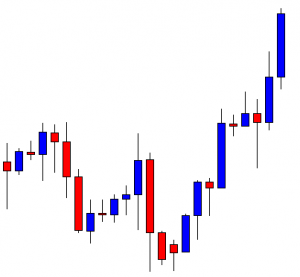
The price heads towards the North with good bullish momentum. The last candle does not hit the target of 1R, but the price is almost there. It seems that the buyers may not have to wait too long to achieve their target.
The last candle comes out as a bearish candle with a long upper shadow (the body is relatively thicker though). However, the upper shadow shows that the price hits the target. However, it is a bearish reversal candle because the body closes within the last bullish candle, suggesting that the price may continue its bullish move.
If we look back and study with the flipped H4 chart, we find that the buyers are to count some factors to draw consolidation support and resistance. They are to count some spikes and to skip some of those. As we know, trading is not science; it is an art. Thus, traders are to be artists. To be an artist (successful trader), one needs a lot of practice and experience.