The global macro analysis of the AUD/JPY pair focuses on endogenous factors that impact GDP growth in Australia and Japan. We’ll also analyze exogenous factors that determine the exchange rate fluctuation of the AUD/JPY pair.
Ranking Scale
We will rank these factors on a scale from -10 to +10 depending on the severity of their impact.
To determine the rank for endogenous factors, we will conduct a correlation analysis with the GDP growth rate. If the ranking is positive, the endogenous factors have led to an increase in either the AUD or JPY. If the ranking is negative, they have resulted in domestic currencies shedding some of their value.
For exogenous factors, ranking is derived from correlation analysis with the exchange rate of AUD/JPY. If the ranking is negative, the exogenous factor has resulted in a bearish trend for the pair. Conversely, a positive ranking implies the factor resulted in a bullish trend.
AUD Endogenous Analysis
- Australia Unemployed Persons
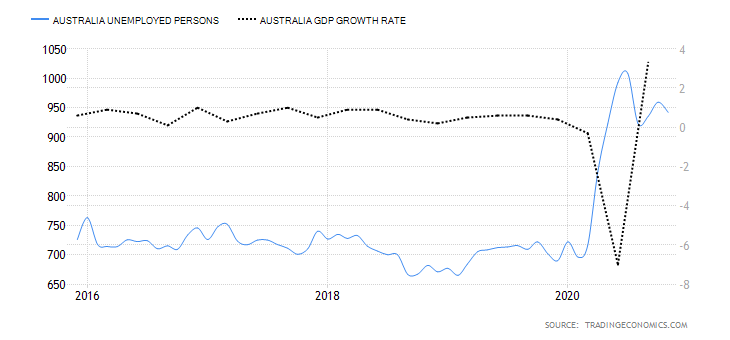
As an economic indicator, unemployed persons show the number of the working-age population actively looking for employment. This number is used to show the health of the labor market. It also estimates how well the economy is performing; an expanding economy creates more job opportunities, hence decreasing the number of unemployed persons. Conversely, a deteriorating economy results in job losses, increasing the number of unemployed persons.
In November 2020, the number of unemployed persons in Australia dropped to 942,100 from 959,400 in October. This number is still higher than the historic average of 639,530 and higher than 722,060 recorded in January. It has a score of -6.
- Australia Producer Prices Change
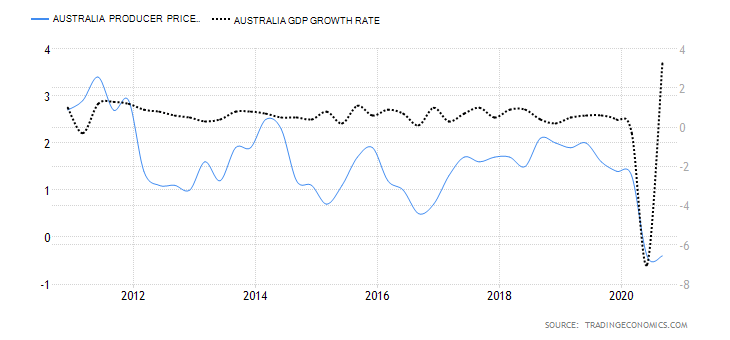
This indicator measures the changes in the price of goods that manufacturers sell directly to wholesalers over a particular period. It is a leading indicator of overall inflation since the prices of goods and services from the manufacturers will be passed to the final consumer. Typically, an increase in demand in the market leads to higher prices while a drop in aggregate demand results in lower prices. Thus, changes in producer prices correspond to changes in GDP.
In the third quarter of 2020, the YoY Australia producer price changes dropped by 0.4% same as Q2. In Q1, the index was higher by 1.3%. Thus, we assign a score of -4.
- Australia Capacity Utilisation
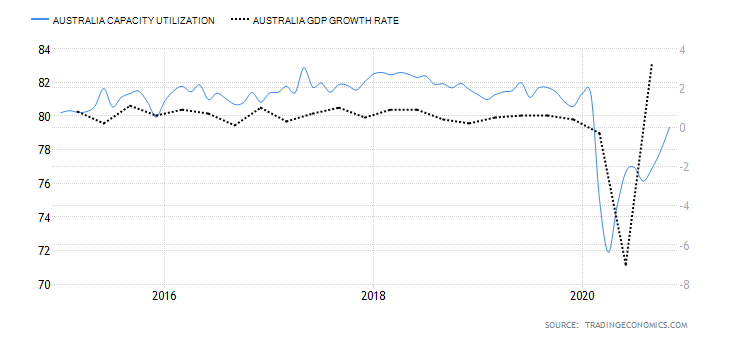
Capacity utilization measures the degree to which a country’s manufacturing and production capabilities are being put to use. It shows the total output being produced vs the maximum potential output produced using the same resources. In Australia, capacity utilization includes companies operating in the industrial sector; which include manufacturing, mining, and utility firms. It is a leading indicator of overall economic growth.
In November 2020, Australian capacity utilization rose to 79.32% from 77.93% in October. This shows that the industrial sector is expanding from the lows of the pandemic. However, the current utilization is still below 81.34% recorded in January. It has a score of -5.
- Australia Household Saving Ratio
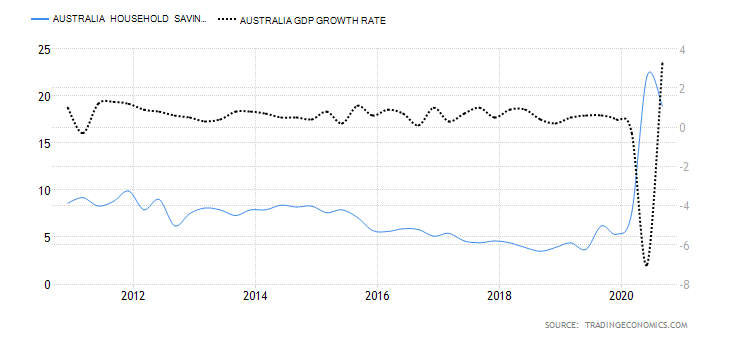
This represents the portion of the disposable income that households do not use to purchase goods and services and transfer payments. Typically, what is not consumed is considered savings. Therefore, when the household saving ratio increases, Australian households are spending less on domestic consumption. Since GDP heavily relies on domestic expenditure, an increase in household savings ratio is a leading indicator of economic contraction.
In the third quarter of 2020, Australia’s household saving ratio dropped to 18.9% from historic highs of 22.1% in Q2. Q3 reading is the fourth-highest since 1960. It has a score of -7.
- Australia House Price Index
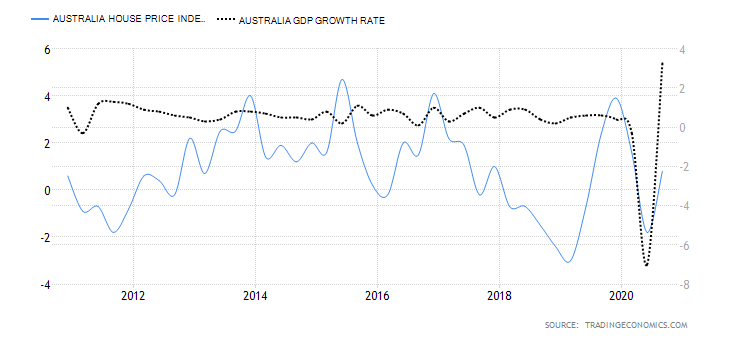
In Australia, the HPI measures the quarterly change in the price of residential property in eight cities. Canberra, Sydney, Brisbane, Hobart, Melbourne, Perth, Adelaide, and Darwin. When the HPI increases, it shows that demand in the real estate market is growing, which corresponds to economic expansion.
In the third quarter of 2020, HPI in Australia increased by 0.8% from a drop of 1.8% in Q2. The Q3 increase is attributed to the easing of COVID-19 restrictions that stifled the economy in Q2. It has a score of 2.
- Australia Fiscal Expenditure
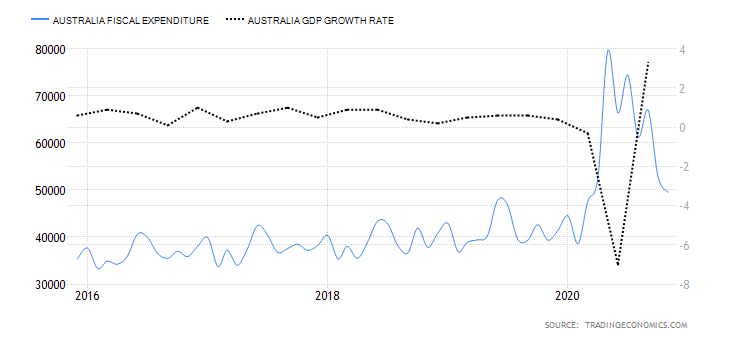
This includes the totality of government expenditure on the purchase of goods and services, transfer payments in social security, and investments. It is used in the computation of the total government budget value. Fiscal policy is used to stimulate economic growth. Usually, in times of economic crises, the government increases its fiscal expenditure – mostly on transfer payments. This is meant to cushion households from adverse economic conditions. More so, it increases domestic demand which spurs economic growth.
In November 2020, Australia’s fiscal expenditure dropped to 49.504 billion AUD from 50.801 billion AUD in October. In May, Australia’s fiscal expenditure hit historic highs of 79.545 billion AUD. It has a score of 5.
- Australia Bankruptcies
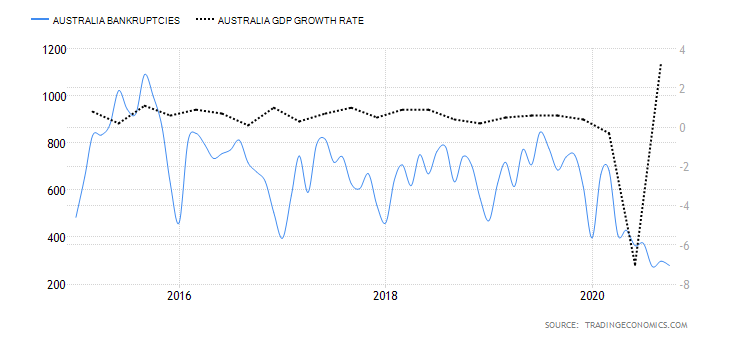
This shows the number of companies operating in Australia unable to continue with their operations due to the inability to repay their debts. It corresponds to changes in economic conditions and demand for goods and services by households.
In October 2020, the number of companies that declared bankruptcy in Australia dropped to 279 from 298 in September. There has been a steady decline in Australian bankruptcies since March when it reached yearly highs of 683. It has a score of 3.
Conclusion
| Indicator | Score | Total | State | Comment |
| Australia Unemployed Persons | -6 | 10 | 942100 in November 2020 | Above the historic average of 696530. The increase in unemployed persons in 2020 is attributed to economic shocks of COVID-19 |
| Australia Producer Prices Change | -4 | 10 | Dropped by 0.4% in Q3 2020 | The PPI has dropped in 2020 primarily because of the depressed domestic demand |
| Australia Capacity Utilisation | -5 | 10 | 79.32% in November 2020 | The industrial sector in Australia is resuming full operations from the pandemic lockdown. The capacity utilisation is still below pre-pandemic levels |
| Australia Household Saving Ratio | -7 | 10 | 18.9% in Q3 2020 | Q2 reading was the highest in Australian history. Q3 ratio is the fourth highest. This shows that domestic demand was depressed in 2020 |
| Australia House Price Index | 2 | 10 | Increased by 0.8% in Q3 2020 | An improvement from a drop of 1.8% in Q2. Demand in real estate is picking up after easing of COVID-19 restrictions |
| Australia Fiscal Expenditure | 5 | 10 | 49.504 billion AUD in November 2020 | 2020 was characterised by the unprecedented increase in fiscal expenditure as the government attempted to avert an irreversible recession |
| Australia Bankruptcies | 3 | 10 | 279 companies in October 2020 | A steady decline in the number of bankruptcy filings since May |
| TOTAL SCORE | -12 |
JPY Endogenous Analysis
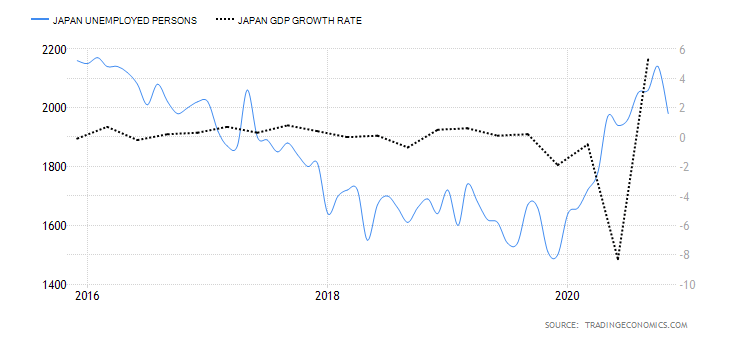
- Japan Unemployed Persons
This indicator shows the Japanese labour market’s state by analysing the changes in the number of people who are actively seeking employment. It shows the rate at which the domestic economy is creating and shedding jobs. When the number of unemployed increases, it means that the economy is losing more jobs than creating, showing that the economy is contracting; and vice versa.
In November 2020, the number of unemployed persons in Japan dropped to 1.98 million from 2.14 million in October. Since January, it has increased by 340,000 is higher than the historic average of 1.67 million. It has a score of -7.
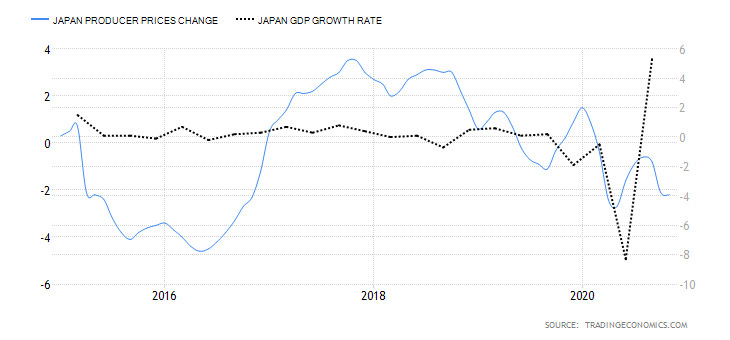
- Japan Producer Prices Change
The producer price change measures the YoY change in the prices of goods and services sold to the wholesalers directly from the producers. The index covers all sectors in the Japanese economy. Hence it is a leading indicator of the overall inflation in the economy.
In November 2020, the YoY Japan producer price change dropped by 2.2% down from the 2.1% drop recorded in October. The November drop is attributed to petroleum & coal products. The historic average for the japan producer price change is 1.36%. It has a score of -3.
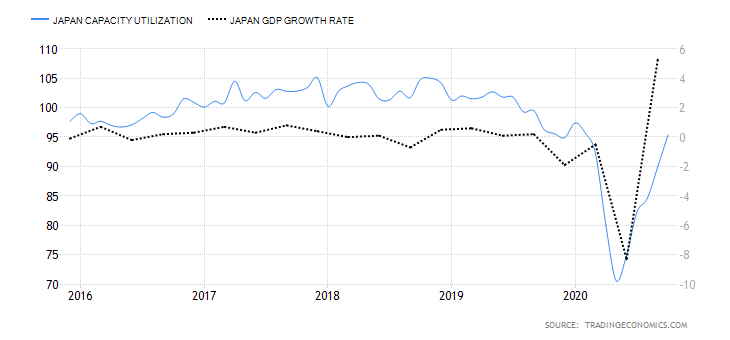
- Japan Capacity Utilization
Japan’s economy is heavily dependent on industrial activity. Capacity utilisation shows the percentage of actual output from the industrial sector compared to the maximum capacity. Note that this indicator only measures the relative capacity utilisation based on a benchmark year. When it increases, the industrial sector is expanding with the available resources being put to the most use possible.
In October 2020, Japan industrial capacity utilisation increased to 95.4% from 90% in September. This is the highest recorded since March. Throughout the year, the capacity utilisation in Japan has been below the historic average of 110.32 points. It has a score of -2.
- Japan Workers’ Households Ratio of Net Savings and Insurance
This measures the amount of income that households in Japan save in relation to their total disposable income. When the ratio increases, Japanese households are postponing consumption. This is interpreted as expectations that future economic conditions might worsen; hence, households save for a rainy day. In such a case, domestic demand for goods and services is depressed, which means that the GDP drops. Conversely, when the savings ratio decreases, expenditure increases; hence, rise in the GDP.
In October 2020, household saving rate in Japan rose to 29.7% from 19% in September. Due to the economic uncertainties of COVID-19, June 2020 recorded the highest ever personal saving ratio in Japan of 62.1% it has a score of -5.
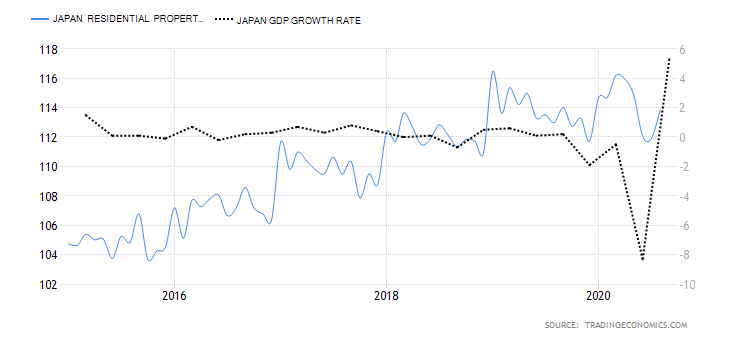
- Japan Residential Property Price Index
This tracks the price changes in the Japanese real estate market for residential property, including condominium, land, and detached houses. Note that price in real estate corresponds to changes in the demand. Thus, when demand is high, the residential property index increases, and drops when demand is low.
In August 2020, the Housing Index in Japan was 113.86 points up from 111.9 points in July. The August index is higher than the historic average of 104.99 points but lower than January’s 114.66 points. It has a score of -1.
- Japan Government Spending
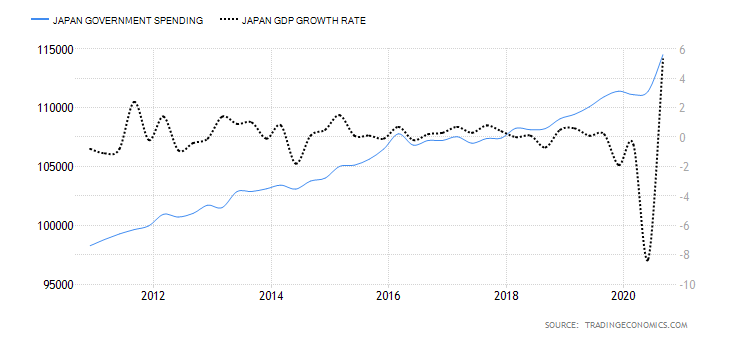
Japan government spending shows the amount of money that the Japanese government uses to purchase national goods and services, repayment of government debt, and transfer payments. Whenever the government intends on influencing economic growth, it adjusts the government spending as part of its fiscal policy measure. This involves adjusting budgetary targets, levels of taxes, and expenditure plans. During the coronavirus pandemic, for example, the government increased its national spending, especially in transfer payments. That was meant to shield households from the economic shocks and to stimulate economic growth.
In the third quarter of 2020, Japan government spending rose to 114.509 trillion JPY from 114.404 trillion JPY in Q2. This is the highest government spending in the history of Japan. It has a score of 4.
- Japan Bankruptcies
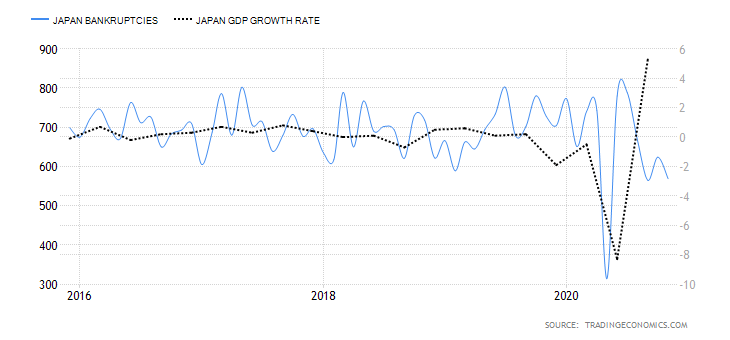
Bankruptcies show the monthly change in the number of Japanese businesses unable to service their debt obligations and thus forced to cease operations. As an indicator of the domestic economy, bankruptcies show how well the economy supports businesses in terms of creating and shedding jobs. Naturally, when bankruptcies increase, it correlates with increases in job losses and contraction of the economy.
In November 2020, the number of bankruptcies in Japan was 569 down from 624 in October. It has a score of 1.
Conclusion
| Indicator | Score | Total | State | Comment |
| Japan Unemployed Persons | -7 | 10 | 1.98 million in November 2020 | Above the historic average of 1.68 million. The Japanese labour market has lost about 340,000 jobs since January |
| Japan Producer Prices Change | -3 | 10 | Down by 2.2% in November 2020 | The decrease in PPI mainly attributed to a drop in the price of petroleum and coal products |
| Japan Capacity Utilisation | -2 | 10 | 95.4% in October | The highest recorded since March. The economy is gradually returning to full operations |
| Japan Household Saving Ratio | -5 | 10 | 29.7% in October 2020 | The ratio is dropping from historic highs of 62.1% in June. Shows domestic demand is picking up |
| Japan House Price Index | -1 | 10 | 113.86 points in August 2020 | The HPI is higher than the historic average of 104.99 points; but lower than pre-pandemic levels |
| Japan Fiscal Expenditure | 4 | 10 | 114.509 billion JPY in Q3 2020 | The highest in Japan’s history |
| Japan Bankruptcies | 1 | 10 | 569 companies in November 2020 | Bankruptcy filings drop as COVID-19 restrictions ease |
| TOTAL SCORE | -13 |
AUD/JPY Exogenous Analysis
- Australia and Japan Terms of Trade Differential
A country’s TOT shows the ratio between the value of exports and the value of its imports. It represents the units of exports that can purchase a unit of imports. Therefore, when a country has a current account deficit, its terms of trade is less than 100%. If it has a current account surplus, its TOT is more than 100%.
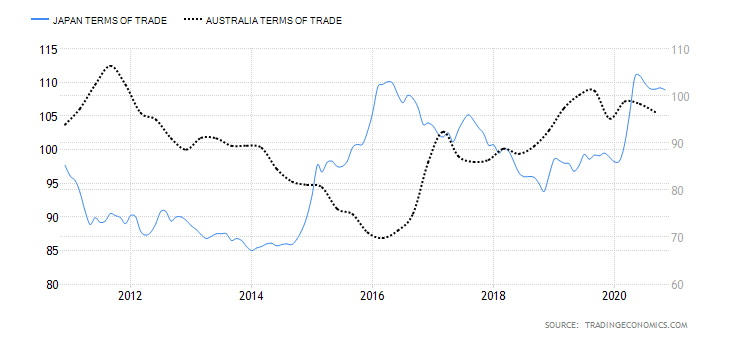
In this case, the differential between Australia and Japan’s terms of trade is the difference between Australia’s terms of trade and Japan’s. When this differential is positive, it means that Australia has a higher current account balance than Japan. Consequently, implying that the AUD is in higher demand in the international market than the JPY, hence a bullish AUD/JPY. Conversely, the differential is negative when Japan has higher TOT than Australia, resulting in a bearish AUD/JPY.
Between January and October 2020, Australia TOT averaged at 97.9% while that of Japan at 106.43%. The terms of trade differential between Australia and Japan is -8.53%. It has a score of -3.
- Annual GDP Growth Rate Differential between Australia and Japan
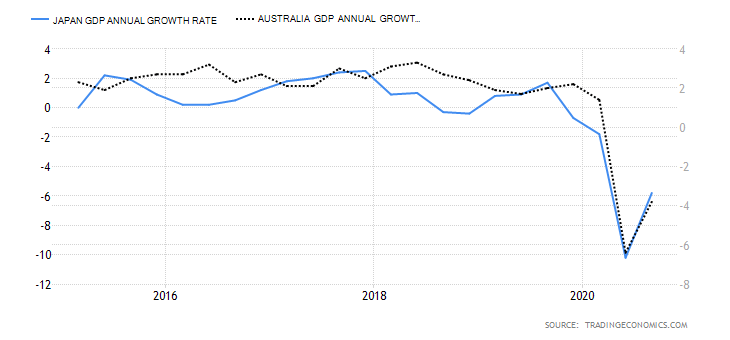
Annual GDP growth rate measures if a country’s economy is expanding, contracting, or stagnating. It tracks the change in GDP growth at a particular period over the preceding year. By measuring the annual GDP growth rate differential, we can effectively compare economic growth in Australia and Japan since both economies have different compositions, making absolute comparison ineffective. The differential is positive when the Australian economy is expanding faster or contracting slower than the Japanese economy. In this case, the AUD/JPY pair will be bullish, and vice versa.
In the first three quarters of 2020, Australia’s annual GDP growth rate was -8.8%, and that in Japan is -17.8%. The differential is 9%, and thus, has a score of 6.
- The AUD/JPY interest rate differential
The AUD/JPY pair’s interest rate differential shows whether the pair is bound to be bullish or bearish in the long term. If positive, then Australia has a higher interest rate than Japan which means that traders and investors would earn higher returns by selling the JPY and buying the AUD’ hence, a bullish AUD/JPY. When Japan has a higher interest rate, traders will earn higher returns by selling AUD and buying JPY; hence, a bearish AUD/JPY.
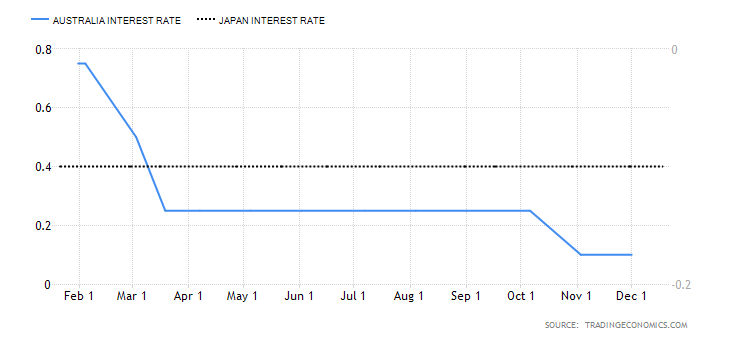
In 2020, the RBA cut interest rates from 0.75% to 0.1% while the BOJ maintained interest rate at -0.1%. Thus, the AUD/JPY interest rate differential is 0.2% and has a score of 3.
Conclusion
| Indicator | Score | Total | State | Comment |
| Australia and Japan Terms of Trade Differential | -3 | 10 | A differential of -8.53% | Japan has better terms of trade than Australia |
| Annual GDP Growth Rate Differential between Australia and Japan | 6 | 10 | 9.00% | Japanese economy contracted faster than that of Australia. This might change as economies open up |
| The AUD/JPY interest rate differential | 3 | 10 | 0.20% | The BOJ has no prospects pf changing the -0.1% interest rate. The differential is expected to change with changes in RBA’s interest rate policies |
| TOTAL SCORE | 6 |
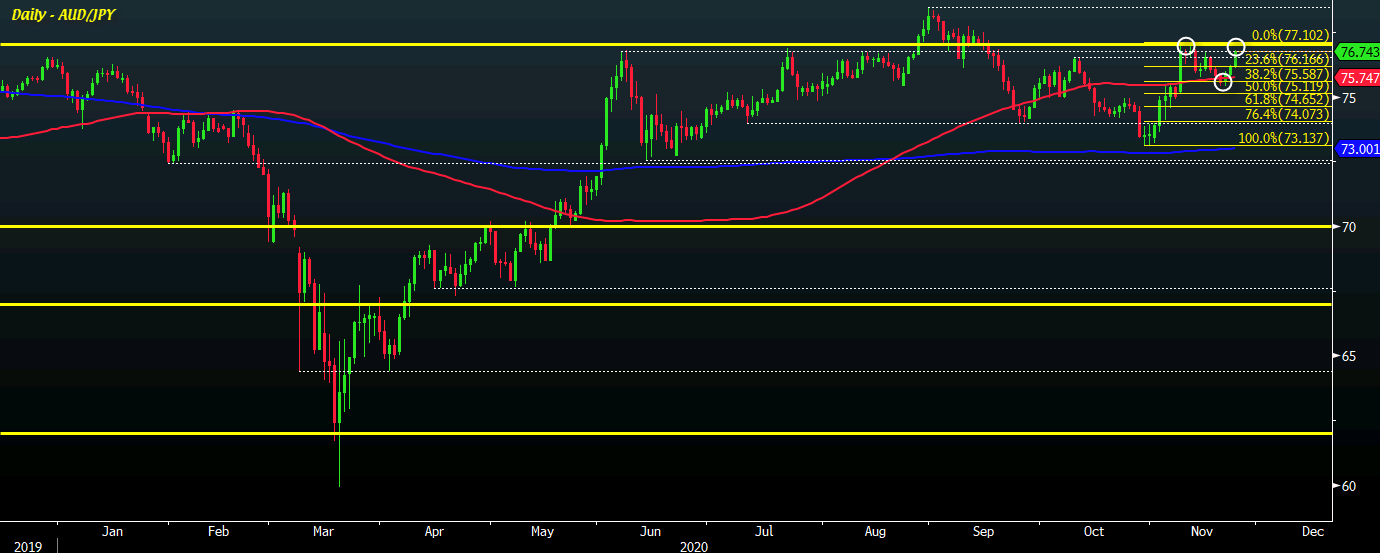
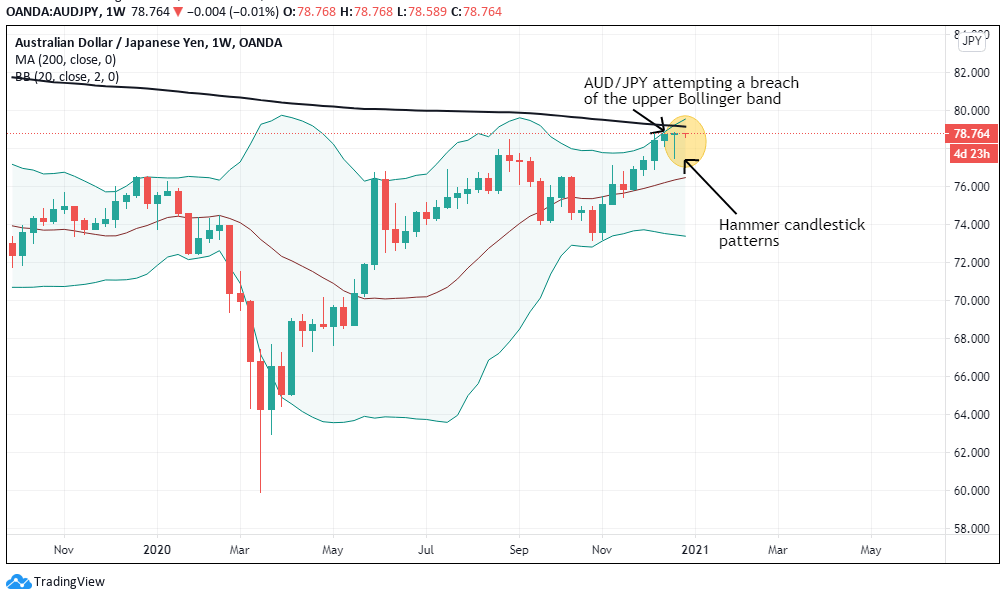
The exogenous factors have a score of 6 which means the AUD/JPY pair can be expected to continue trading in a bullish trend. Technical analysis of the pair’s weekly price chart shows it is attempting to breach the upper Bollinger band. More so, the pair has formed ‘hammer’ candlesticks showing that bears have failed to push the price lower.

