Introduction
When conducting the global macroeconomic analysis, endogenous and exogenous factors are considered. These analyses can be used to explain the price dynamic of a currency pair. In this case, we will analyze the endogenous factors that drive the economy in the US and Switzerland. We will also analyze the exogenous factors that primarily drives the price of the USD/CHF pair.

Ranking Scale
A sliding scale from -10 to +10 will be sued to ranks the impact of the individual endogenous and exogenous factors on the currency. A negative ranking for the endogenous factors means that they had a depreciating impact on the individual currencies, while a positive ranking means they resulted in currency appreciating.

Similarly, a negative ranking for the exogenous factors implies that they’ve had a bearish impact on the currency pair, while a positive ranking means they’ve had a bullish impact.
Summary of USD Endogenous Analysis

From the above table, we can see a clear deflationary effect on the USD currency and implies that it has depreciated in its value since the beginning of the year. You can find the complete USD Endogenous Analysis here.
Summary of CHF Endogenous Analysis
Overall, the endogenous analysis of CHF has a score of -5. That implies that the CHF is expected to have depreciated marginally in 2020.

- Switzerland Inflation Rate
The rate of inflation is used to measure the changes in the price of consumer goods in Switzerland over a specified period – usually monthly or yearly. Here are the components of the CPI in Switzerland: Housing and energy, which accounts for 25% of the total CPI weight; 16% for healthcare; Transport accounts for 11%; Food and non-alcoholic drinks 11%; hotel and restaurant services 8%; 4% for Household goods and services; and clothing 3%. Education, communication services, and alcoholic beverages cumulatively account for 7% of the total CPI weight.
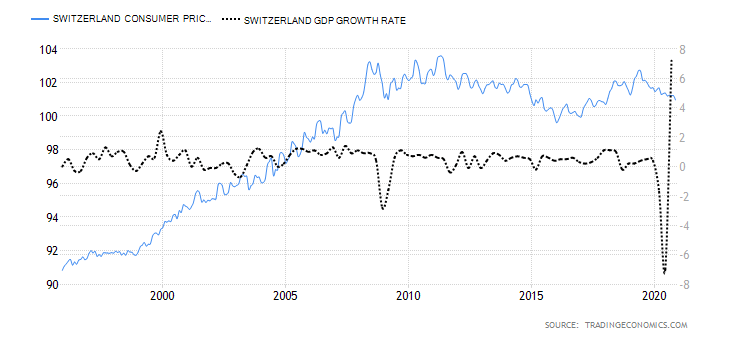
In November 2020, the YoY CPI in Switzerland dropped by 0.7%, while the MoM CPI dropped by 0.2%. The fall in prices of the hotel and holiday packages contributed to the drop in the inflation rate. The Switzerland CPI is at the lowest point since January 2018.
Based on our correlation analysis, we assign the Switzerland rate of inflation a score of -3.
- Switzerland Unemployment Rate
This economic indicator shows the percentage of the total Swiss labor force that is actively seeking a job. Note that not all unemployed portion of the working-age population are seeking employment; so, they are not captured by the unemployment rate.
The unemployment rate can also be used to show the rate at which the economy is adding or cutting job opportunities. This can be used to show economic growth.
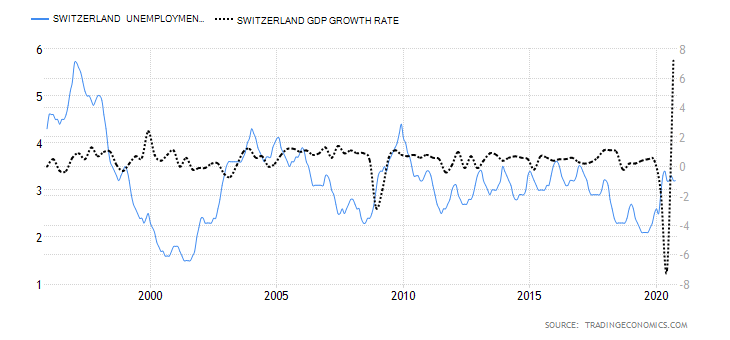
In October 2020, the Swiss unemployment rate was 3.2%, down from highs of 3.4% in May, while the employment rate in Q3 2020 was 79.7%. Although it is higher than the 79.1% registered in Q2, it is still significantly lower than the pre-pandemic rate of 80.4%.
The Swiss unemployment rate has a high correlation with the GDP, but since it only increased marginally, we assign it a score of -2.
- Switzerland Manufacturing PMI
The Swiss procure.ch Manufacturing Purchasing Managers’ Index surveys the executives in the manufacturing sector. The index is a measure of the Swiss manufacturing sector’s performance and serves as a leading indicator for business expectations.
The Manufacturing PMI is an aggregate of five components: new orders, which a weight of 30%, output 25%, employment 20%, supplies 15%, and inventory 10%. The manufacturing sector is expected to expand when the index is above 50 and contract when the index is below 50.

In November 2020, the Swiss procure.ch Manufacturing PMI increased to 55.2, the highest since December 2018. Based on the correlation analysis with the GDP, we assign a score of 7 since it shows a robust expansion.
- Switzerland Services PMI
The Swiss services industry employs over 60% of the working population and accounts for 73% of Switzerland’s GDP. This makes the services PMI a crucial indicator of the overall economy. The Services PMI is obtained through a comprehensive survey of 300 purchasing managers in the services sector to evaluate the changes in business activities.
The survey covers areas such as customer new orders, purchasing, and sales prices, and changes in the employment level.

In November 2020, the Swiss services PMI dropped to 48 from 50.4 in October, primarily attributed to new orders’ contraction. Although it is almost double the 21.4 recorded in April, it is still lower than the 57.3 recorded in January 2020. We, therefore, assign it a score of -4.
- Switzerland Consumer Confidence
In Switzerland, consumer confidence is used to evaluate households’ opinion on the overall economy and their financial position. Typically, consumer confidence is higher when there is high GDP growth, and the unemployment rate is low.
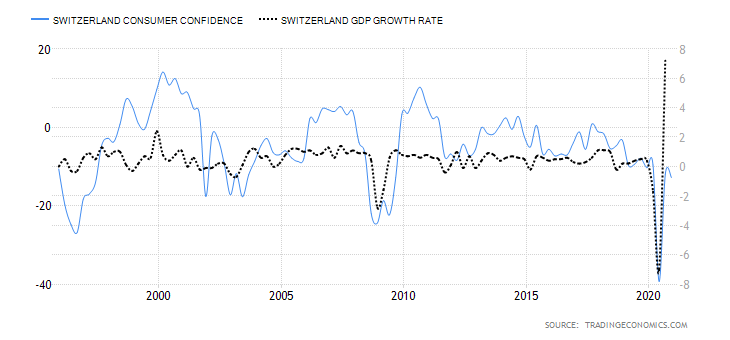
In the fourth quarter of 2020, the Swiss consumer confidence was -12.8, better than Q2 -39.3. Consumer confidence is used to show the likelihood of how much households will spend in the economy. Hence we assign it a score of -2.
- Switzerland Government Gross Debt to GDP
The Swiss government debt is the totality of the government’s amount owed to both domestic and foreign lenders. This debt is expressed as a percentage of the GDP o help determine the indebtedness of the economy. Lenders also use this metric to determine if there is a possibility of default by the government. Typically, government debt that is less than 60% of the economy is considered ideal.
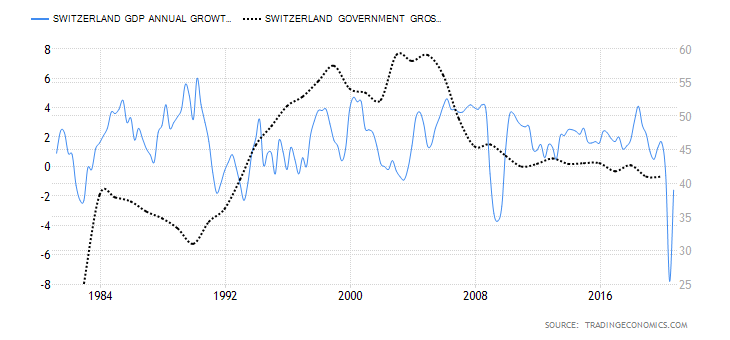
In 2019, Switzerland’s government gross debt to GDP was 41%, and it’s projected to hit 49% in 2020 due to increased government expenditure to curb the economic slowdown brought about by the coronavirus pandemic. However, the Swiss government’s gross debt to GDP has been steadily declining since 2004, averaging at around 37%. Based on our correlation analysis and the fact that it has marginally increased in 2020, we assign a score of -1.
Now we know that both USD and CHF have depreciated according to their respective endogenous indicators. Please check our next article to know if this pair is expected to be bullish or bearish in the near future according to their exogenous indicators. Cheers.