Categories
Beginners Forex Education Forex Assets

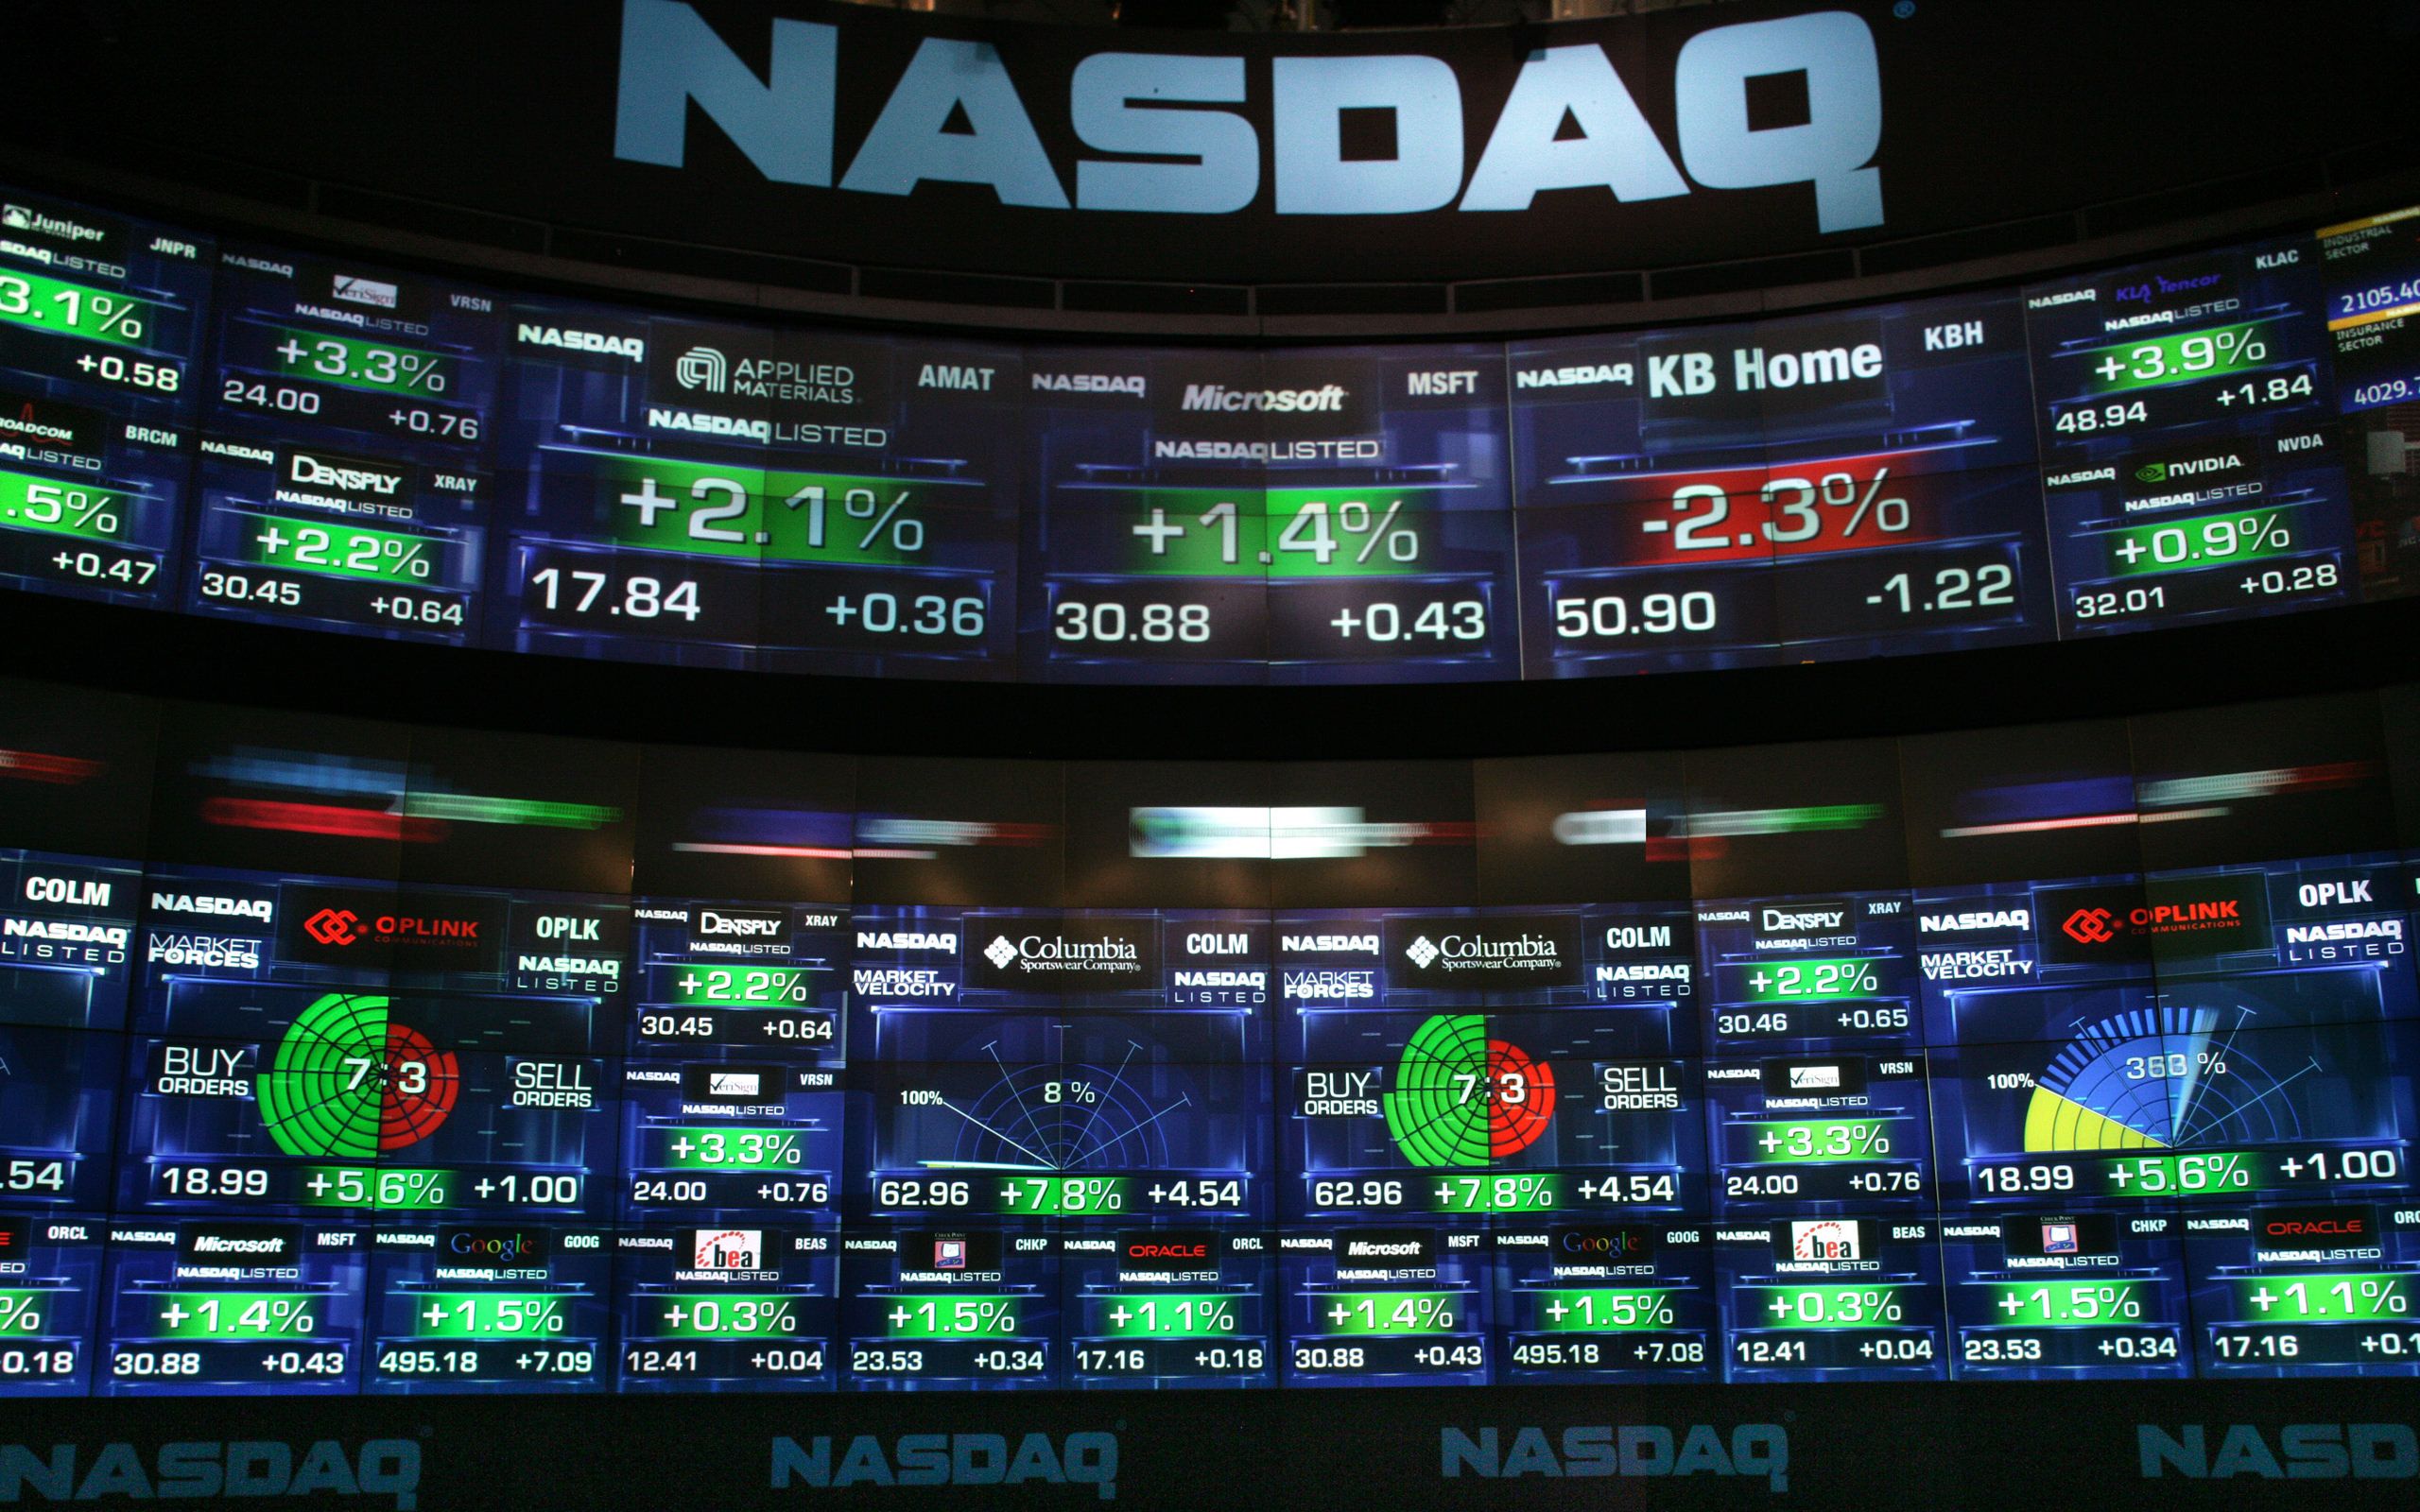
NASDAQ: What Forex Traders Need to Know

It is possible to invest in Nasdaq in a simple way, both in the general market (through an index) and in individual stocks. Just choose the financial instrument that best suits your needs and open an account with a broker. Nasdaq is the name of a financial market, usually associated with technology, but why? What advantages does this have? One of the most important questions is, how is it possible to invest in this market?

What is Nasdaq?

The term Nasdaq is an acronym. It corresponds to the National Association of Securities Dealers Automated Quotation (National Association of Securities Dealers Automated Quotation). It is a market; a stock exchange. The largest in the United States behind the NYSE (New York Stock Exchange). This market also has its own representative indices, and they also adopt the name Nasdaq (which we will see shortly). It is worth noting that the Nasdaq Stock Market does not have a physical location (such as the New York Stock Exchange parquet), but is based on a telecommunications network.

The birth of the Nasdaq, as a stock market, takes place when the Securities Exchange Commission (SEC), the US stock market regulator, asked the National Association of Securities Dealers (NASD) to regulate the OTC (Over The Counter) market in the ’60s.

To give us an idea, before the Nasdaq saw the light of day, in the United States, the stocks of companies could be bought and sold in three ways:

  • At the New York Stock Exchange (NYSE)
  • In the American Stock Exchange (AMEX)
  • Outside a stock exchange (OTC market; “over the counter”: agreements between two parties, outside an official market)

Buying and selling OTC stocks is not illegal, however, neither are all the guarantees of security, transparency, liquidity, etc. Therefore, the SEC called for a better organization. This led to the automation of the market (by the NASD), which has already been discussed and, thus, the NASDAQ was created in 1971. But there was a question that did not end up pleasing: it was still an OTC market and therefore a second category market. The companies listed in the same began in this way because they could not access the “real parquet”. In other words, his ambition was to go on the AMEX market and, as a climax, enter the NYSE (the largest stock exchange).

In order to have the opportunity to be listed on the stock exchange, different companies must meet a number of requirements. However, the conditions imposed by the NYSE are very strict and make it difficult for young companies to access. In this way, many companies started trading in this new market. These were mainly technology firms and, for this reason, the Nasdaq has always identified with technology. Its fully electronic operation also influenced the attractiveness of companies belonging to this sector.

But the National Association of Securities Dealers Automated Quotation (NASDAQ) was not willing to be a “second-class” market. Thus, in 1975, it developed its own listing rules and separated the stocks of stronger companies from the OTC. In 1982 the most powerful companies of the Nasdaq split up and created the Nasdaq National Market. Finally, in 1991 stock market regulators recognised the stocks of Nasdaq companies as equal to those listed in AMEX or NYSE.

Currently, this market is operated by the company Nasdaq Stock Market (later privatized). In addition, it is par excellence, the market where technology companies (electronics, biotechnology, telecommunications, computing) are listed. Companies such as Microsoft or Intel are listed on this Stock Exchange. On the other hand, its popularity came from the hand of the great Internet bubble, in the 90s.

We should look at all the listed companies, analyse them one by one and make an average of the movements they have experienced individually. In this way, we will have an idea of whether the market, in general terms, has behaved bullish or bearish. But there is a simpler way: take a set of the most representative stocks and, through an average (weighted, in most cases) of the share price, check their evolution. This is precisely a stock market index.

As we discussed earlier, investing in an index is like investing in the market as a whole. In this case, investing in a Nasdaq index is investing in a basket of securities composed of a number of more representative Nasdaq companies: Follow the evolution of an entire market.

Nasdaq 100: The Nasdaq 100 index was created on 31 January 1985 and is made up of the 100 largest technology companies listed in the Nasdaq Stock Market (actually there are 103, since 3 of the companies that make up the index issue two classes of stocks). It does not include stocks of financial companies (nor those dedicated to investment); for this reason, the Nasdaq 100 represents the technology sector well. The Nasdaq Stock Market is open to both US and foreign firms (since 1998). In this way, this index reflects the performance of the 100 largest companies in the technology industry in the world.

Nasdaq Composite: This index is composed of all companies listed in the Nasdaq market. In this “Electronic Stock Exchange” are traded securities of more than 3 thousand companies. It may include stocks of financial, investment and technology companies in general.

Nasdaq Biotechnology: Nasdaq Biotechnology is part of the pharmaceutical and biotechnology companies listed on the Nasdaq Stock Market (and only listed on this market), as well as other requirements).

Nasdaq Financial: includes all financial companies that have been excluded from the Nasdaq 100.

Why Invest In Nasdaq?

Not all stocks listed on the Nasdaq are purely technological. But this market has a strong orientation to that sector. In the Nasdaq 100 index, technology has a weight of 54%. In it, we can find the leading companies in this industry worldwide. The good evolution of technology firms has traditionally been associated with an expansive phase of the business cycle. However, because of the great social changes we are experiencing, technology is increasingly present in our lives.

Technology has a real application in any aspect of our day today. Just to mention a few examples:

  • Transportation (vehicles increasingly equipped in comfort and safety).
  • Telecommunications (social networks, new forms of leisure and information, B2C, B2B, 5G, etc.).
  • Health care (robotics, biotechnology, etc.).
  • Financial services (electronic banking, Fintech, Robo advisors, Blockchain and cryptocurrencies, etc.).
  • Computer science (home automation, cloud computing, artificial intelligence, big data, etc.).

Although some analysts and investors talk about the possibility that a bubble could be created by the growth experienced by this sector in recent years, The fact is that the profits registered by technology companies and the progress they can experience cause the value of this type of company to also be increased.

Many companies in this sector are in the top 10 of the largest companies in the world:

  • Apple
  • Microsoft
  • Amazon
  • Alphabet (Google)
  • Alibaba
  • Facebook

So, it’s very possible that we find solid values, rich in liquidity, and with a good balance sheet position in the technology sector.

Technology companies have also always been associated with volatile securities. This is partly true: the volatility of this sector, little by little, is being equated with that of more mature ones; they no longer have the risk potential of the 1990s and during the year 2000 (when the “dot com” bubble burst).

To sum up: this is an industry with growth potential. The disruption caused by technology is causing a change in this type of company. We can no longer talk about a high-risk sector as a whole; it has stable companies.

In any case, technological companies are characterized by the need for constant innovation, the quality of management is a factor that should be studied. These are high-growth values. Good management can make a difference (and turn a company into the new Facebook or Netflix). Just remember that “Resources must always be allocated in the most efficient manner!”

Categories
Forex Market Analysis

How Elliott Wave View of NASDAQ Anticipates Trump’s Coronavirus Outcome

Overview

The NASDAQ 100 Index fell 2.2 percent on Friday’s trading session on the news of the US President Donald Trump’s positive coronavirus test. Still, the price action unveiled the wave B completion, suggests further declines for the US technologic benchmark in the following trading sessions.

Market Sentiment Overview

During the last trading week, the NASDAQ 100 volatility has been driven by market participants’ expectations facing the first presidential debate between US President Donald Trump and former Vice President Joe Biden.

The advance experienced by the technology index was boosted by the expectation of new economic stimulus, driving the NASDAQ 100 to raise over 4%. However, its gains were lowered after the announcement of President Trump’s positive Coronavirus test, leading it to ease up to 2.74% on Friday’s trading session.

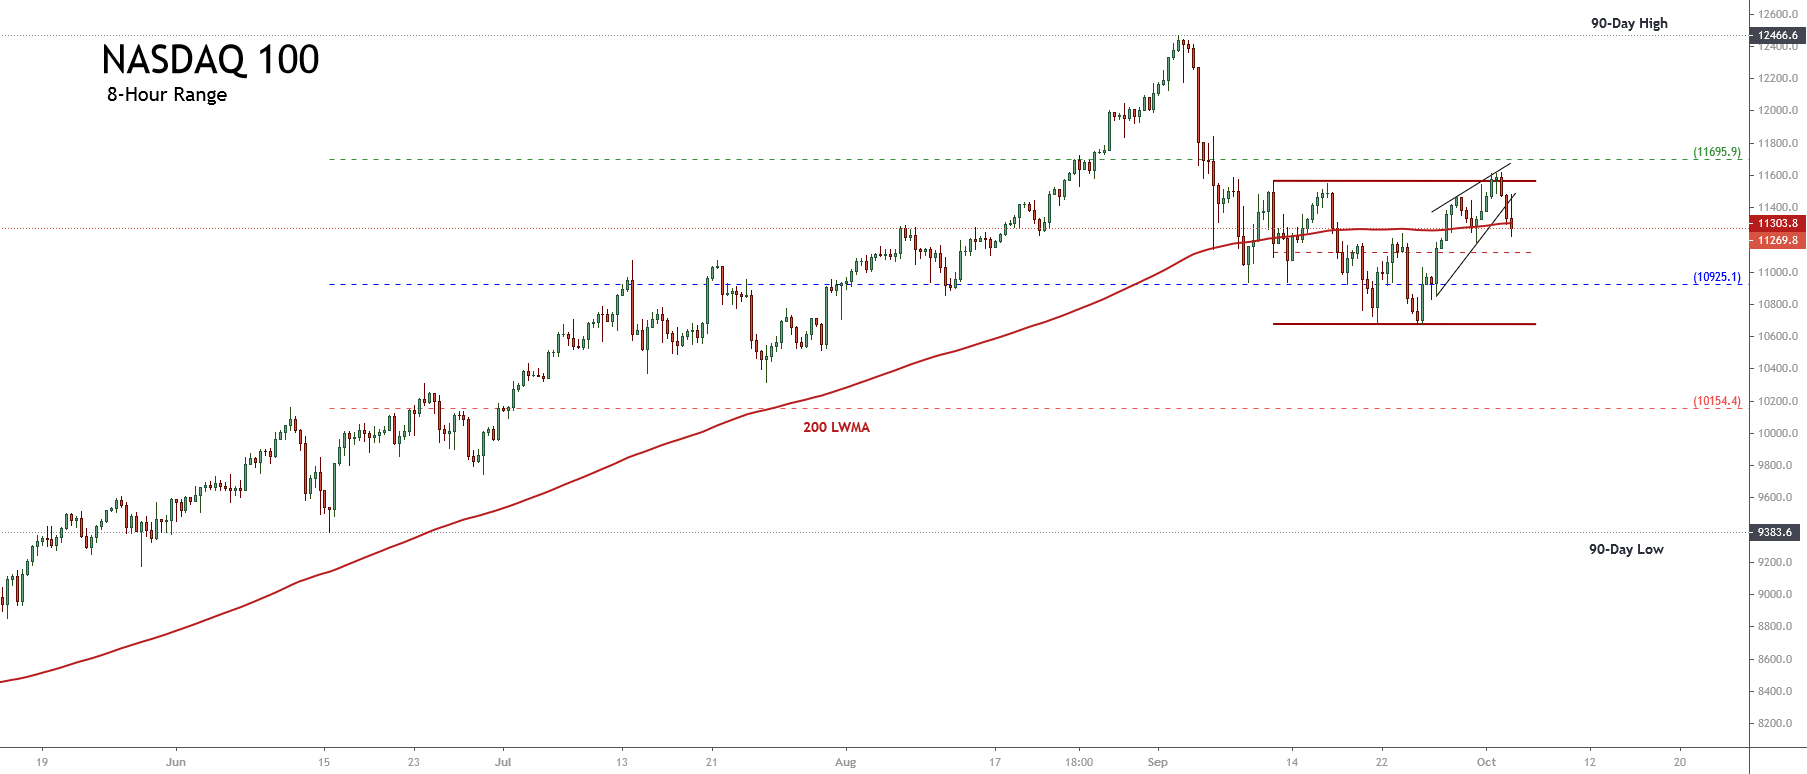
The following 8-hour chart of NASDAQ 100 reflects the 90 days high and low range. In the figure, we distinguish that the price halted its advance towards the extreme bullish sentiment zone, closing the trading week in the bullish market sentiment area and under the weighted 200-day moving average. This market context leads us to weight a neutral market sentiment.

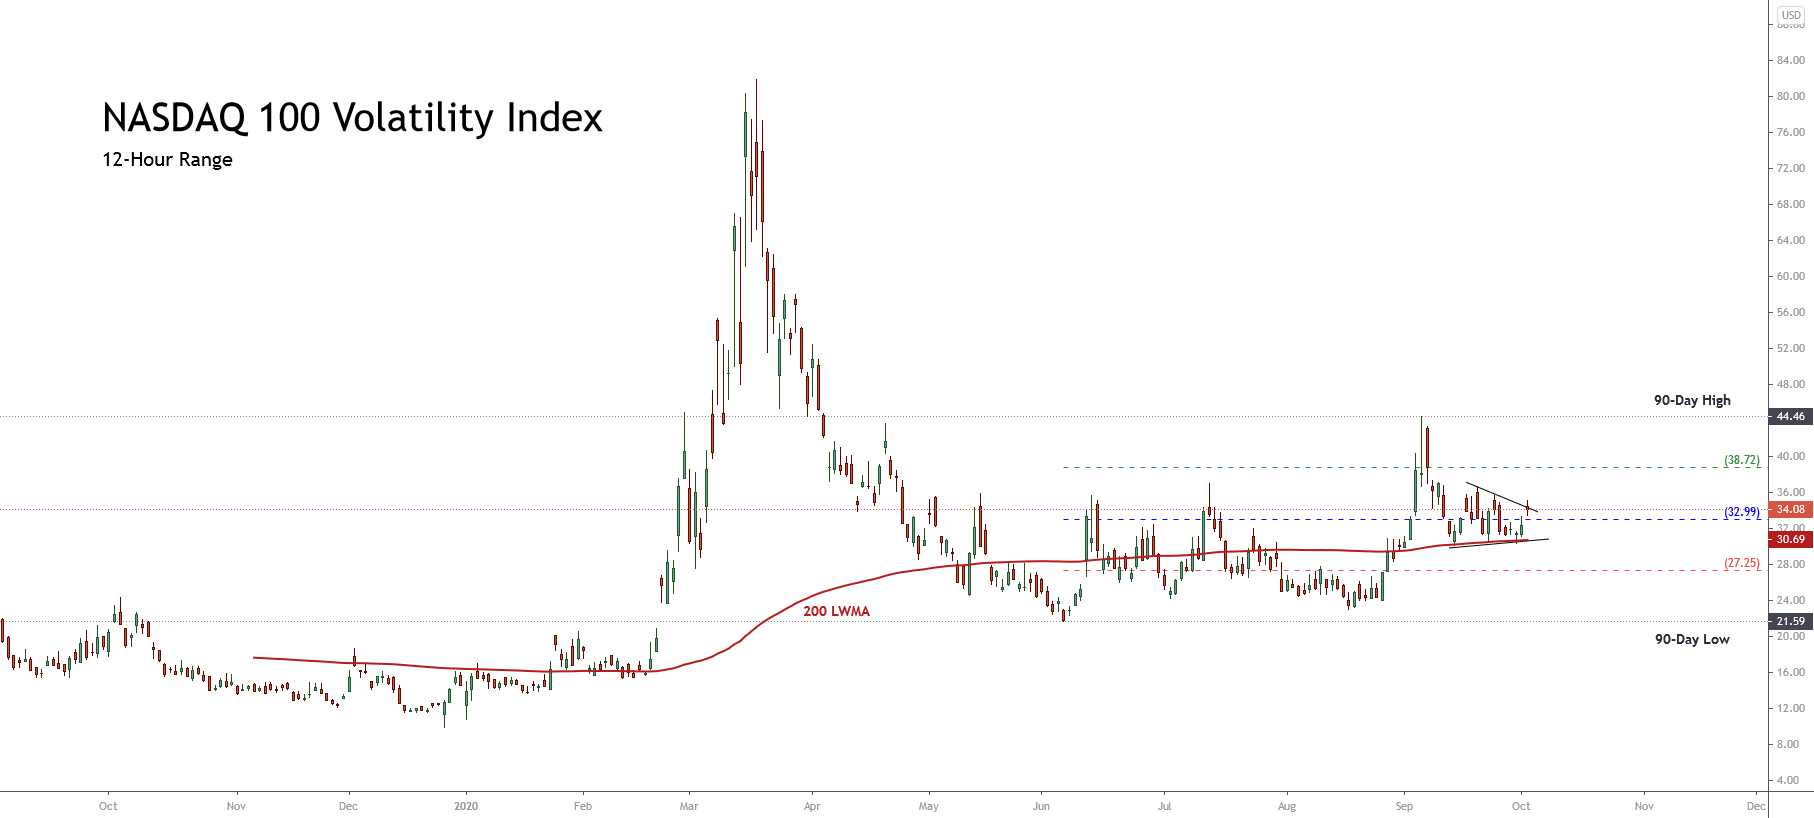
On the other hand, the 12-hour chart corresponding to the NASDAQ 100 Volatility Index shows the 90 days high and low range where we distinguish a sideways movement consolidating above the 200-period weighted moving average. This volatility context of the NASDAQ 100 index, added to the new test of the upper-line of the consolidation structure, leads us to expect an increase in volatility within the coming trading sessions.

Summarizing, NASDAQ 100’s market sentiment unveils that this index and its volatility figures will be driven by the news on the upcoming presidential elections on Tuesday, November 03. In particular, NASDAQ 100 could turn bearish in the following trading sessions.

Elliott Wave Outlook

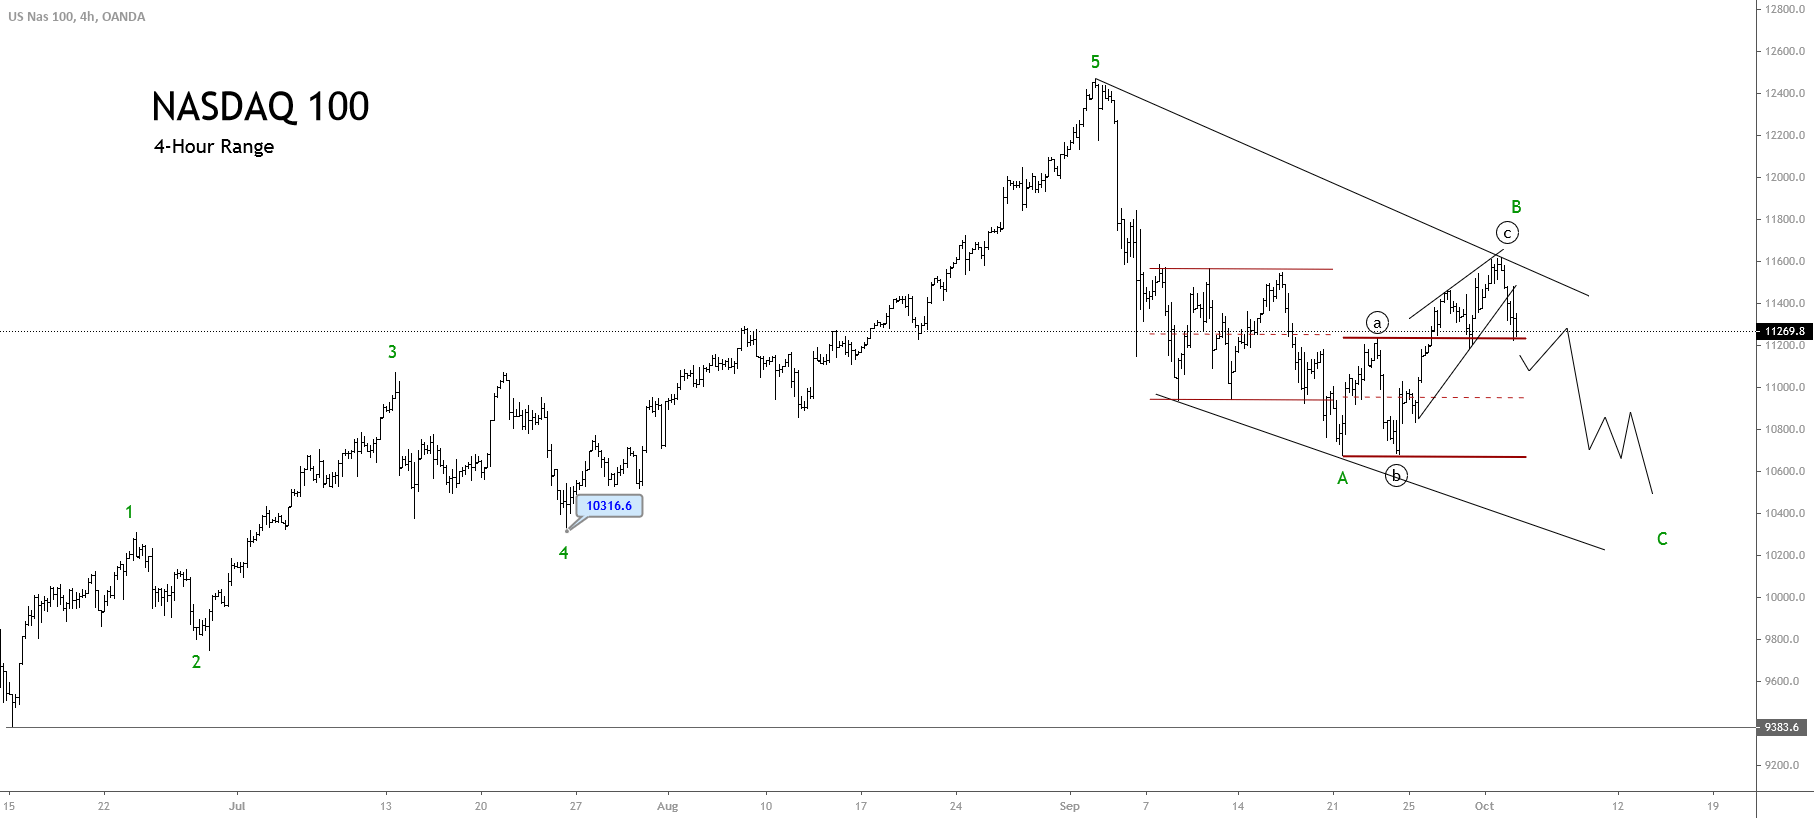
The overview of NASDAQ 100 shows the full development of a five-wave bullish sequence, which began on June 15, when the price found fresh buyers at 9,383.6 pts pushing the price towards new record highs September 02 at 12,466.6 pts. Once reached the all-time high, the technological index began to perform a bearish corrective movement, which remains in progress.

The following chart shows the NASDAQ 100 in its 4-hour timeframe, where we distinguish that the price has completed a five-wave impulsive structure of Minor degree labeled green. At the same time, we can confirm that the Elliott wave theory rule, stating that there must be only one extended wave. In this case, the NASDAQ 100 index developed a fifth extended wave that ended on September 02 when the price found resistance at 12,466.6 pts. Once the fifth wave of Minor degree concluded, the NASDAQ 100 began performing a corrective sequence, which remains in progress.

In particular, the completion of the wave ((c)) of Minute degree identified in black, which completed the wave B of Minor degree, coincided with the news media release concerning the US President Trump’s positive test, activating the beginning of the wave C, labeled in green.

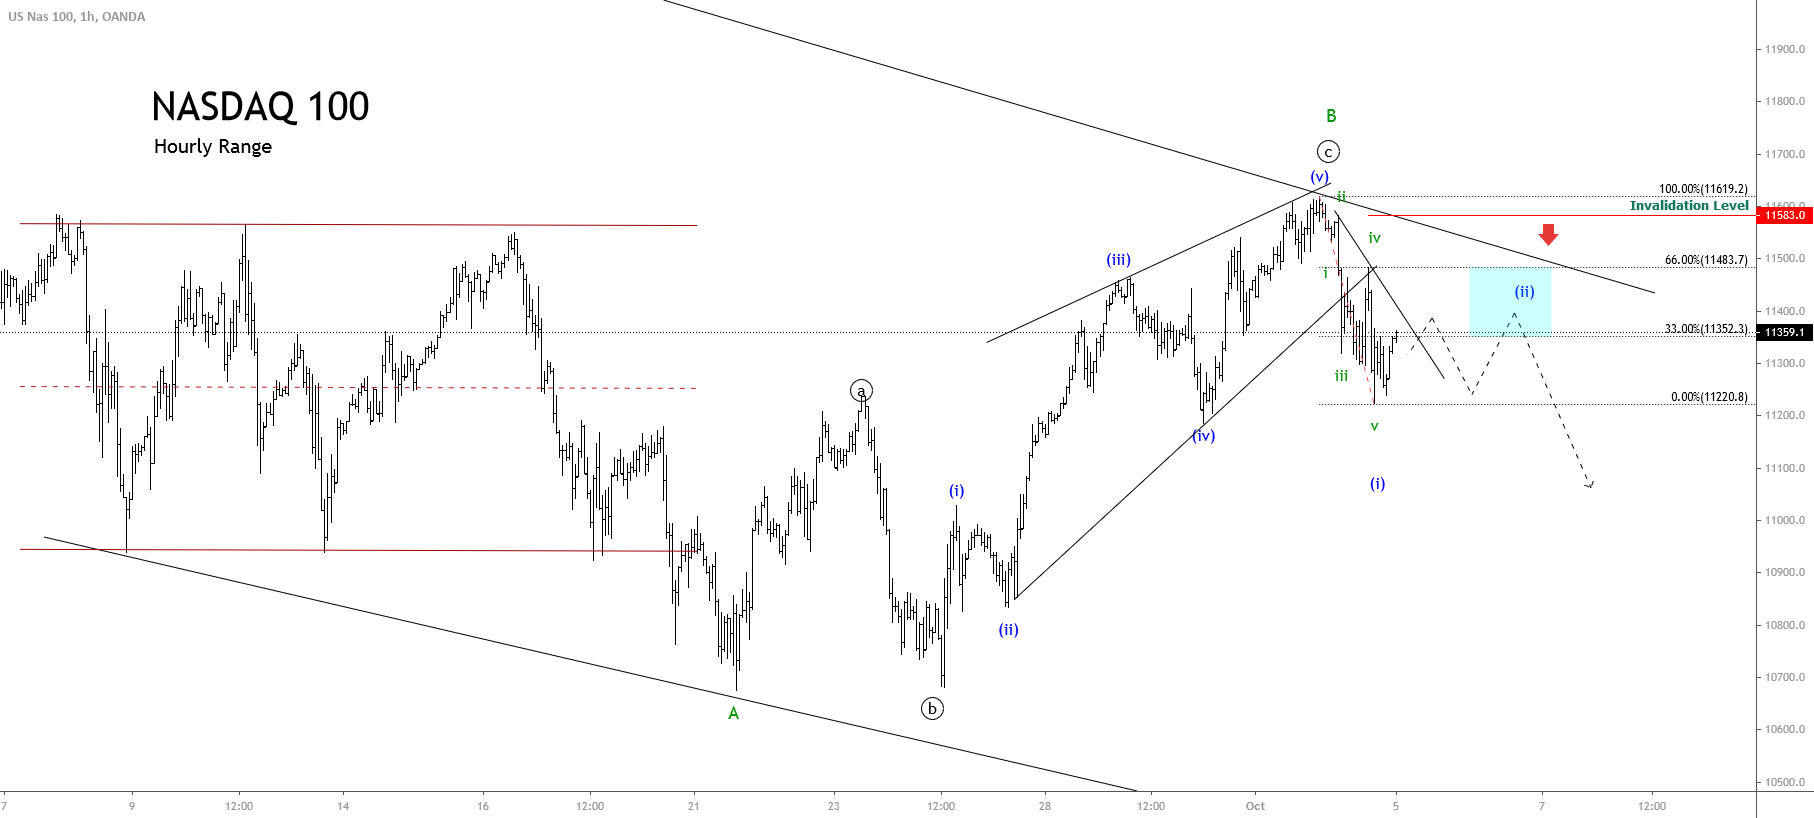
The following hourly chart of NASDAQ 100 illustrates the first bearish movement’s internal structure corresponding to its wave (i) of the Minuette degree identified in blue. This first downward wave reveals a drop in five moves of Subminuette degree identified in green in its internal formation. Once this second move has been completed, the technological benchmark should resume its declines.

Finally, considering that wave (i) of Minuette degree completed its descending move at 11,220.8 pts on Friday 02nd, the price could retrace, forming its second wave of the same degree. In terms of the Dow Theory, this retrace could be between 33% and 66%, or between the 11,352.3 pts and 11,483.7 pts, where NASDAQ 100 might start to develop a new decline, corresponding to wave (iii) in blue.

Categories
Forex Market Analysis

Dollar Index Drops, Sterling jump to its max, Wall Street is moved up by Earnings

Hot Topics.

  • Dollar Index drops despite the increase in Retail Sales (MoM) in March.
  • Sterling strikes the highest level of the year for a second time.
  • Japanese Cabinet says the economy is “recovering moderately.”
  • Watching the Copper bullish cycle.
  • US Indexes climbs are boosted, aided by the companies earnings reports.

Dollar Index drops despite the increase in Retail Sales (MoM) in March.

The US economy continues showing strength signals about its economic growth. This time it was the retail sales report shift that advanced up 0.6% from February 2018 and 4.5% (YoY). Sales from the vehicle and parts dealers boosted 2% in March. Despite this good news, the US Dollar Index fell 0.40% touching its PRZ. While the price continues above the 88.52 level, we will consider the chance of a new bullish cycle.

The Euro, which represented more than 50% of the Dollar Index, closed the session with 0.41% gain. The pair still has almost 40 pips of space to reach its PRZ, previous to the ZEW economic sentiment data release. Meanwhile, the Index still could maintain its trading range. The invalidation level of the reversal scenario is above 1.2476.


Sterling strikes the highest level of the year for a second time.

The Pound is the best performing currency of the year with an advance of 6.24% (YTD). Not even the uncertainty driven by the Brexit negotiations or the negatives consequences of the severe weather conditions that have impacted some sectorial economic indicators have been enough to slow the Pound rally. In our last Daily Update, we saw a potential top and reversal pattern; our vision is that we could witness a 2B Pattern. In this case, we will be attentive to a breakout candle before to pulling the trigger.


Japanese Cabinet says the economy is “recovering moderately”.

The Cabinet Office of Japan described Japan’s economic growth as a “recovery at a moderate pace”. The private consumption and business investment in exports are “picking up”. Concerning the tariffs tensions between the US and China, the Cabinet economists see it as a risk factor they will observe closely. The USDJPY pair fell 0.31% to our PCS (Potential Continuation Section) as a bearish wedge pattern. If the price remains above 106.61, our vision continues to be bullish.The Pound/Yen cross is testing the second monthly resistance pivot level; however, it still could make new highs before a deeper correction. Our vision is that the cross could climb to the area between 155.8 – 157. Selling positions are considered only if the price breaks below the 152.95 level.

Watching the Copper bullish cycle.

Copper is developing a bullish cycle since January 2016. It is currently in an ascending expansive triangle pattern. In the long term, the red metal has “market debt” in the 3.44 level. In the short-term, as long as the price keeps above 2.98, the trend is bullish. If the price moves down to 3.01 – 3.03, copper could find new buyers at those levels, with their targets at around 3.20 – 3.21 and its extension in the 3.25 – 3.28 area.

US Indexes climbs are boosted, aided by the companies earnings reports.

This week,  the big companies started their quarterly earnings release. The optimistic analysts’ expectations came under the assumption that results are coming mainly from activities made before the tariffs conflict between the US and China. Dow Jones 30 closed the first trading session of the week with an advance of 0.44%. The Dow is testing the key level 24,620 and we are watching from our short-term picks. The invalidation level is below 24,090.

In the same way, Nasdaq 100 closed the session advancing 0.43%. The Technological Index is moving in an ascending triangle pattern. Mid-term, we expect that the price will hit the 7,090 level. The invalidation level for the bull market scenario is below 6,398 pts.

© Forex.Academy