Categories
Forex Daily Topic Forex for Beginners

How To Trade The Markets Now- Joe Biden The President Elect Is In Play!

Joe Biden President-Elect? How might the markets react long term?

Thank you for joining this forex academy educational video. In this video, we will be looking at the present, with Joe Biden of the democratic party as President-elect.

At the time of writing, Joe Biden would appear to have an unassailable lead in the US presidential elections. No doubt, President Trump will use every tool and trick at his disposal to try and hang on to power, including legal intervention in what he calls fraudulent voting, which, according to the press, is totally unfounded.
However, with votes still being counted in a handful of remaining states, and with Joe Biden well out in front, it would appear ear that he has one foot in the White House already.
What would this mean for the financial markets?
The Democrats, headed by Joe Biden, have lambasted Trump’s policies over the last 4 years. They will likely try and reverse many of the policies implemented by the Trump administration. One of the Democrats’ election pledges was to impose extra corporate regulation, taxes, and healthcare spending, all of which would be negative for the stock markets in the United States unless, of course, they are healthcare-related, or in the green sector, where Joe Biden has pledged to spend more money, to reduce greenhouse gases. Joe Biden has pledged to give the country a leading role in global efforts to curb climate change, a reversal in direction from the Trump administration where Donald Trump withdrew from the Paris climate agreement in 2017.
Another policy that has helped Joe Biden gain votes is his pledge to penalize companies, presumably by taxation, that moved jobs abroad. This will undoubtedly have been why the Midwest saw a surge in Democratic votes because it is the industrial heartland of America, the so-called Rust Belt.
In a twist, where investors might have bailed out of stocks due to a potential shift in policy under a new administration, with regard to higher taxes for corporations and more regulations, which would tie the hands of corporate companies and potentially affect their earnings capabilities, the markets have been airing on the side that a potential democratic party victory may be the quickest route to a generous government stimulus continuation package, and this of course, in the current economic uncertainties, would be a welcome thing.

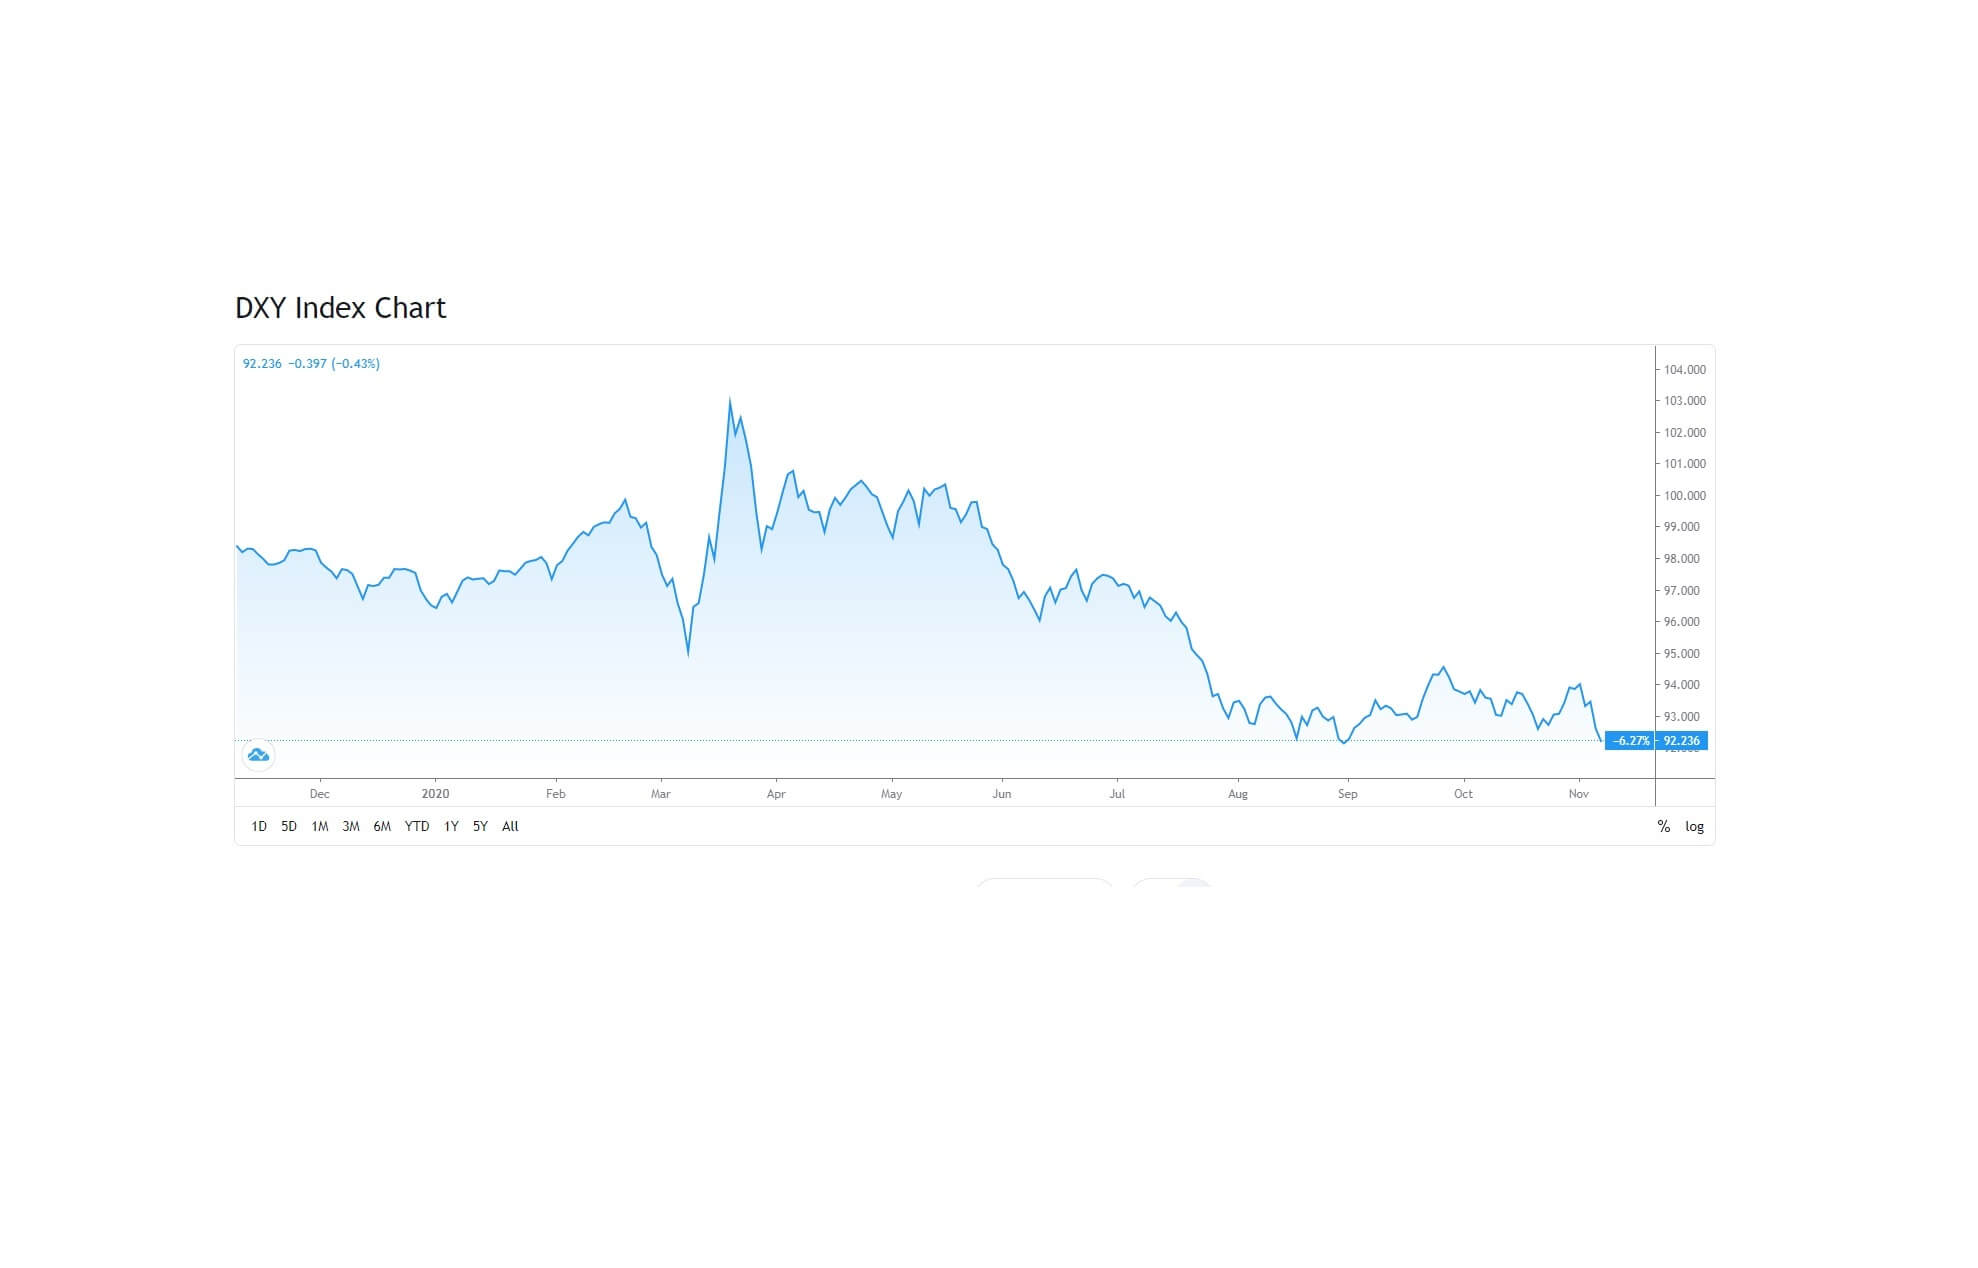
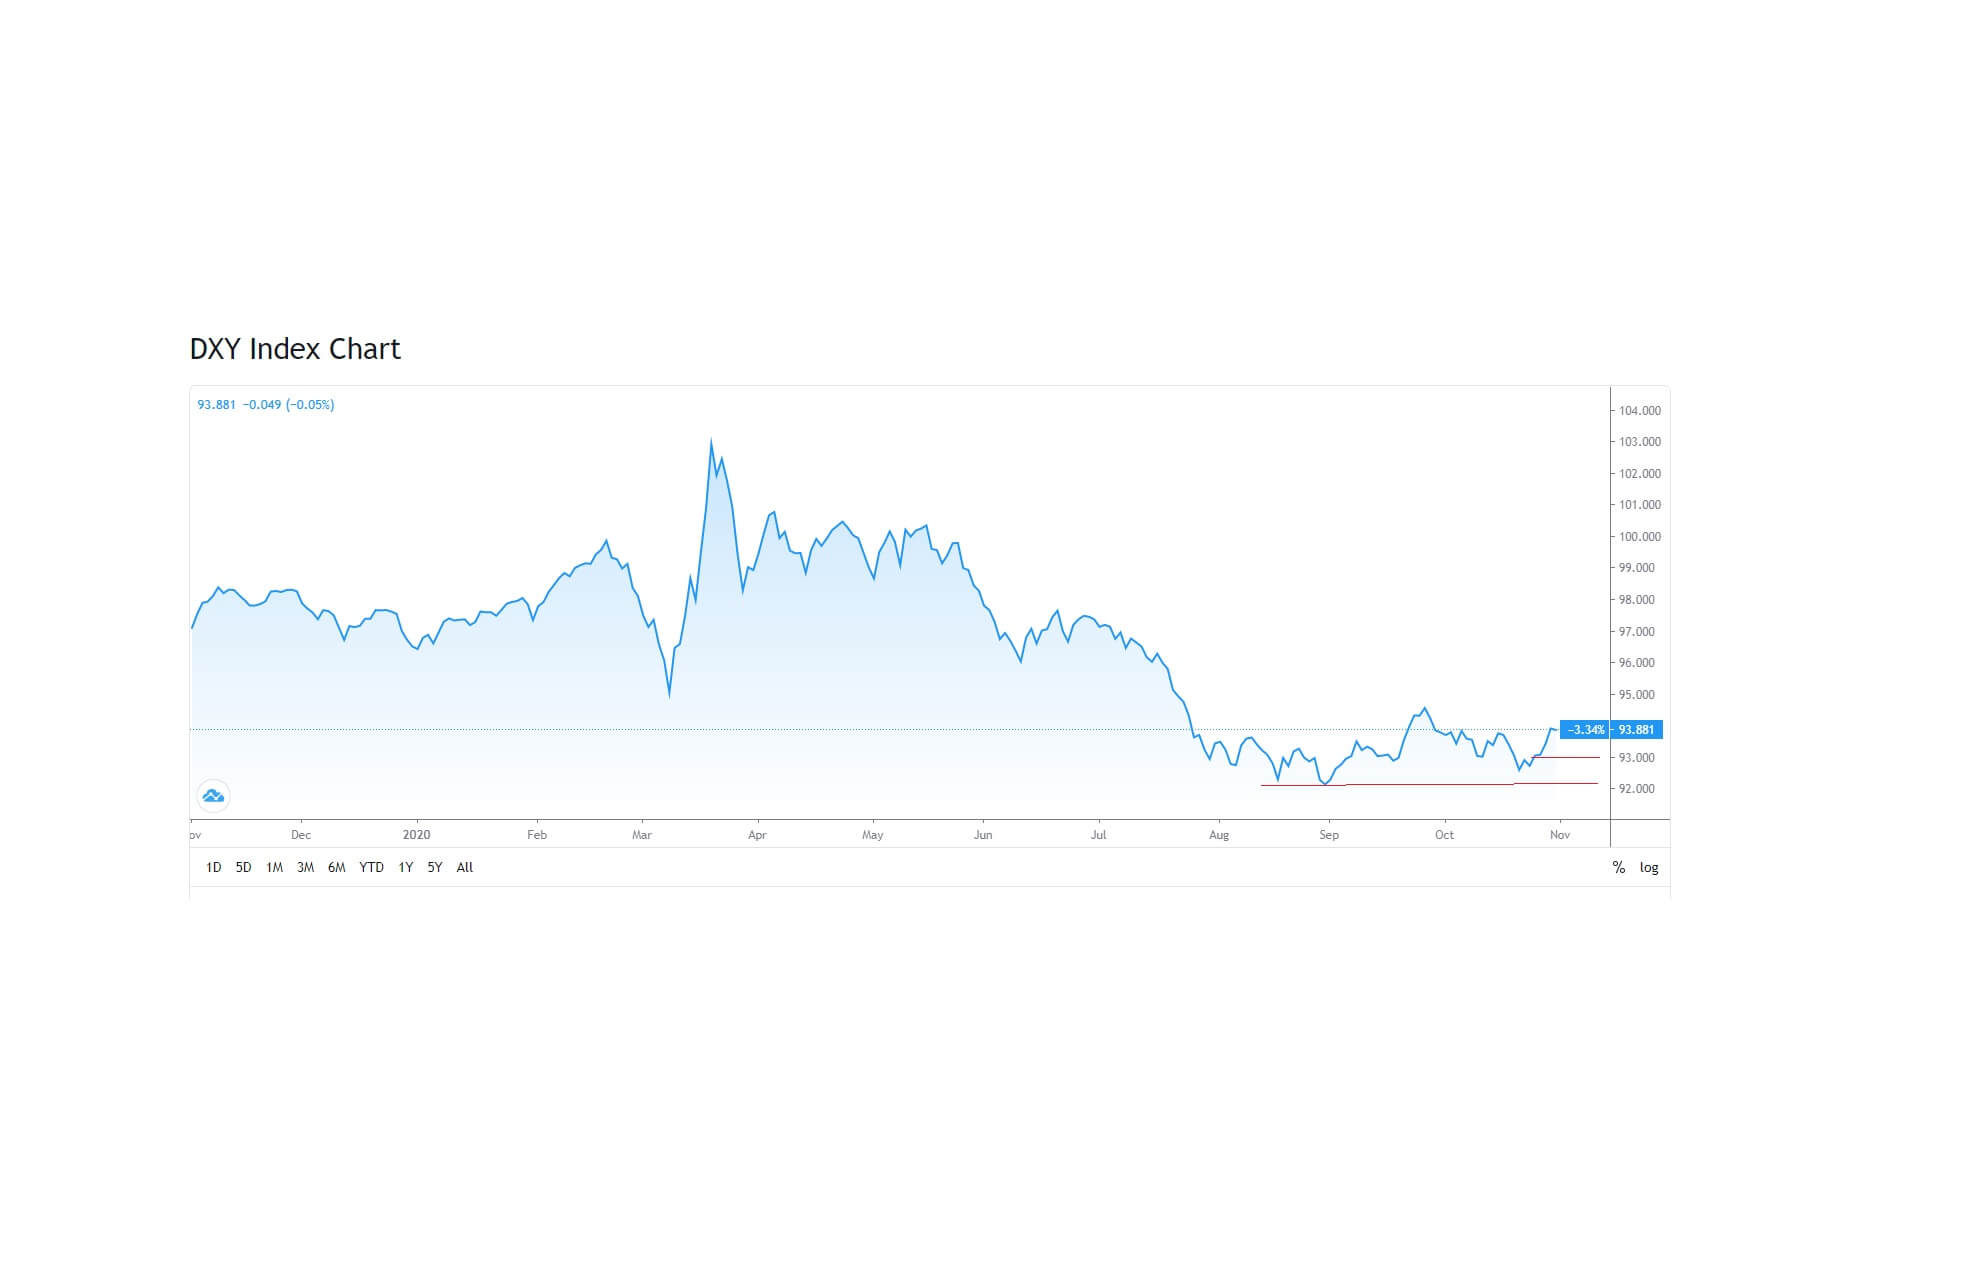
In the lead up to the election, we can see here that the US dollar index, which is a measure of the dollar value against the basket of major currencies, the price has fluctuated between 92.00 and 94.00 since mid-August, with pressure currently to the downside at the time of writing.

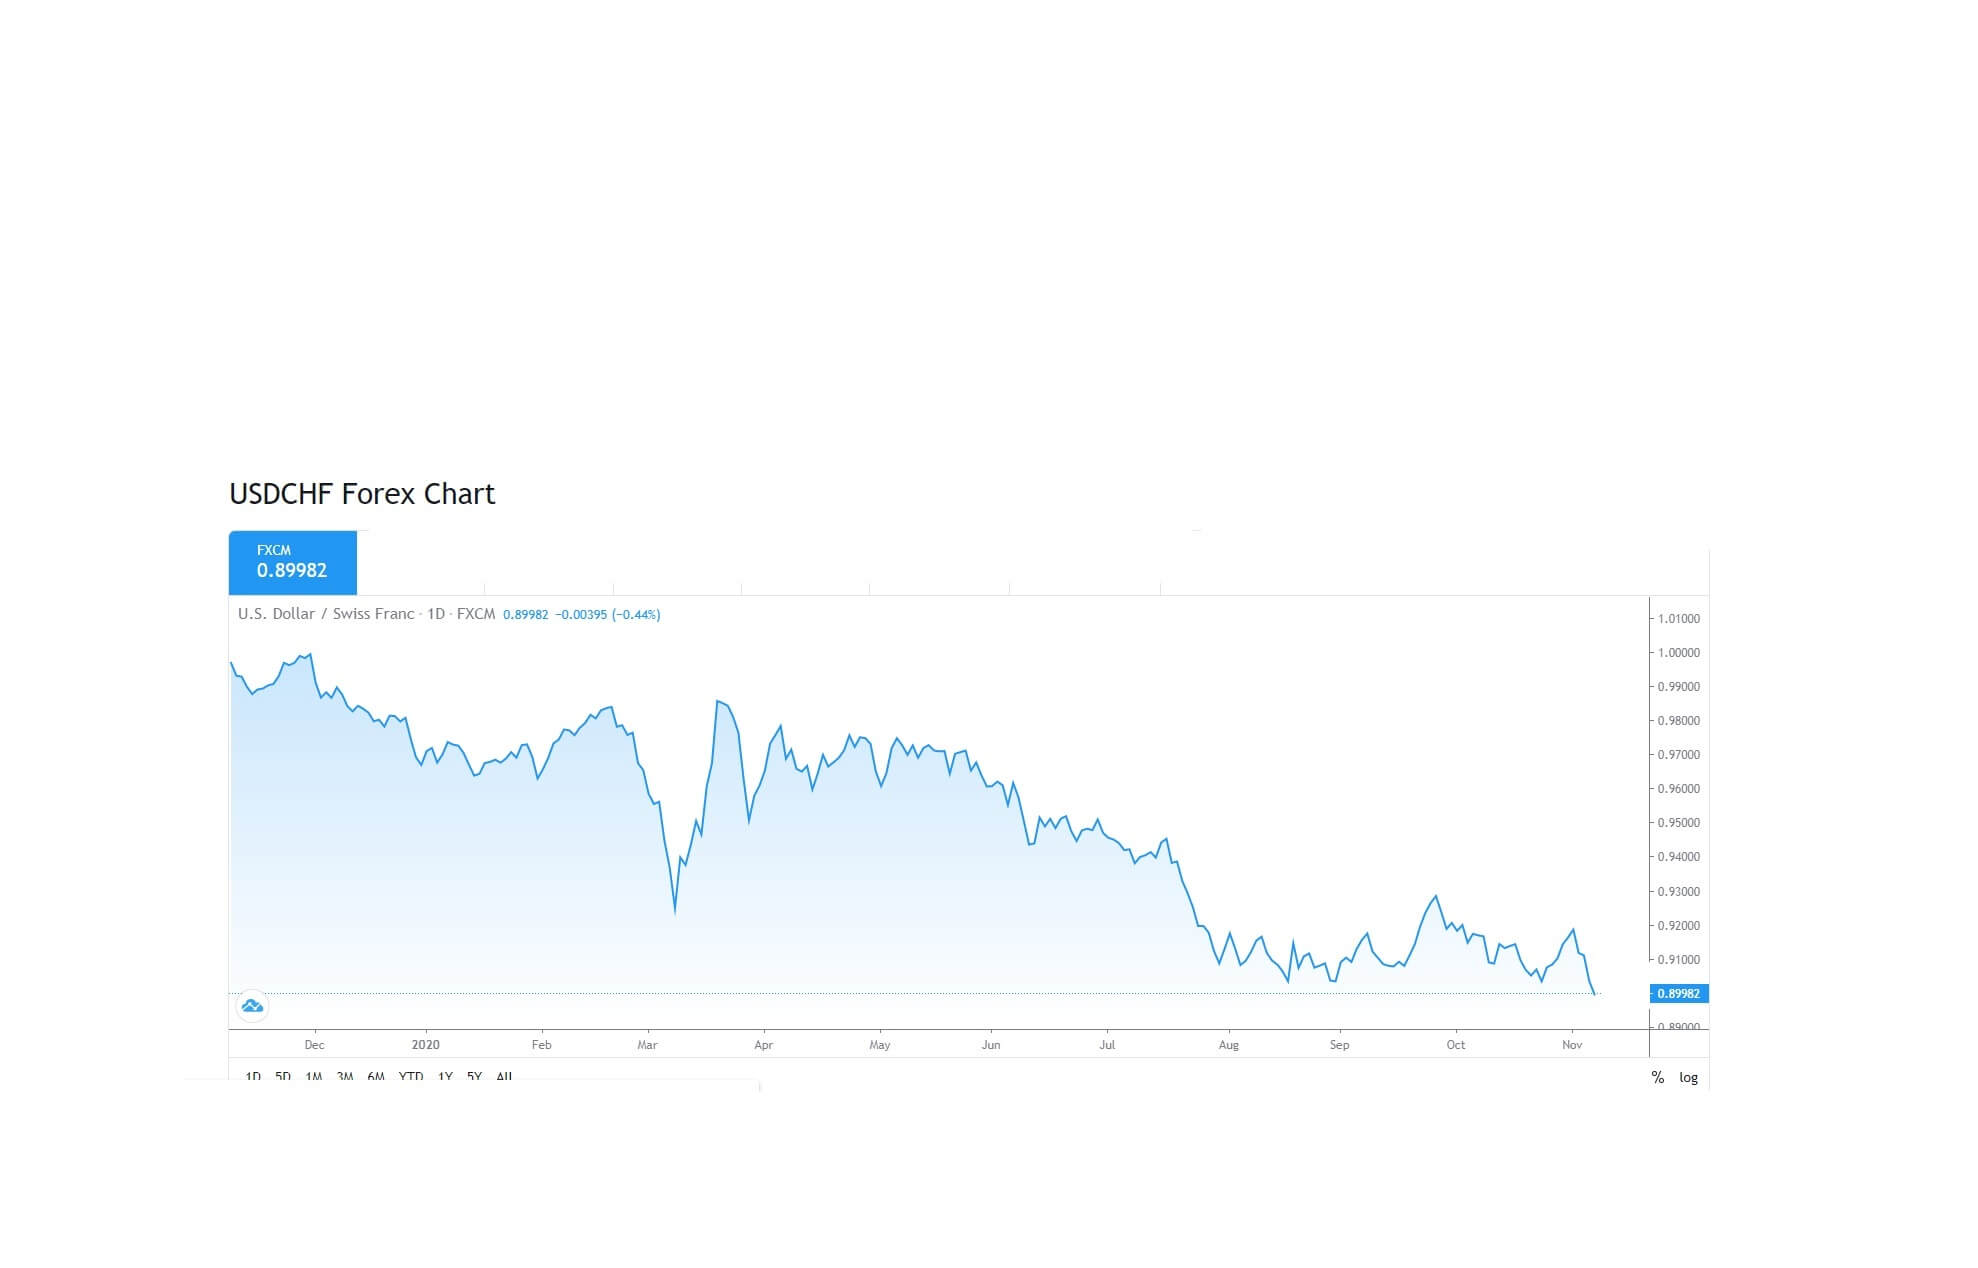
One of the biggest gainers against the Dollar has been the Swiss franc, where the USDCHF pair fell below the 0.900 level on Friday 6th November as the franc was being bought as a safe-haven asset. The last time the pair hit this level was in 2014.

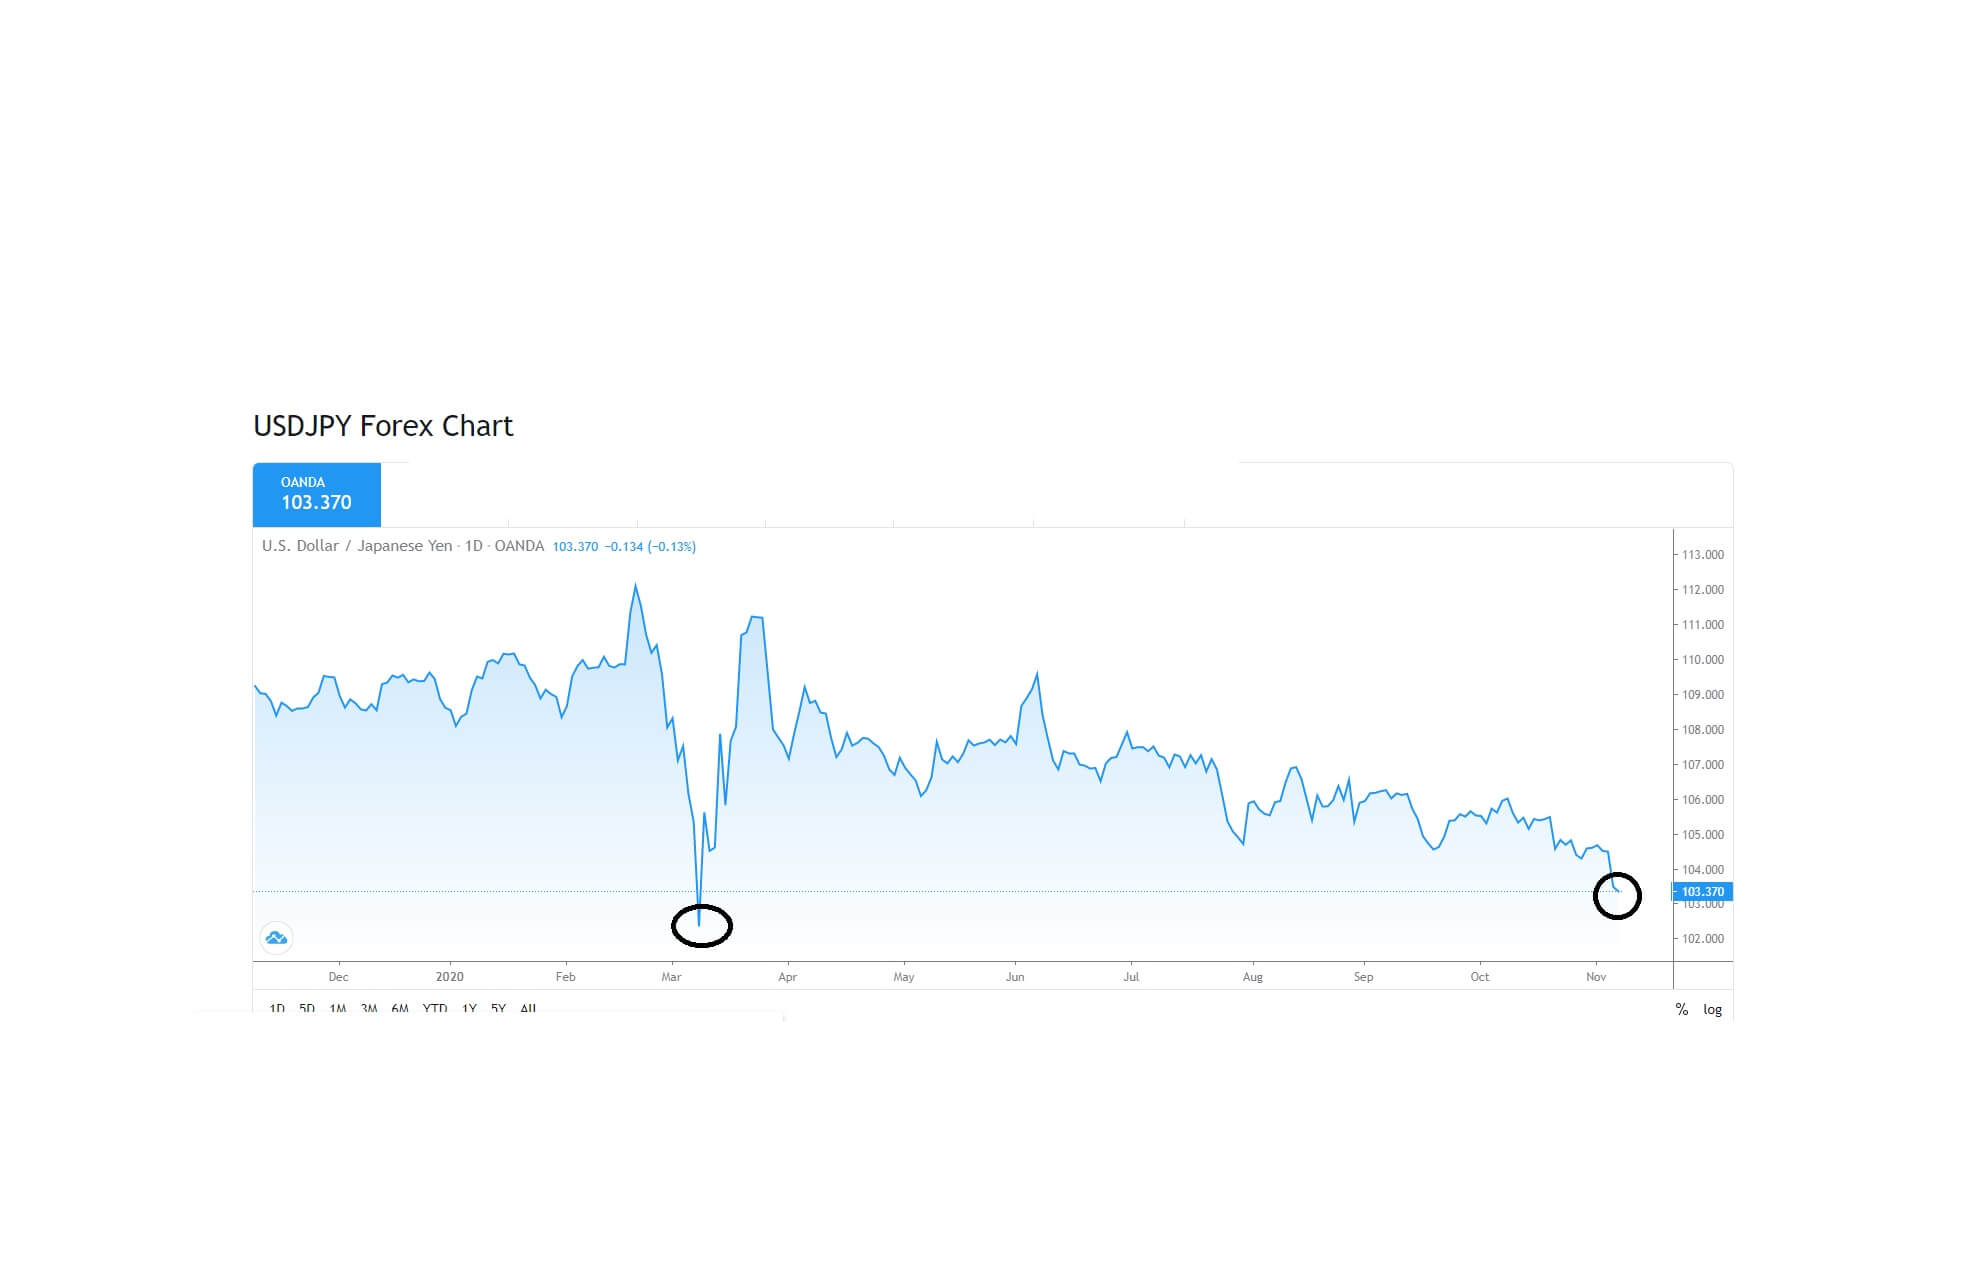
Another asset that is bought in times of uncertainty is the Japanese yen. Here we can see that also on the 6th of November, the USDJPY currency pair fell below the key 104.00 level to reach 103.37, and analysts will be looking to the low in March of this year where the pair fell below the 102.00 level and possibly a test of the 101.00 exchange rate.

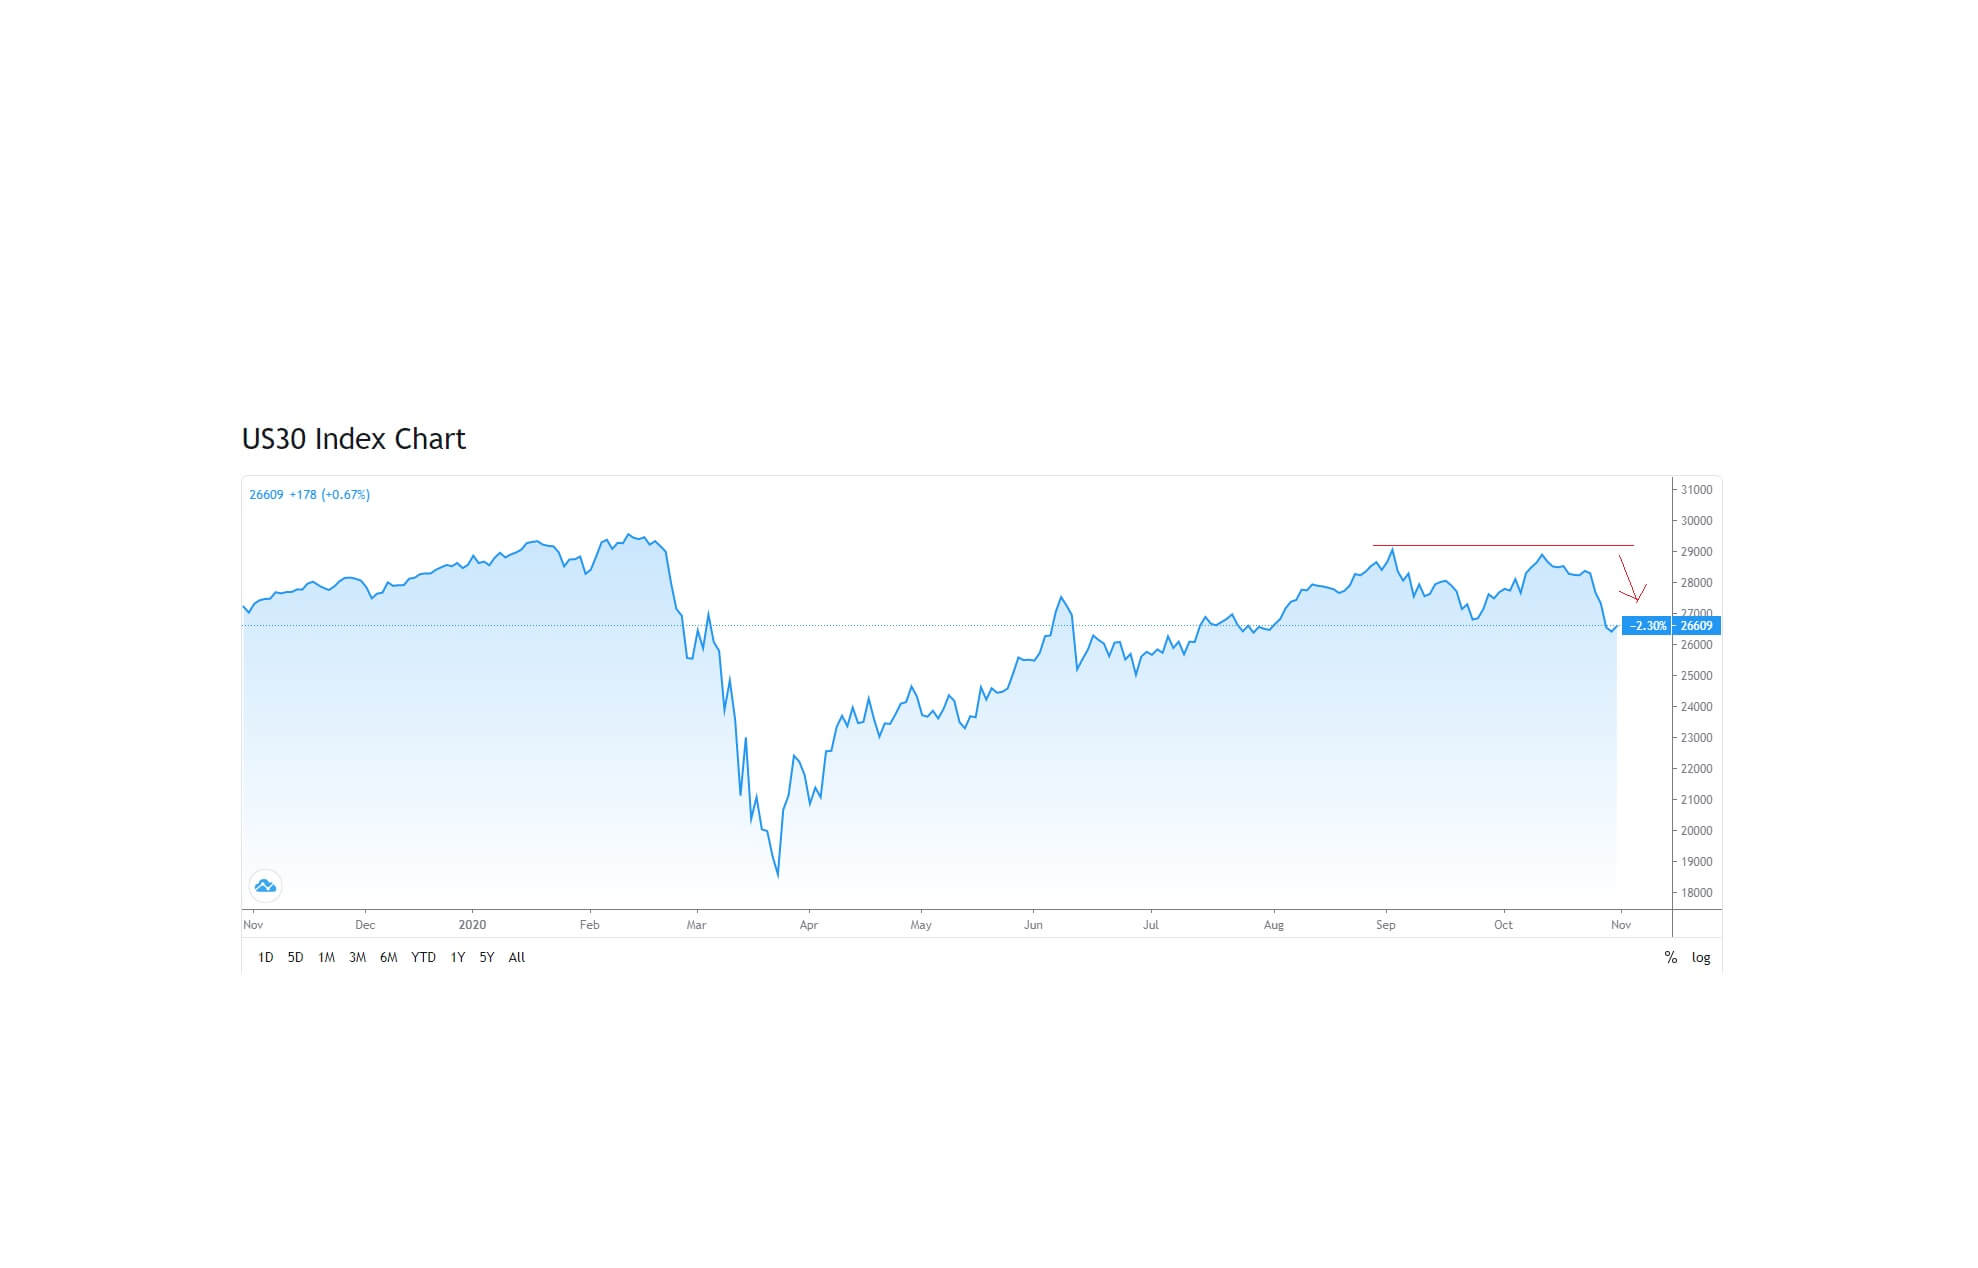
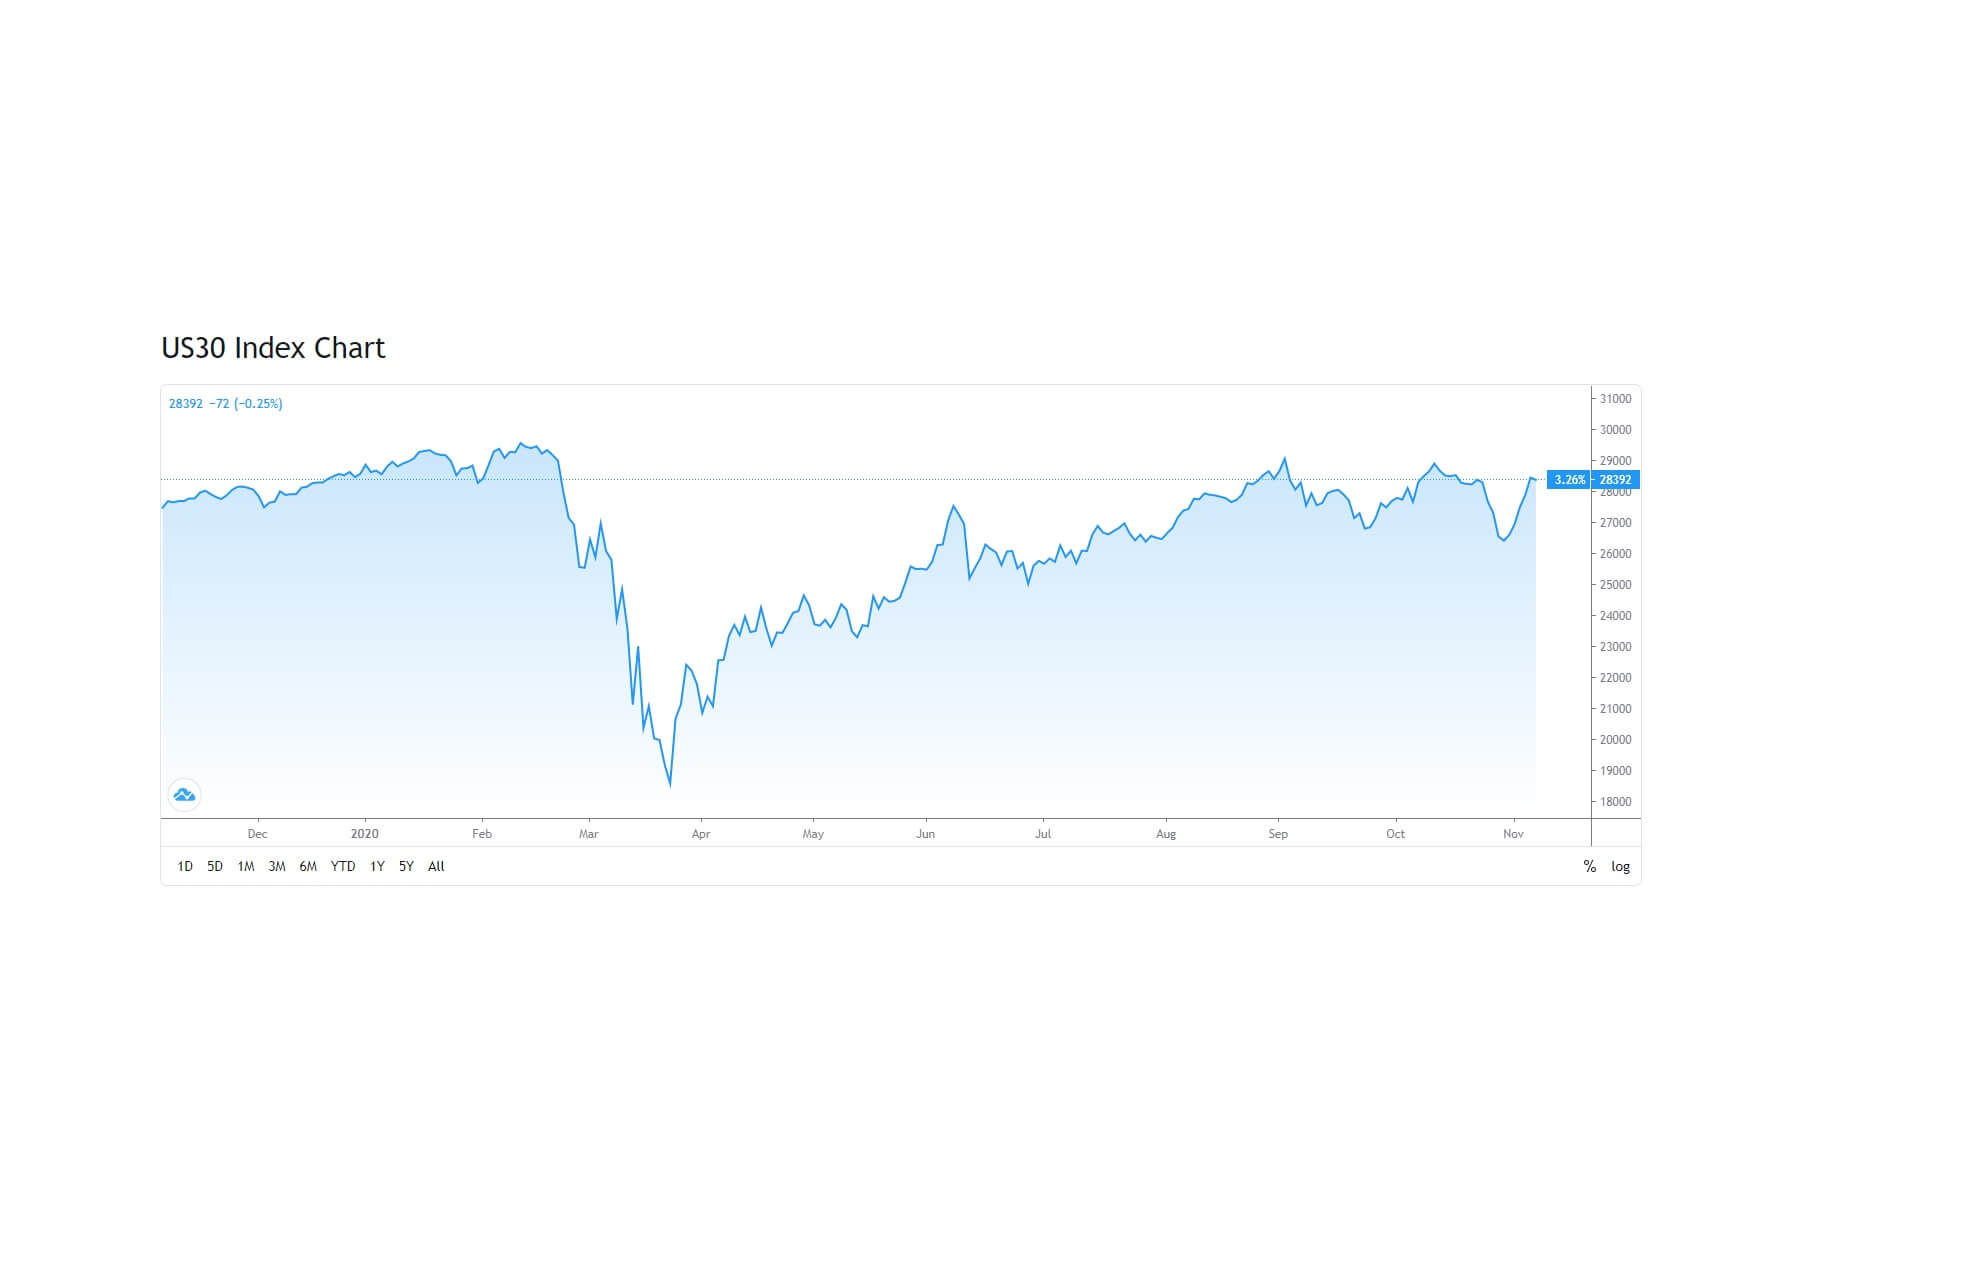
And while the euro and pound have also made gains against the United States dollar, the Dow Jones 30 industrial index has flattened just above 28,000, as buyers try to figure out the actual winner of the presidential election, which as mentioned looks very much like Joe Biden, and what the democratic policies are likely to do for the American economy as previously stated.
Extreme volatility has prevailed over the last few weeks, and that is likely to do so in the following days and weeks until whoever actually wins the next president of the United States.
Longer-term, the markets will be looking at Democratic policies if they officially win the election and be looking for them, will they, won’t they, covid stimulus package to be agreed upon by the Democrats and Republicans.

Categories
Forex Market Analysis Forex Videos

Forex & The US Presidential Election – How To Trade Biden VS Trump!

The US Presidential Election – what to expect from the Forex space?

Thank you for joining this Forex academy educational video. In this session, we will be looking at the upcoming US Presidential Election and what could happen in the Forex space in the run up to it and after the winner is announced.

It is a time of uncertainty in the global financial markets, with many Western countries seeing a second wave of the coronavirus, with massive unemployment and peaks and troughs in global gross domestic product, where no sooner can an economy begin to get back on its feet than a second lockdown offers the prospect of greater unemployment, more economic uncertainty and whereby governments are required to bail out their citizens and businesses with vast amounts of quantitative easing, which will see huge debt burdens emerge for generations to come.
Add to this the most contentious US presidential election ever, and it can only mean one thing: uncertainty. And traders and investors, including institutions, do not like uncertainty. It means that they have to diversify their portfolios in order to mitigate against risk.

The basic premise is that should Donald Trump managed to secure a second term in office, he has pledged to continue with the corporate reforms, and he has promised and to continue easing taxes. Whereas Joe Biden has promised to raise corporate taxes, and where he will undoubtedly increase liability on corporations with regard to further reforms and red tape, which has the effect of strangling the performance of the business. Not what you need in times like these.

Before the pandemic took hold in the United States, President Donald Trump was riding high with record-breaking high levels of employment, and record-breaking values in stock markets, largely because of his tax and corporate red tape roll backs and reforms. The investors loved him. He was undoubtedly one of the most successful presidents of all times in terms of the economic performance of the USA.

Fast forward a few months, and he could potentially go down as one of the worst presidents, and this has largely been down to what has been termed by many journalists, economists, and analysts, as well as great swathes of the population in the United States, has having lost grip of the pandemic to the point that he wilfully ignored the damage that it could do in terms of health to its citizens and to the health of the economy.

The polls suggest that he will pay the price and lose the election to Joe Biden.

And because we may see higher taxation and a rollback of reformed policies should Joe Biden become the next president of the United States, this is why we are seeing a pull-back in the US equities markets, and here we can see that the Dow Jones industrial average of the 30 leading companies had made incredible rebounds from the lows of middle of March when the pandemic really hit America hard, add where we almost saw a 100% rebound of the record-breaking high from February of over 29,000 for the index, on the basis that the market believed that the US federal reserve bank was handling the coronavirus well in terms of its interest rate policy and the amount of stimulus being offered by the government and hopes that a vaccine would quickly help the US to recover to pre-crisis levels and beyond.

In this yearly US dollar index chart, which measures the value of the US dollar against the most other widely traded currencies, the so-called majors, including the yen, euro, pound, Swiss franc, and Australian and New Zealand dollars, we can see that it found support at 92.00 in September, after heavily losing out against the majors, and more recently found support at 93.00 before pushing above 94.00. This is what we might expect as the US dollar has often been bought as a safe haven asset in uncertain times, and while the markets try to determine the amount of risk of the unknown, which is what would happen if Joe Biden and the Democrats took power. The dollar is also being bought and stocks sold because the democrats and republicans have not yet been able to reach an agreement on a much-needed extension to the financial stimulus aid package to help keep American firms and the public afloat.
Therefore, no stimulus deal could possibly now be agreed until after the elections, which will lead to more uncertainly, therefore more of the same for stocks and the dollar.
But if Donald Trump is elected for a second term, stocks should rally, and this might have the effect of a stronger US dollar and softer counter currencies, including the majors, perhaps with the exception of the British pound, but only in the event that the UK and EU manage to secure a free trade deal, and also perhaps with the exception to the New Zealand dollar, which is currently being very resilient to the recent upswing in the US dollar.
But if Joe Biden takes power, we would highly likely see extreme market volatility in all financial assets and where the fear of the unknown would offer no real directional bias for the markets in the short term. We also should look at the possibility that even if Biden swept to power, the markets might believe that he could handle the pandemic better than Trump, be less provocative to foreign powers – which could help investment in the USA – and this might also bring back investors into the equities space as a direct result. With the democrats then holding all the aces in Congress, a stimulus deal would be more likely to get through more quickly, and more stimulus should, theoretically, mean a softer US dollar, in which case traders will be looking for opportunities to short it against the majors in particular.
One thing is for certain; the markets are in for a bumpy ride. Traders, be warned.

Categories
Forex Market Analysis

How Elliott Wave View of NASDAQ Anticipates Trump’s Coronavirus Outcome

Overview

The NASDAQ 100 Index fell 2.2 percent on Friday’s trading session on the news of the US President Donald Trump’s positive coronavirus test. Still, the price action unveiled the wave B completion, suggests further declines for the US technologic benchmark in the following trading sessions.

Market Sentiment Overview

During the last trading week, the NASDAQ 100 volatility has been driven by market participants’ expectations facing the first presidential debate between US President Donald Trump and former Vice President Joe Biden.

The advance experienced by the technology index was boosted by the expectation of new economic stimulus, driving the NASDAQ 100 to raise over 4%. However, its gains were lowered after the announcement of President Trump’s positive Coronavirus test, leading it to ease up to 2.74% on Friday’s trading session.

The following 8-hour chart of NASDAQ 100 reflects the 90 days high and low range. In the figure, we distinguish that the price halted its advance towards the extreme bullish sentiment zone, closing the trading week in the bullish market sentiment area and under the weighted 200-day moving average. This market context leads us to weight a neutral market sentiment.

On the other hand, the 12-hour chart corresponding to the NASDAQ 100 Volatility Index shows the 90 days high and low range where we distinguish a sideways movement consolidating above the 200-period weighted moving average. This volatility context of the NASDAQ 100 index, added to the new test of the upper-line of the consolidation structure, leads us to expect an increase in volatility within the coming trading sessions.

Summarizing, NASDAQ 100’s market sentiment unveils that this index and its volatility figures will be driven by the news on the upcoming presidential elections on Tuesday, November 03. In particular, NASDAQ 100 could turn bearish in the following trading sessions.

Elliott Wave Outlook

The overview of NASDAQ 100 shows the full development of a five-wave bullish sequence, which began on June 15, when the price found fresh buyers at 9,383.6 pts pushing the price towards new record highs September 02 at 12,466.6 pts. Once reached the all-time high, the technological index began to perform a bearish corrective movement, which remains in progress.

The following chart shows the NASDAQ 100 in its 4-hour timeframe, where we distinguish that the price has completed a five-wave impulsive structure of Minor degree labeled green. At the same time, we can confirm that the Elliott wave theory rule, stating that there must be only one extended wave. In this case, the NASDAQ 100 index developed a fifth extended wave that ended on September 02 when the price found resistance at 12,466.6 pts. Once the fifth wave of Minor degree concluded, the NASDAQ 100 began performing a corrective sequence, which remains in progress.

In particular, the completion of the wave ((c)) of Minute degree identified in black, which completed the wave B of Minor degree, coincided with the news media release concerning the US President Trump’s positive test, activating the beginning of the wave C, labeled in green.

The following hourly chart of NASDAQ 100 illustrates the first bearish movement’s internal structure corresponding to its wave (i) of the Minuette degree identified in blue. This first downward wave reveals a drop in five moves of Subminuette degree identified in green in its internal formation. Once this second move has been completed, the technological benchmark should resume its declines.

Finally, considering that wave (i) of Minuette degree completed its descending move at 11,220.8 pts on Friday 02nd, the price could retrace, forming its second wave of the same degree. In terms of the Dow Theory, this retrace could be between 33% and 66%, or between the 11,352.3 pts and 11,483.7 pts, where NASDAQ 100 might start to develop a new decline, corresponding to wave (iii) in blue.