
The GBPJPY cross continues moving in an incomplete long-term sideways corrective pattern of Intermediate degree that remains active since the price found support at 124.786 in early October 2016. The Elliott wave sequence in progress suggests the possibility of a new decline for the coming trading sessions.

Technical Overview
The following figure illustrates the GBPJPY cross in its 2-day range, developing a sideways formation of Intermediate degree labeled in blue, which could correspond to an incomplete, irregular flat pattern (3-3-5). This Elliott wave formation began in early October 2016 when the price found support at 124.786 and rallied until 156.608 reached in early February 2018 when the price completed its wave (A) identified in blue.
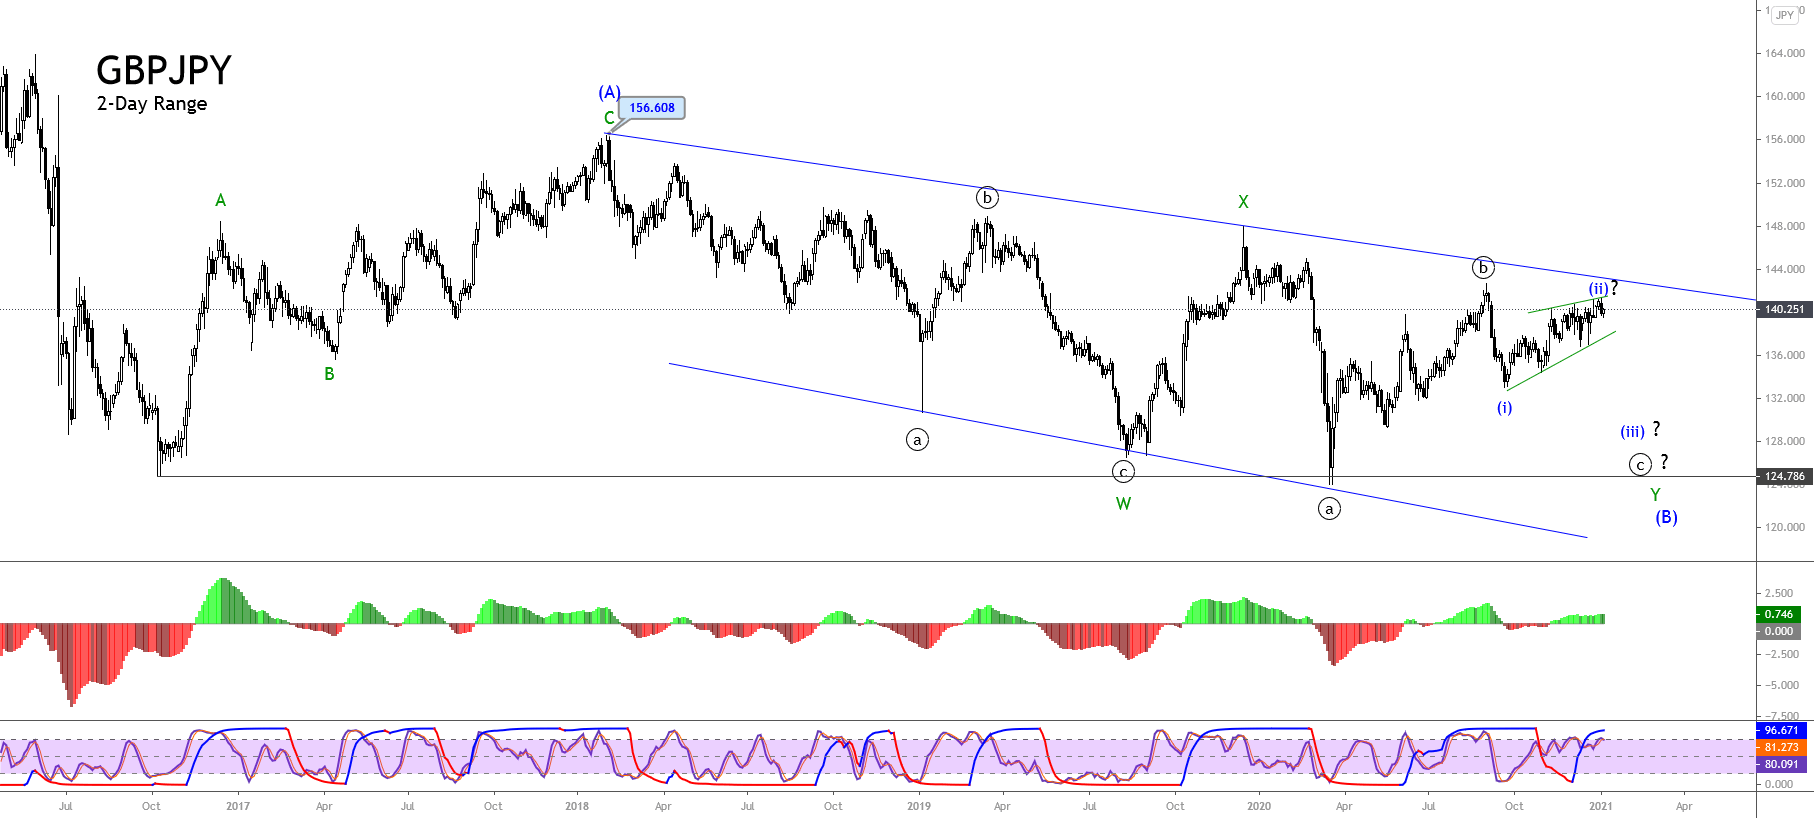
The previous chart exposes the downward advance of wave (B) in blue, which began once the cross topped at 156.608. In this context, wave (B) internal structure seems like a double-three pattern of Minor degree labeled in green, which currently advances in its wave Y.
Likewise, the lower degree sequence shows the progress in its incomplete wave ((c)) of Minute degree identified in black, which began in early September 2020 when the price found fresh sellers at 142.714.
According to the textbook, the wave ((c)) in progress should follow an internal sequence subdivided into five waves. In this context, the lower degree structure of GBPJPY might move in its second wave (ii) of Minuette degree labeled in blue. Thus, completing this corrective rally should give way to a new decline corresponding to wave (iii).
Technical Outlook
The next 12-hour chart shows the GBPJPY advancing in the wave c of Subminuette degree labeled in green inside the corrective rally corresponding to wave (ii) in blue. The completion of this corrective formation could correspond to an incomplete ending diagonal pattern suggesting a new decline.
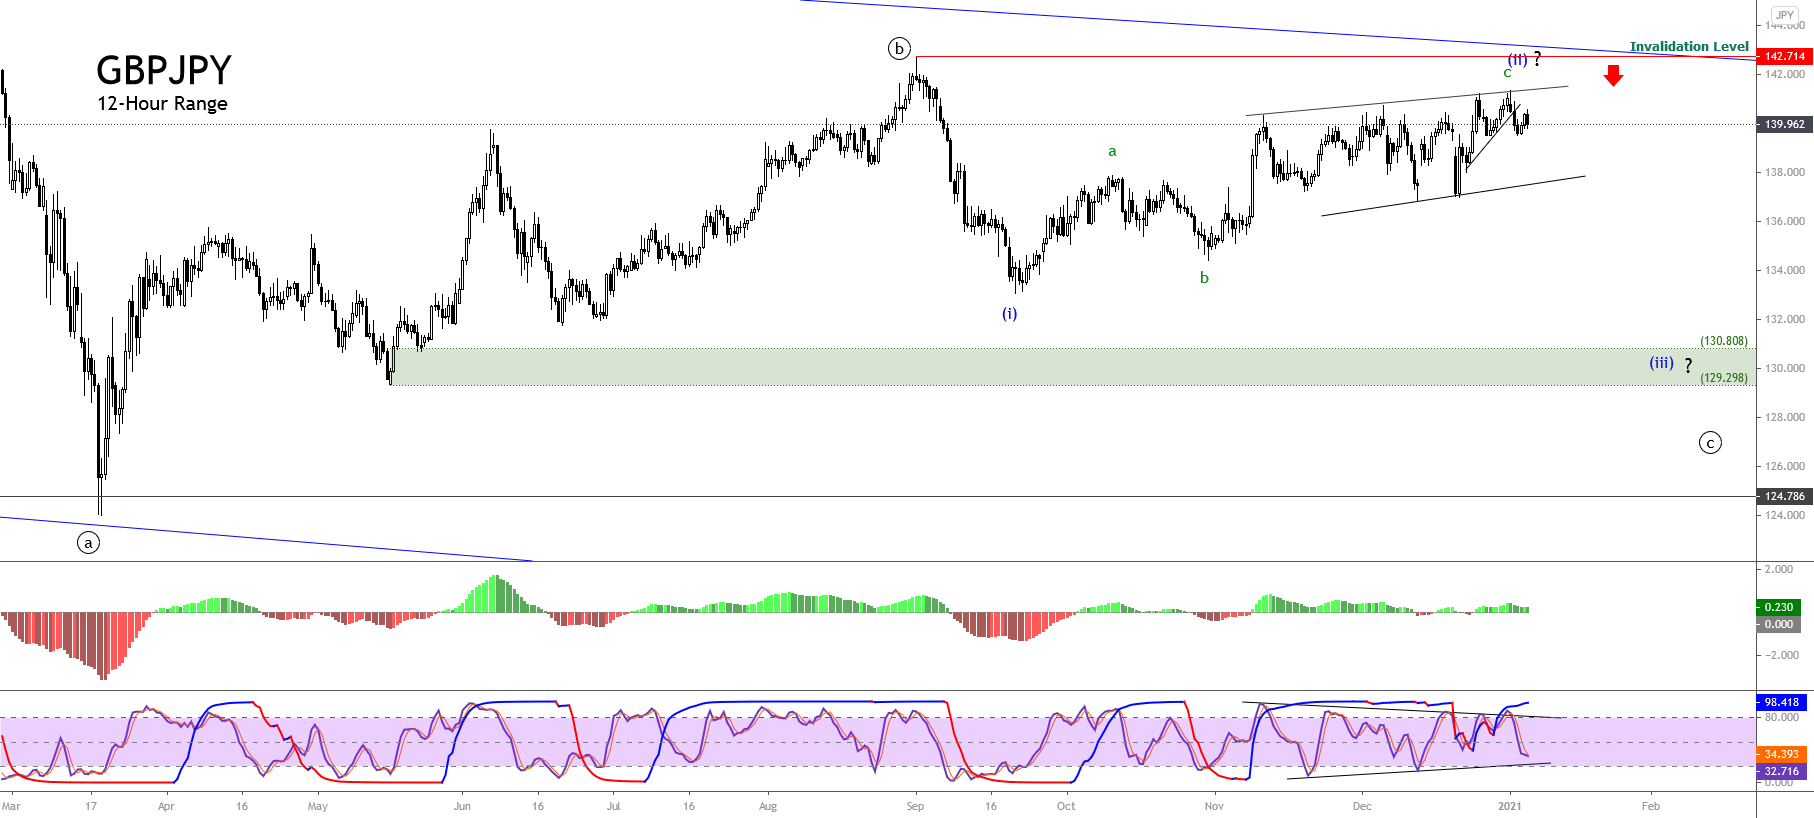
The new decline’s potential bearish target corresponding to wave (iii) in blue locates in the demand zone between 130.808 and 129.298. On the other hand, the downward scenario’s invalidation finds at the top of the wave (i) at 142.714, corresponding to the last September 01st high.
In summary, the GBPJPY cross advances in an incomplete sideways corrective formation, which its internal structure suggests the progress in a complex double-three pattern. The lower degree structure exposes the advance of wave (ii), which seems incomplete. In this regard, the ascending base-line breakdown should confirm the potential next decline, which has a potential target the demand zone located between 130.808 and 129.298. Finally, the bearish scenario forecasted will be invalid if the price surpasses and closes above 142.714.