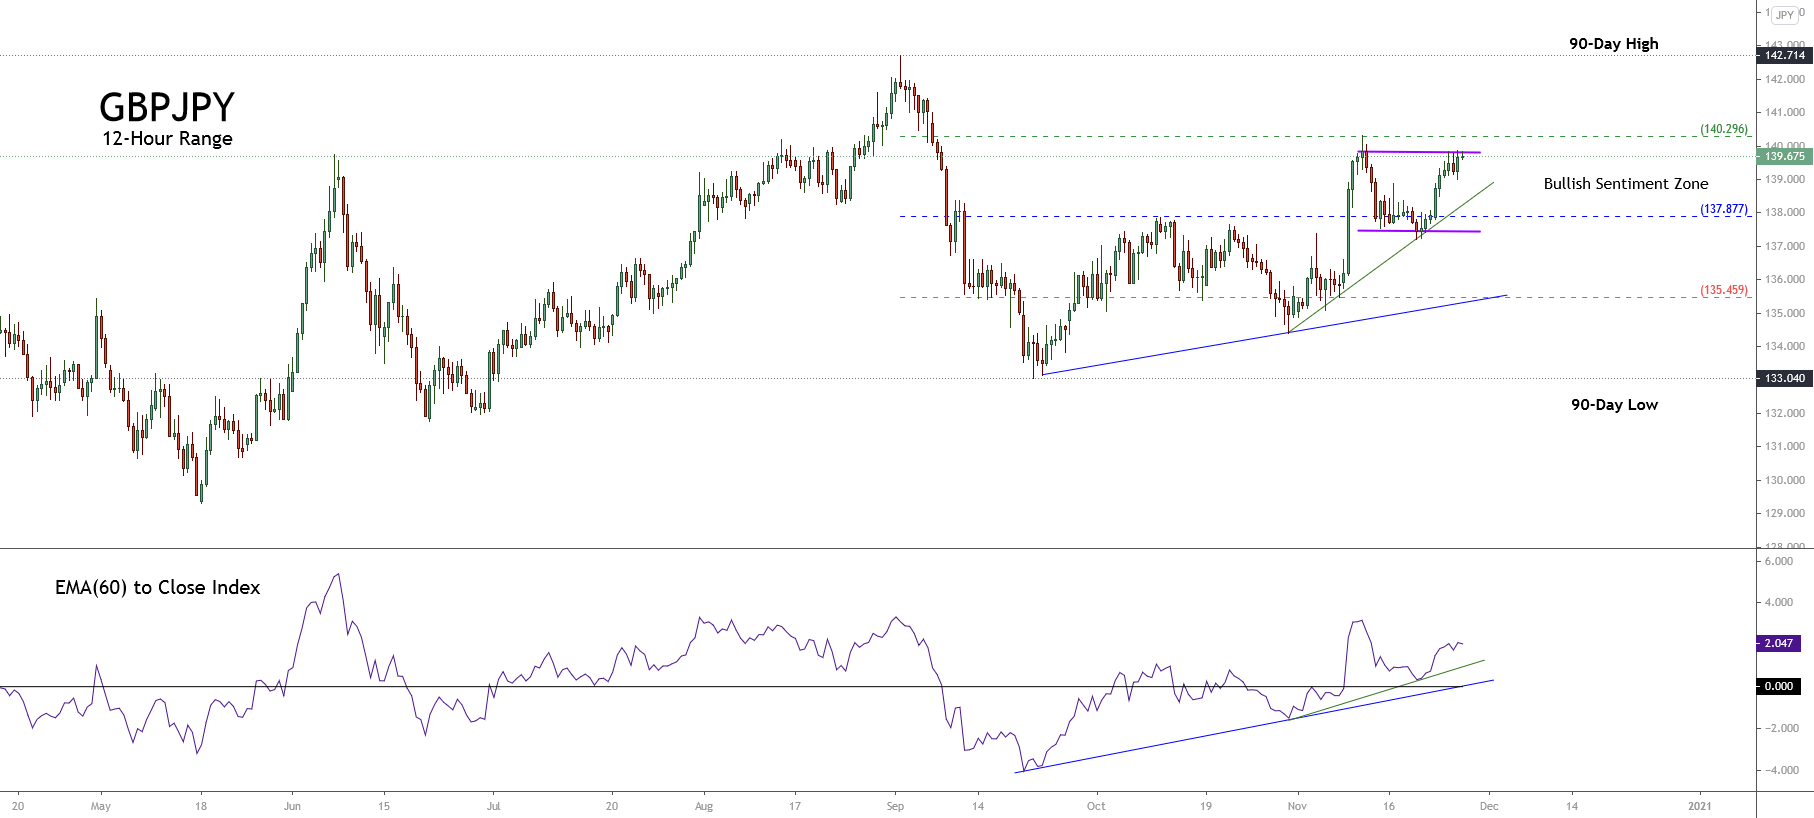
The short-term overview for the GBPJPY pair reveals the sideways movement in a trading range bounded by its 90-day high and low range between levels of 133.040 and 142.714. The cross recently developed a rally that found resistance in the bullish sentiment zone resistance located on 140.296, where the GBPJPY presents a set of scenarios.
Technical Overview
The following 12-hour chart illustrates the short-term market participants’ sentiment bounded by the 90-day high and low range. The figure presents a bullish bias that remains active since the GBPJPY found fresh buyers on 133.040.
After the cross found resistance at 140.296, the price action retraced it until a neutral zone located on 137.877, forming an intraday sideways channel that suggests a pause in the short-term bullish cycle.
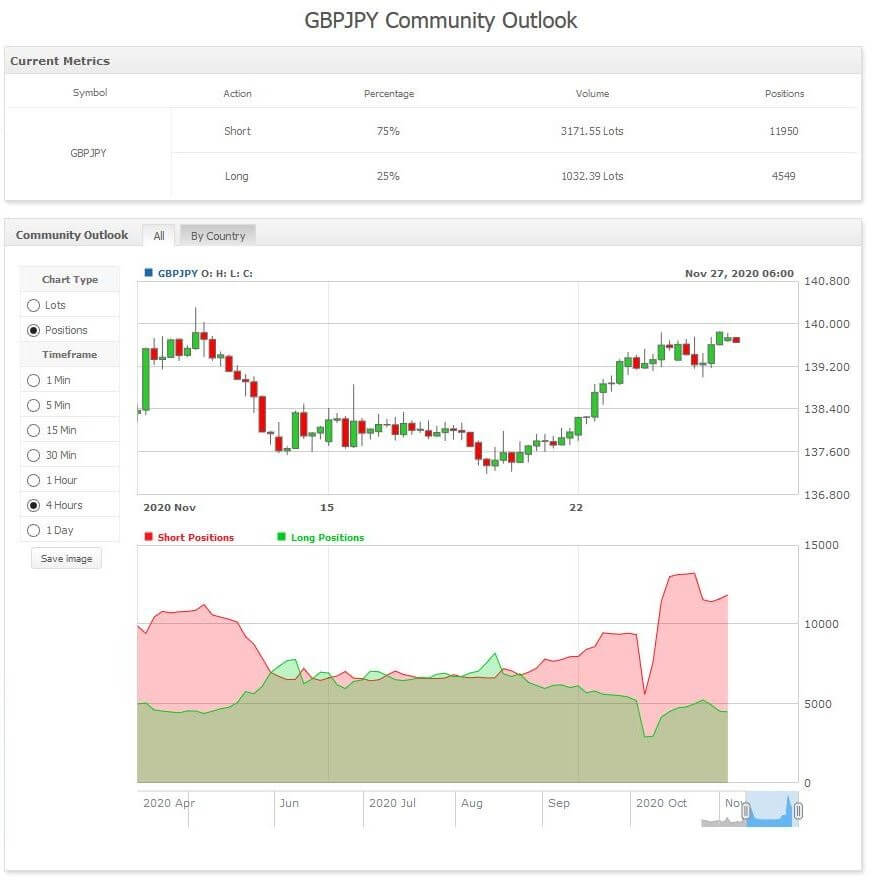
On the other hand, the following figure unveils that the retail traders’ market sentiment is positioned on the bearish side. As the chart shows, 75% of retail traders hold their positioning on the sell-side, which is contrarian.
 (source: myfxbook.com)
In this context, we can see that numerous retail traders are expecting a downward movement, while the price action remains moving in the bullish sentiment without exposing a reversal pattern. Thus, it is plausible the GBPJPY pair could develop a new upward movement.
Short-term Technical Outlook
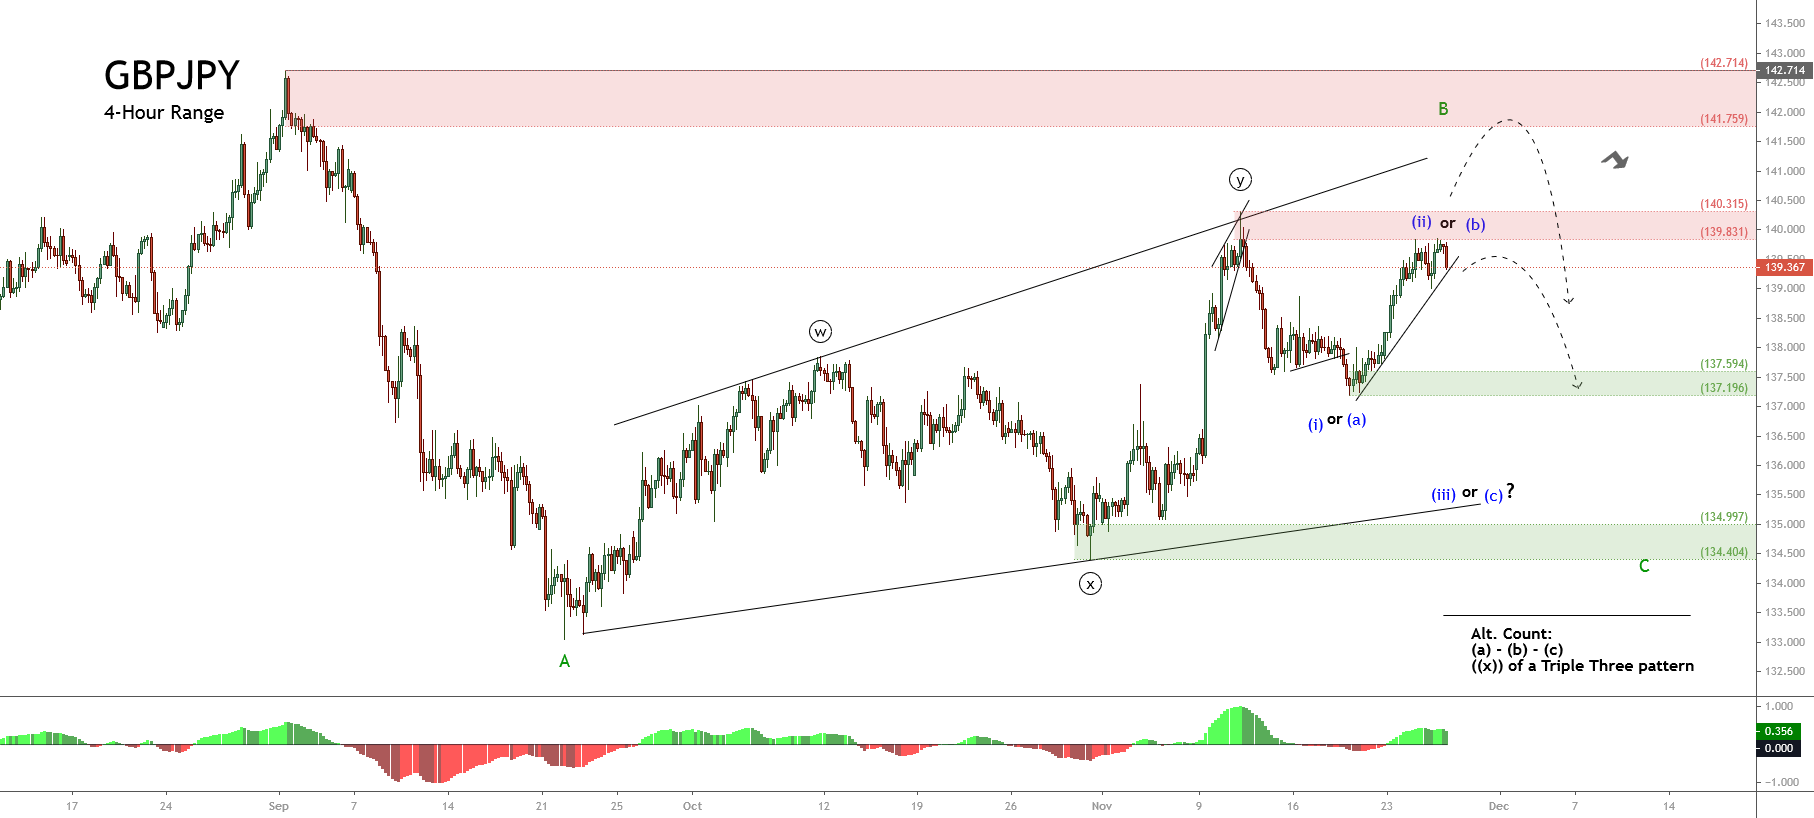
The short-term Elliott Wave view shows a movement inside an incomplete corrective wave of Minor degree, labeled in green, which could be in its wave C.
The following chart shows the price action developing an upward corrective rally, which could correspond to a wave (ii) or (b) of Minute degree identified in green. In this context, the following movement should correspond to wave (iii) or (c).
Under this scenario, if the supply zone between 139.831 and 140.315 confirms the end of the current second segment, in blue, GBPJPY should begin a decline to the first demand zone between 137.594 and 137.196. Moreover, the market action could extend its down move toward the next demand zone between 134.997 and 134.404.
An alternative scenario considers the possibility of the price extending its advance beyond the 140.315 level. In this case, the GBPJPY could find fresh sellers in the next supply zone between 141.759 and 142.714. The pair could complete its wave B in green and start to weaken, developing the wave C subdivided into a five-wave sequence with a potential target in the demand zones identified in green.
Finally, the invalidation level of the bearish scenario is set above the origin of wave A in green at 142.714


