
Overview
The Hang Seng Index continues advancing mostly sideways in an incomplete bearish sequence, corresponding to a flat pattern sequence, still in progress. Once the current corrective formation ends, the Chinese benchmark will likely start developing a new long-term bullish cycle.
Market Sentiment Overview
The Chinese benchmark Hang Seng Index (HSI) shows a drop of over 12% (YTD). However, even when it has recovered 16 percent from the lows reached after the massive sell-off occurred during the first quarter of the year, the market sentiment of the Chinese benchmark index continues dominated by the bearish side.
In the following Hang Seng’s daily chart, we can spot its 90-day high-low range. The figure exposes the index developing in a sideways movement happening since the second quarter of the year. On the other hand, the rejection of the 24,953.4 points suggests that the mid-term market sentiment is slightly bearish.
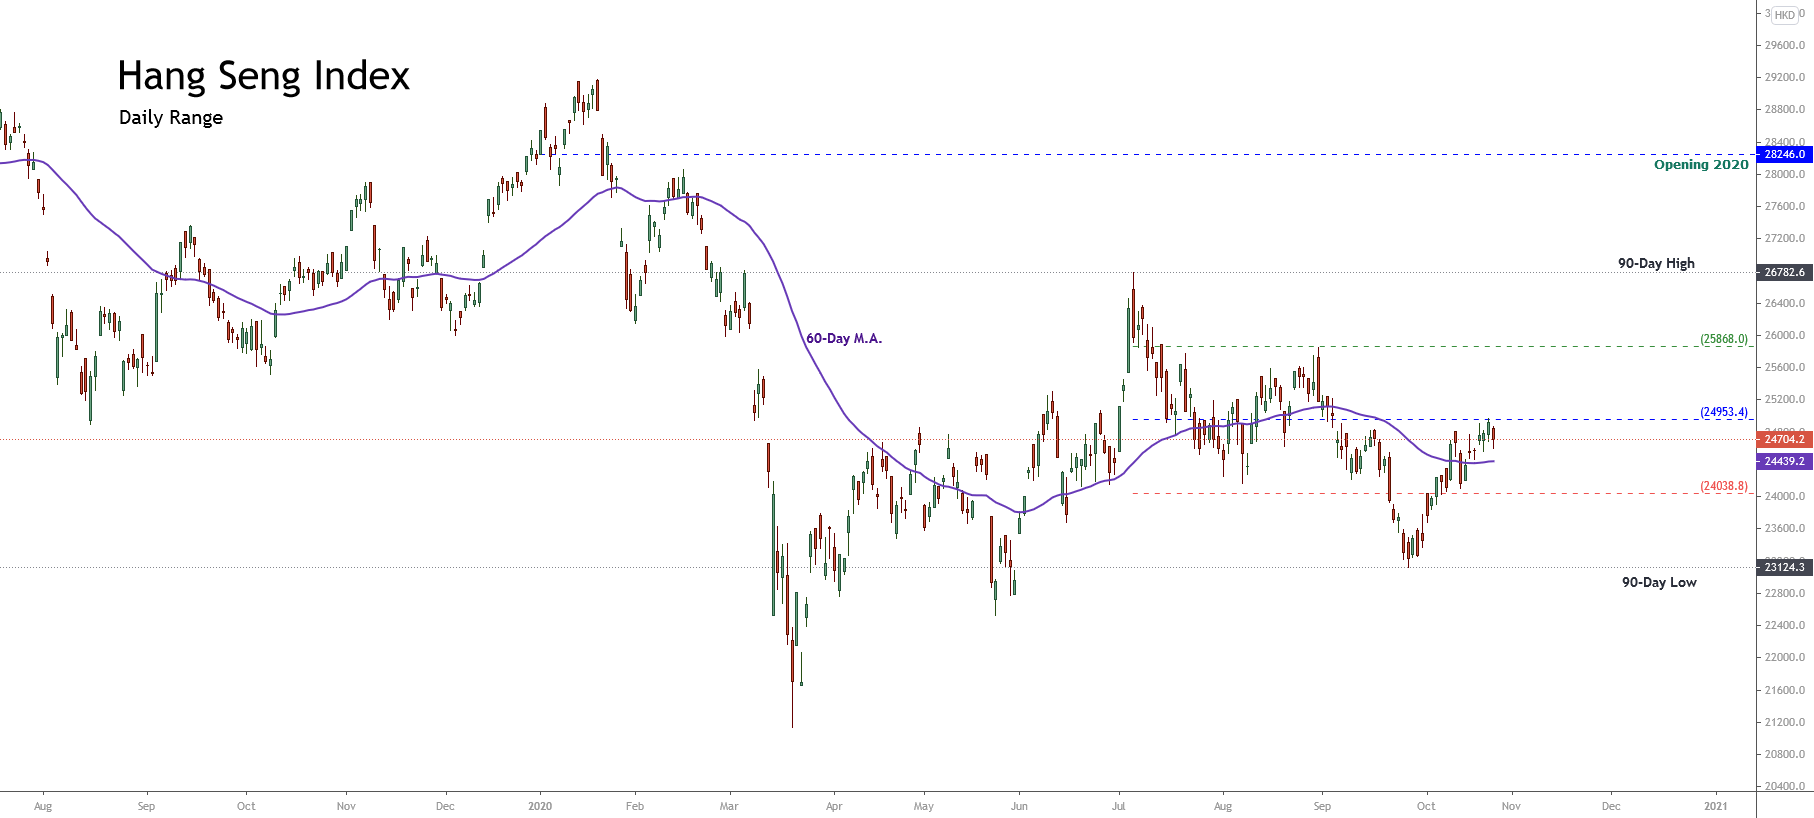
Besides, considering that the Hang Seng Index moves on the 60-day weighted moving average, a short-term upward pressure is observed.
In conclusion, the Chinese benchmark’s market sentiment seems neutral, waiting for the price action to unveil the next trend’s direction.
Elliott Wave Outlook
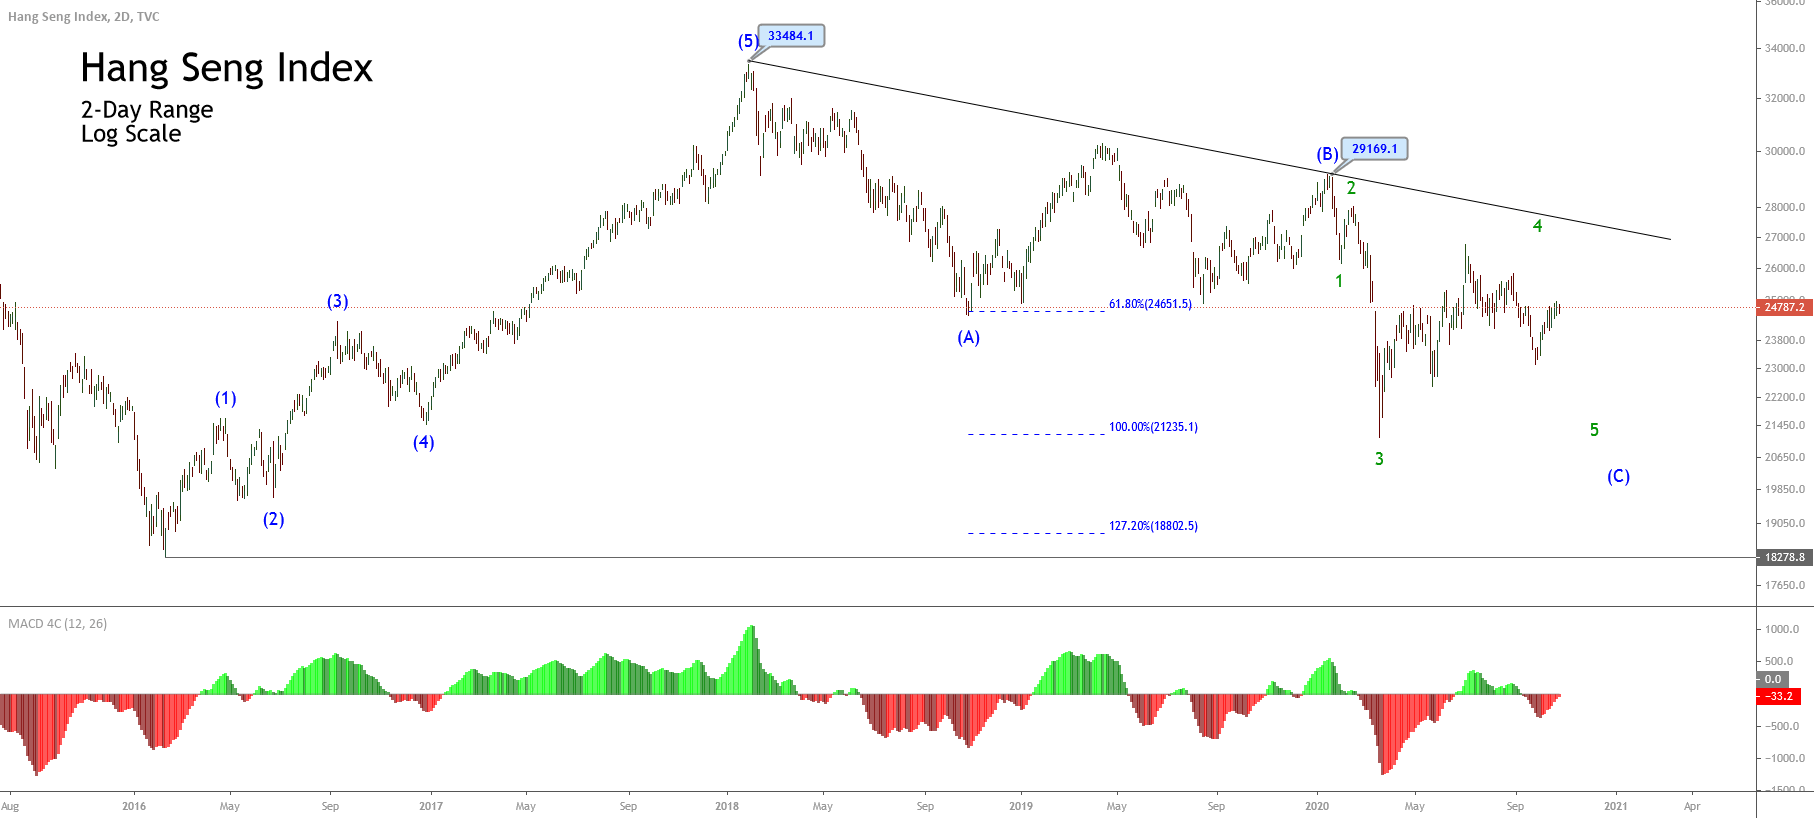
Under an Elliott Wave perspective, Hang Seng’s big picture reveals the incomplete corrective movement from the end of a bullish cycle the Hang Seng Index initiated in mid-February 2016 from 18,278.8 pts. This bullish sequence ended its five-wave structural series when the Chinese benchmark reached its all-time high of 33,484.1 pts in late January 2018.
The next figure illustrates the HSI log chart on a 2-day timeframe. The price pattern reveals the Chinese benchmark moving mostly bearish on its wave (C) of intermediate degree labeled in blue, which seems incomplete. In this context, although HSI reached the minimum requirement for this movement: 100% of equal waves between waves A and C, the internal structure of its C wave is unfinished.
The following 4-hour chart exposes the internal structure of wave 4. We distinguish that the corrective structure has created two Minute degree segments, labeled in black on the figure. Considering that each leg follows an internal sequence subdivided into three waves, the Elliott Wave Theory leads us to expect its progression on a regular flat pattern.

On the other hand, short-term, the Hang Seng Index could develop a new upward movement subdivided into a five-wave sequence, which should complete the ((c)) wave of Minute degree labeled in black. Once this move ends, the Chinese benchmark could develop a new decline corresponding to a wave 5 of Minor degree, which should complete the (C) wave of Intermediate degree.
Finally, considering that the third wave of Minor degree labeled in green was the extended move, and considering the amplitude of wave 4, the fifth wave of Minor degree should not penetrate below the low of wave 3 located at 21,139.3 pts. In other words, the wave (C) of Intermediate degree identified in blue is likely not to end below 21,139.3 pts.