We keep talking about support, resistance, and their levels. Sometimes we forget that it is not only about the levels. A lot depends on their zones. No doubt, in the end, we are to calculate their levels at the time of taking an entry. However, we are to keep an eye at the zones where the price may create a new trend. In this article, we are going to demonstrate an example of that.
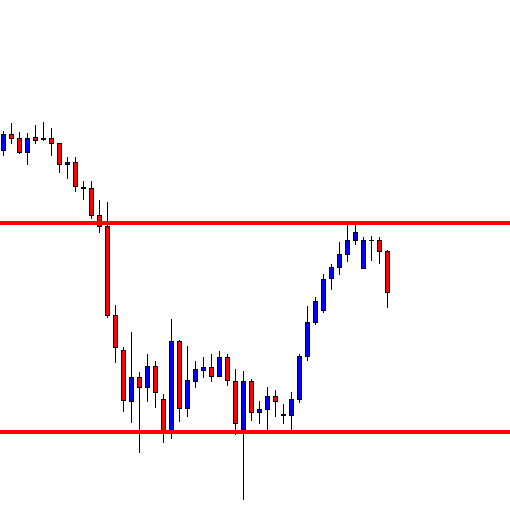
This is a daily chart. The chart shows that the price upon finding very strong support heads towards the upside. It may have found its resistance as well, which pushes the price towards the downside. Take note that the level of support is extremely strong, which creates a secure buying zone.
The price tried to find its support at the last swing high. However, it breaches the level and comes further down. It produces an Inside Bar. It looks good for the sellers so far. Let us proceed to the next chart to find out what the price does.

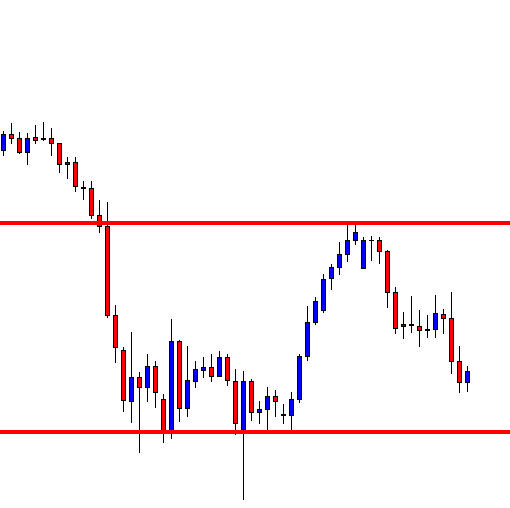
The price consolidates with several candles. Look at the last candle. This is an engulfing candle which states that buyers on the minor time frames are confident enough to push the price towards the North. The resistance is far enough. Thus the daily-H4 chart traders are to flip over to the H4 chart to find out a long opportunity.
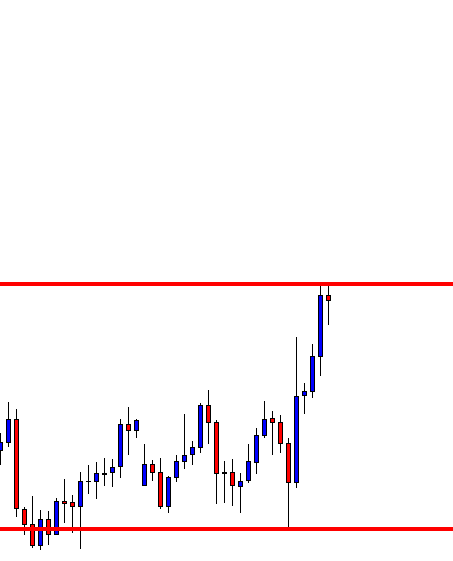
This is the H4 chart. The chart produces a Spinning Top. A bullish reversal candle, along with a breakout at the resistance, will be the signal to go long. Let us find out from the next chart whether it consolidates more or produces the bullish reversal candle.
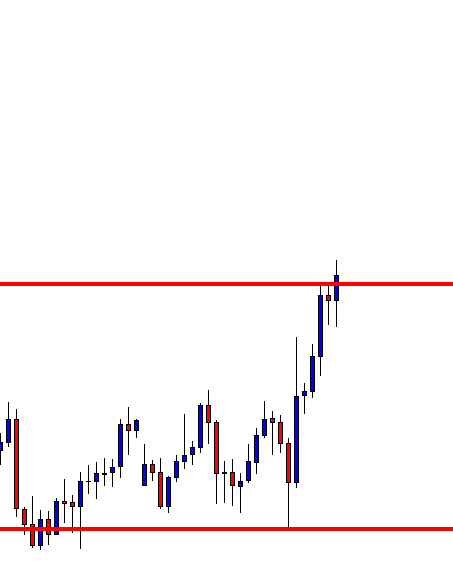
It produces an H4 bullish engulfing candle as the reversal candle. It has an upper wick, but the body looks good enough to attract the buyers. A long entry may be triggered right here. Let us find out how the price heads with the bull. Do not forget it may go another way around, as well.
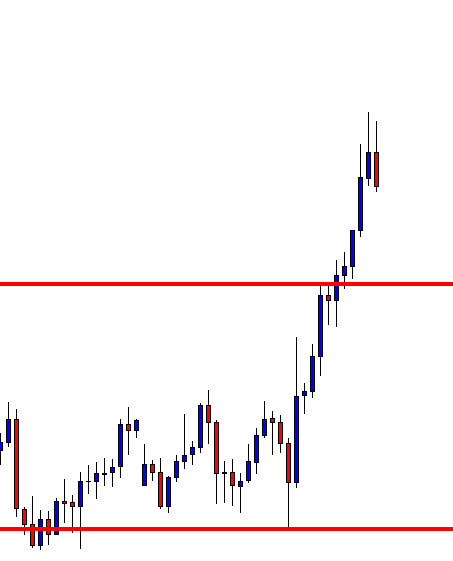
It goes towards the buyers’ desired direction. The buying pressure has been good as well. However, the last candle comes out as a bearish engulfing candle. It may be time for the buyers to close their entry.
The Bottom Line
We have demonstrated an example that the price creates a new trend, not right from the last level of support. It instead creates it from a support zone. Traders are to keep an eye on the price action around the support/resistance zone to be able to find out more entries.