Categories
Forex Course

195. Understanding The U.S. Dollar Index Numbers

Introduction

The U.S. Dollar Index is a measure of the value of the Dollar in respect to foreign currencies as measured by the respective exchange rates. More than half of the index value of the Dollar is measured against the Euro. The British Pound, the Japanese Yen, the Swedish Krona, the Canadian Dollar, and the Swiss Franc. It is a market on its own as well as an indicator of the U.S. dollar strength on a global level. Moreover, it can also be used as the technical analysis to determine trends of various markets.

How Is The US Dollar Index calculated?

Below is the formula to calculate USDX

USDX = 50.14348112 × EUR/USD^(-0.576) × USD/JPY^(0.136) × GBP/USD^(-0.119) × USD/CAD^(0.091) × USD/SEK^(0.042) × USD/CHF^(0.036)

Each currency value is multiplied by its weights. When the U.S. dollar is the base currency, this comes at a positive figure. On the other hand, when the U.S. dollar is used as the quoted currency; then this would come as a negative value. Additionally, pounds and euros are only countries where the U.S. dollar is used as the base currency as they are quoted in respect of the Dollar.

How To Interpret the U.S. Dollar Index?

Similar to any currency pair, there is a dedicated chart of the U.S. Dollar Index (USDX). Additionally, the index is calculated five days a week and 24 hours a day. The U.S. Dollar Index measures the value relative to a 100.000 base.

If the index value stands at 120, this means that the U.S. dollar has witnessed 20% appreciations against other currencies in the basket. This simply implies that the U.S. dollar has strengthened in comparison to other currencies. On the other hand, if the index value shows at 70, this implies a depreciation of 30%

Final Thoughts

The U.S. Dollar Index enables traders to monitor the value of the U.S. dollar in comparison to six currencies within the bracket in a single transaction. Moreover, it also assists them to hedge the bets against risks associated with the Dollar. Investors can use this index to hedge the normal movement of currency or speculate.

[wp_quiz id=”97442″]
Categories
Forex Course

94. Calculating and Comprehending Pivot Points

Introduction

In the previous lesson, we understood what pivot points are. However, it is also necessary to understand how these levels are calculated. So, in this lesson, let’s go ahead and figure out how these levels are marked and comprehended.

Before getting right into it, let’s brush up the previous topic real quick.

  • The pivot point is an indicator used to identify Support and Resistance levels.
  • It is a static indicator, unlike the other indicators that move with the price.
  • It helps in determining the overall trend of the market in any given timeframe.
  • It is calculated using high, low, and close values.

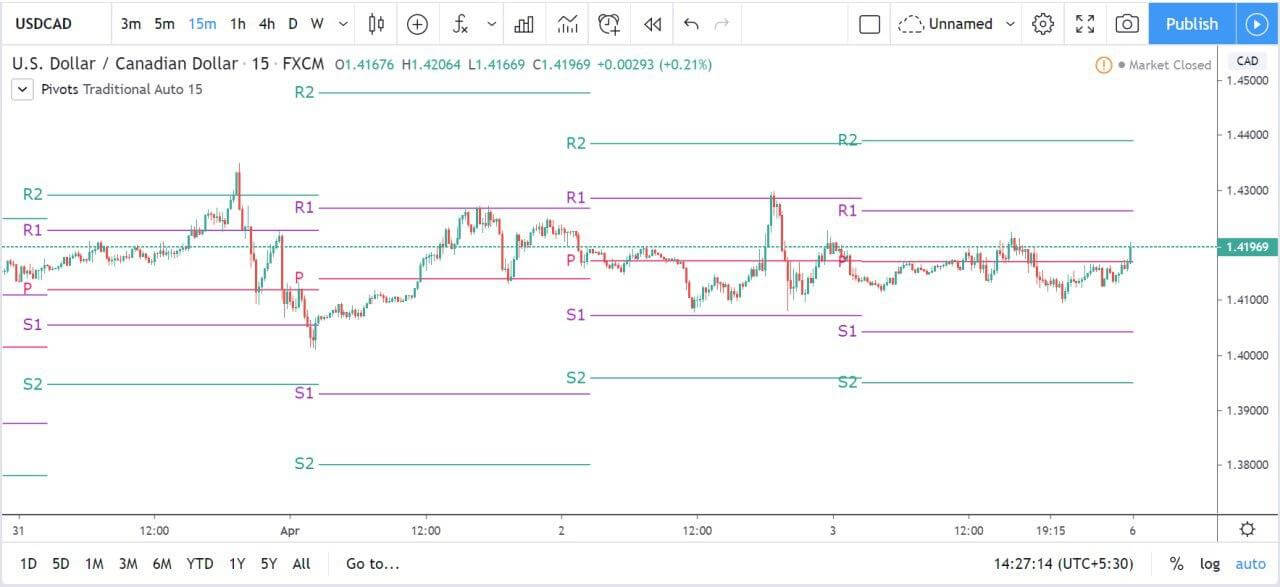
Below is an image of how pivot points look when applied on the charts. As already mentioned, S stands for Support, R stands for Resistance, and P(PP) stands for Pivot Point. Now we shall see what exactly is S1, R1, S2, R2, etc.

Calculating Pivot Points

Different levels of Support and Resistance are shown when calculating the Pivot point’s support and resistance levels, and they are represented as S1, R1, S2, R2, etc. Now, let’s calculate each one of them. The Pivot Point P(PP) value is given by the average of the high price, low price, and the close price.

Pivot point P(PP) = (High + Low + Close) / 3

First level Support and Resistance Formula:

First Resistance (R1) = (2 x P) – Low | First Support (S1) = (2 x P) – High

Second level Support and Resistance Formula

Second Resistance (R2) = P + (High – Low) | Second Support (S2) = P – (High – Low)

Third Level Support and Resistance Formula

Third Resistance (R3) = High + 2(P – Low) | Third Support (S3) = Low – 2(High – P)

In the above formulas:

High represents the high price from the previous trading day,

Low represents the low price from the previous trading day, and

Close represents the closing price from the previous trading day.

Note: Since the forex market is open 24 hours, the New York closing time, i.e., 5:00 pm EST, is taken as the previous day data. For example, if you want to calculate the levels for Wednesday, you must consider the values of Tuesday.

Comprehending Pivot Points

In this indicator, we came across three levels, namely, Pivot point level, Support level, and the Resistance level. Let’s now understand what they actually depict.

The pivot point is a level drawn at the price of the average of the High, Low, and the close price of the prior trading day. So, if the market falls below the pivot point level on the subsequent trading day, we say that the market is showing bearish sentiment. And if the price goes above the pivot point, we say that the indicator is indicating bullish sentiment.

When it comes to the Support and Resistance levels, their meaning is the same as that of the actual Support and Resistance that is defined in the industry. The Support level is the price at which the market tends to shoot up, and Resistance is the level where the market tends to fall.

This brings us to the end of this lesson. In the coming lessons, we will understand how to trade the markets applying the Pivot Points indicator.

[wp_quiz id=”69225″]