Categories
Forex Course

196. Ever Wondered What ‘Trade-Weighted Dollar Index’ Is All About?

Introduction

The trade-weighted dollar is a prominent index developed by the FED in order to measure the value of the U.S. dollar spending on its competitiveness against the trading partners. It is used to determine the purchasing value of the U.S. dollar and to summarize the impact of appreciation and depreciation of the currency against foreign currencies.

The Importance Of Trade-Weighted Dollar Index

When the value of the U.S. dollar rises, the import to the country becomes less expensive, whereas exports become expensive. A Trade-Weighted Dollar Index is used to measure the value of the foreign exchange of the U.S. dollar in comparison to specific foreign currencies.

It offers weightage or importance to currencies that are most popularly used in international trade, instead of comparing the dollar value to every foreign currency. As the currencies are weighted distinctively, the modifications in each currency will have a different effect on the trade-weighted dollar as well as corresponding indexes.

After the U.S. Dollar Index, Trade-Weighted Dollar Index is the primary tool used to measure the strength of the U.S. dollar. It is also reckoned as the Broad Index was introduced in 1998 by the U.S. Federal Reserve Board.

It was created after the integration of the Euro and to reflect the trade patterns of the U.S. more precisely. The Federal Reserve picked 26 currencies for this broad index, envisioning the acceptance of the Euro by 11 countries belonging to the European Union.

Countries Included In The Trade-Weighted Dollar

Index

Here are the countries with the weight on the index –

  • Eurozone – 18.947
  • China – 15.835
  • Canada – 13.384
  • Mexico – 13.524
  • Japan – 6.272
  • United Kingdom – 5.306
  • Korea – 3.322
  • Taiwan – 1.95
  • Singapore – 1.848
  • Brazil – 1.979
  • Malaysia – 1.246
  • Hong Kong – 1.41
  • India – 2.874
  • Switzerland – 2.554
  • Thailand -1.096
  • Australia – 1.395
  • Russia – 0.526
  • Israel – 1.053
  • Sweden – 0.52
  • Indonesia – 0.675
  • Saudi Arabia – 0.499
  • Chile – 0.625
  • Philippines – 0.687
  • Colombia – 0.604
  • Argentina – 0.507

Final Thoughts

Trade-Weighted US Dollar is a broad index that includes countries from all across the world. Traders will also find some developing countries in the broad index list, which makes it a better reflection of the value of the U.S. dollar worldwide.

[wp_quiz id=”97448″]
Categories
Forex Videos

Forex – Fed Saturates The Markets With Dollars – How Should You Trade The Dollar Now!


Fed saturates the markets with dollars – what next? 


In this session, we will be looking at the extraordinary amounts of US dollars, which have been printed by the federal reserve in America and flooded into the system to try and prop up the US economy during the coronavirus.

Since the pandemic began and started to bite in the United States, it is estimated that over 20% of all circulating US dollar bills were printed during this time.

 Although the federal reserve has publicly declared that their monetary policy has not been designed to save Wall Street,…..

….there is no denying from this chart that dollars,  which are required to buy United States stocks,  are finding their way into US stocks and indices, such as the Dow Jones Industrial Average Index shown here, which had climbed from the panic sell-off in March 2020 when the pandemic began to take a grip of the United States,  up to record highs of over 30 thousand.

Purely on a supply and demand basis,  the shock and magnitude of the influx into the market of the US dollar has gone a long way to shedding its market value against currencies, including the major currency pairs as shown here on this dollar index where it was at a high of 103.00 in March, and while the fed has been pumping dollars into the system, it has collapsed to 91.70 at the time of writing.

While the safety of gold saw investors take flight here during the latter part of March 2020, causing the precious metal to rise in value in a risk-off event during the early stages of the pandemic in the USA to a peak of over 2000 an ounce, and where traders have pulled back while shifting their focus to the US stock market, in a risk-off phase, and where gold currently sits around 1800 per ounce.

The federal reserve has been getting into the markets indirectly, via the backdoor, by talking to hedge funds, mutual funds, credit facilities, market makers, and commercial paper funding facilities, and instigated a huge emergency repo loan operation with the New York fed, where it is said that over 6 trillion dollars have as entered into circulation through this facility.

The Fed’s pumping of dollars into the market, where its value has crashed in value relatively over the last 100 years, has given fuel for the rise in interest for bitcoins and other cryptocurrencies and as we have seen gold and other precious metals, while investors try to hedge against dollar depreciation and inflation, as the dollar continues to lose value against other assets. 

 And by the time the new president-elect, Joe Biden, takes office, the two political houses in the USA, currently at loggerheads, will agree more stimulus, in the range of 1 to 2 trillion dollars, and where once this has been agreed, this will only pour more oil on the burning cauldron and the effect will likely be the US dollar’s further decline, with a knock-on effect being volatility in the financial markets, and higher prices for consumers.  

Categories
Forex Market Analysis

An Interest Rate War is Coming? – 13.06.18 Daily Update


Fundamental Overview


An Interest Rate War is Coming?

Financial Market Latest Updates: In today’s session, the Federal Reserve has decided to increase the interest rate by 0.25%, hiking it from 1.75% to 2%. Beyond commenting the Dollar Index movements or the FED Chairman Jerome Powell’s remarks at the press conference; this interest rate increase the United States is carrying out will mean a change in the course of the monetary policy for the rest of the principal Central Banks.

On the one hand, the ECB has been starting to raise the discourse of the end of the bond purchase program in June and a potential increase in the interest rate that would start from 2019. On the other hand, the Bank of Canada Governor, Stephen Poloz, has commented that there will possibly be a new increase in the interest rate in July (currently at 1.25%). The Reserve Bank of Australia is not far behind in this discourse of rate increases and considers that given the level of inflation in Australia, sooner than later there should be an interest rate hike (the current interest rate is 1.5%.)


Technical Analysis


EURUSD

EURUSD continues moving sideways in the pennant pattern expecting the ECB interest rate decision where we foresee that the pair makes new highs above the 1.19 level.


GBPUSD

GBPUSD continues testing the blue box and bouncing. We expect significant moves in this pair in the next week with the BoE Monetary Policy Meeting scheduled on Thursday 21st. As long as the price does not make a 2B Pattern, a new cycle will not initiate.


USDCHF

USDCHF as forecasted in our previous Daily Update, made a bullish false breakout and then a bearish move. We still expect fresh lows at least to the blue box between 0.9831 and 0.9809.


EURGBP

EURGBP is moving sideways. In terms of the traditional Technical Analysis, we could consider the structure as an inverse head and shoulders pattern and a continuation pattern. Our main scenario is that the cross could strike the 0.8921 level mid-term.


EURJPY

EURJPY is testing the 130.27 resistance, forming an ascending triangle as a continuation pattern of the previous bullish move. We expect that the price reaches the 132.5 level, from where the cross should make a new bearish connector.


FTSE 100

FTSE 100 still is moving in the lateral channel. Remember that the next BoE interest rate decision meeting will take place on June 21st. Despite none of 63 economists polled by Reuters expect any move from the current 0.5%, a surprise effect of the rate hike could move the British Index considerably.


DAX30

DAX 30 still is moving in the sideways corrective structure, it’s probably waiting for the ECB interest rate decision and the Mario Draghi discourse before it continues the bearish bias.


Categories
Forex Market Analysis

Main European Indexes Reach Areas of a Potential Reversal

Hot Topics:

  • Main European indexes reach areas of a potential reversal.
  • Dollar maintains the upward trend after the Fed’s decision to keep the rate unchanged.

Main European indexes reach areas of a potential reversal.

The FTSE 100 is developing an ascending wedge pattern; the bullish movement has led the British index to reach a critical resistance at the 7,572.2 level, the area from which we expect it to begin making a corrective move, possibly down to the 7,326 pivot. Sales are considered if the price closes below the breakout candle at 7,523.

DAX 30. After the break on Tuesday, May 1st, the German index climbed above the resistance at 12,622.4, closing the session in the blue box that we have been watching since last week. This bullish movement that was developed in five waves could begin to correct in three waves, and from the end of this potential drop-down, we would start valuing long positions.

Dollar maintains the upward trend after the Fed’s decision to keep the rate unchanged.

The EURUSD continues its bearish trend consolidating below the 1.20 level; the Single Currency could fall from 1.1991 to 1.1833, where it could begin a bounce. Long positions are considered above the 1.2011 level.

The Pound has broken down the support level of 1.36, entering in the potential reversal zone, where we foresee that it could perform a lower low reaching the 1.3481 level. At this level, buyers may be waiting to place their long positions with a target around the 1.39 zone.

The Swiss franc is forming a top pattern around parity. It could form a spike, which we estimate should not exceed 1.03, where it should begin a corrective move. Our most conservative vision on short positions is once the price breaks-down below 0.9955 with a profit target at 0.9836.

©Forex.Academy

Categories
Forex Educational Library

Quarterly Report on the Balance Sheet of the Federal Reserve 2017

In the quarterly reports of the Federal Reserve balance sheet, it is possible to appreciate the composition of the assets, obligations, capital and financial information of the Federal Reserve. With these reports that are issued quarterly, it is possible to analyse how the portfolio of the Federal Reserve is composed as well as to give some clues as to what the monetary policy will be like. It is important to remember that for the Federal Reserve, the main monetary policy tool is the interest rate of the federal funds and a secondary tool is a modification in their assets that are reported in the balance sheet.

In the March report of the balance sheet of the Federal Reserve, it was stated that since 2009 the Federal Reserve had the power to carry out Open Market Operations (OMOs) in the domestic market. These operations included limited purchase and sale of:

  • Treasury securities.
  • Government-sponsored enterprise (GSE) debt securities, and federal agency.

The OMOs have historically been used by the Federal Reserve to adjust the supply of reserve balances, as well as to maintain the federal funds rate close to the objective established by the Federal Open Market Committee (FOMC).

In addition, in recent years the Federal Reserve has implemented other tools to provide liquidity in the short term to domestic banks and other depository institutions through the discount window.

Between October 2016 and February 2017, the System Open Market Account’s (SOMA) holdings of Treasury securities changed little due to the FOMC policy of rolling over maturing Treasury securities at auction.

In this period of time, the SOMA’s holdings of agency debt decreased due to the maturity of the bonds. On the other hand, MBS increased due to the reinvestment of the main payments. The agency mortgage-backed securities were assets acquired by the bank to provide support to the real estate and housing market after the 2008 crisis and thereby also provide security in the US financial market.

The MBS are financial instruments traded in the capital markets, whose value and flow of payments are guaranteed by a portfolio of mortgage loans, generally residential property. The fact that the Federal Reserve resorted to this type of unconventional monetary policy was to avoid the deflationary risk and give a boost to the economy that had been sunk since 2008.

From 2009 to 2014 the expansion of SOMA securities holdings was driven by a series of large-scale asset purchase programs(LSAPs) that were conducted to give an impulse to the housing market and give a boost to the economy from the financial system.

In the graphs of the article, it is observed that there was not a significant change between the previous reports and the one of the first quarter of 2017 where there have not been large acquisitions, but there has not been any reduction of the assets since it is complemented with the monetary policy reports. normalisation of the balance sheet was to begin until the end of 2017 and various statements have given hints that this normalisation will be very slow to not affect the credit market and therefore the economy.

In the May report, SOMA’s holdings did not show large changes in line with market expectations, which still did not expect any reduction in holdings. Agency debt holdings decreased between February and April due to the maturity of the bonds and the holding of MBS also decreased due to a difference between the payment times of the principal and when this amount was reinvested.

Since mid-2014 the Federal Reserve was one of the first central banks to issue press releases informing the market of its intentions to begin the normalisation of the balance sheet since the objective of this unconventional policy had been achieved for the bank. After knowing these intentions, the markets were a little volatile given that this would mean less liquidity for the market and for the financial system, and possibly higher interest rates for banks which would lead investors to review their portfolios.

In the August report, there were few changes in the bank’s assets due to the policy of reinvesting the treasury securities in auctions. The agency debt decreased as in the previous reports due to the maturity of the bonds while the MBS did not change its amount in the balance. If this report is complemented with the monetary policy report of the Federal Reserve, the market concluded that the normalisation program would begin in October. In addition, the last rise in the interest rate of the federal funds occurred at the June meeting so the market had a great expectation regarding the normalisation of monetary policy in general and that included the balance sheet.

In the report of the fourth quarter of 2017 the FED explained that since the 20th of September 2017, the FOMC had announced that in October it was going to start the normalization program of the balance sheet where its assets were going to be reduced gradually due to the reduction in the reinvestment of the main payments received from the securities held by the SOMA. Principal payments will be reinvested only to the extent that the established limits would be exceeded.

Initially, the decline in SOMA securities holdings would be capped at $6 billion per month for Treasury securities and $4 billion per month for MBS. The limits could reach maximums of $30 billion per month for Treasury securities and $ 20 billion per month for MBS. From 2009 to 2014, the FOMC made a large expansion of SOMA securities holdings through a series of LSAPs that were conducted to support the housing market, support the financial market and give a boost to the economy.

Once the limits reach their respective maximums, it is expected that these values will be maintained so that the asset holdings continue to decline in a predictable and gradual manner, until the FOMC decides otherwise.

The gradual reduction of the holdings of the assets of the Federal Reserve will result in a decrease in the supply of reserve balances. The FOMC expected to reduce the number of balances to a low level compared to the one the bank had in recent years, but higher than they had prior to the financial crisis.

The level should reflect the banking system’s demand for reserve balances and the FOMC’s decisions on the correct monetary policy. This way of reducing the balance slowly would avoid large imbalances in the economy and possible effects on monetary policy. Although in the report the committee was clear on what the objective of standardisation was, no rank was given on the appropriate level of assets, which has been a criticism of these unconventional monetary policies since they had not been used actively before. What there is uncertainty for many analysts about what can happen after normalisation.


Graph 71. Domestic SOMA securities holdings. Data from https://www.federalreserve.gov/monetarypolicy/quarterly-balance-sheet-developments-report.htm


Graph 72. The US Treasury notes and bonds nominal. Data from https://www.federalreserve.gov/monetarypolicy/quarterly-balance-sheet-developments-report.htm


Graph 73. MBS. Data from

https://www.federalreserve.gov/monetarypolicy/quarterly-balance-sheet-developments-report.htm


The above graphs show the total amount of assets held by the FED and two of the most representative assets on the balance sheet. As you can see, the MBS is a little less than half of the balance sheet, which reflects the large number of assets that the FED should divest, since some analysts believe that the equilibrium situation is where the banks only have public debt and not bonds, neither private nor corporate debt. These mortgage-backed assets are not as safe as public debt, so a significant reduction in these should be generated in the balance sheet.

With the data that is available so far, it is expected that normalisation will continue without problems because the pace of the US economy and the labour market have been positive. As for inflation, despite not yet being at the desired level, if it is close and is expected to increase over the next few years due to the good performance of the global economy, there is no situation that could affect this program. In the first report of the bank’s acquisition of assets in 2018, a difference should be seen with the reports exposed so far and with the graphs in this article.

The normalisation of assets has been expected since 2014 because according to some studies, this is the second-highest amount of assets in the balance in all history. At the FOMC meeting in November, it was decided to raise the federal funds rate up to 1.5%, so a rise in interest rates on loans is expected. Given this measure in addition to normalisation, this large balance sheet also maintained the low rates in the medium and long-term.


Categories
Forex Educational Library

Components of the Federal Reserve

To understand how each meeting of the Federal Open Market Committee (FOMC) is conducted and who is in charge of monetary policy we should understand how the Federal Reserve is composed, who are its members and how they are elected. In addition, we should know what the tasks are of each entity of the reserve to determine how they will act in the meetings they have throughout the year. The Federal Reserve is not like other central banks as there is some independence between the banks in each district, so it is important to understand how the bank is made up.

The Federal Reserve System is the central bank of the United States. It develops five main functions to promote the efficient operation of the economy of the United States and thus achieve a better welfare of the public in general. The five main functions are:

Control the monetary policy of the country: The objective of the monetary policy is to promote maximum employment, stable prices and moderate interest rates in the United States economy.

Promote the stability of the financial system: It seeks to minimise and contain systematic risk through the activity of monitoring local and foreign financial activity.

Promote the safety and soundness of individual financial institutions: Monitor the activity of each bank individually to analyse its impact on the banking system as a whole.

Promote the security and efficiency of the payment and settlement system: Through services to the banking industry and the US government that facilitate transactions and payments in US dollars.

Promote consumer protection and community development: Through consumer-centred monitoring and review, research and analysis of emerging consumer issues and trends, community economic development activities and administration of consumer laws and regulations.

The structure of the central bank is decentralised so the Federal Reserve is divided into 12 districts. The boundaries of each district were based on the commercial regions that existed in 1913 and other economic variables, so each district of the central bank does not necessarily coincide with the geographical lines of each state. In addition, each district is identified by a number, which makes it easier to identify which district is being analysed in the bank’s reports. In the following graph, you can see the 12 districts of the banks of the reserve.

Graph 43. Federal Reserve Banks. Retrieved 13th January 2017, from https://www.federalreserve.gov/aboutthefed/structure-federal-reserve-system.htm


The twelve districts of the Federal Reserve operate independently, but under the supervision of the board of governors of the reserve. In principle, it was determined that each district will work independently and make its monetary policy decisions separately, but when the national economy became more complex and more integrated, the districts had to cooperate more with each other and coordinate their policies. In 1935 the Federal Open Market Committee (FOMC) was created, showing a unification of the concepts of each district.

In the mid-1980s, the Federal Reserve centralised and consolidated its financial services as well as creating support channels between the different districts. Reserve banks have become more efficient through the conclusion of service agreements within the system that assign responsibilities for services and functions of national scope between each of the 12 banks.

The drafters of the Federal Reserve Act initially rejected the concept of a single central bank. Instead, a bank was formulated with a system of three fundamental pillars. First, a board of governors of the central bank that would have the task of supervising the work of others. Second, a decentralised structure in its operation of 12 banks in the reserve. And third, a combination of public and private characteristics in its management. Although some central bank entities share characteristics with private sector entities, the Federal Reserve was established to serve public interests. In the following graphs, you can see the composition of the Federal Reserve and its main tasks (graph 44), and how the Federal Reserve was organised (graph 45).

Graph 44. Purposes and Functions. Retrieved 13th January 2017, from https://www.federalreserve.gov/aboutthefed/structure-federal-reserve-system.htm

Graph 45. Purposes and Functions. Retrieved 13th January 2017, from https://www.federalreserve.gov/aboutthefed/structure-federal-reserve-system.htm

In summary, there are three key entities in the Federal Reserve system:

  • The Board of Governors of the reserve.
  • The Federal Open Market Committee (FOMC).
  • The Federal Reserve banks.


The board of governors is a federal government agency that reports directly to the Congress, provides general guidance to the system and oversees the 12 reserve banks.

Within the system, there are certain responsibilities that are shared between the Board of Governors in Washington D.C. (whose members are set by the president with the consent of the Senate) and the banks and branches the federal reserve. While the Federal Reserve has frequent communication with the executive branch and congressional officials, its decisions are made independently.

In addition to these key parts in the Federal Reserve, there are two other significant entities that contribute to the functions of the reserve.

  • Depository Institutions (banks, credit unions and savings banks): Depository Institutions offer transaction and check accounts to the public, and they can maintain their own accounts in their local Federal Reserve banks. The depository institutions must comply with the reservation requirements, that is, keep a certain amount of cash, either in cash or in an account in a Reserve Bank based on the total balances in the current accounts they hold.
  • Advisory Committees of the Federal Reserve System: They make recommendations to the Board of Governors and reserve banks depending on the functions of each one. There are four advisory councils that assist and advise the board on public policy issues.

The Federal Reserve has its own advisory committees that help in making decisions, but one of the most important committees is the one that advises them on issues of agriculture, small businesses and labour market issues. The board of governors requests committee reports twice a year to assess the state of the economy and national sectors.

As mentioned in the introduction, the goal of the Board of Governors, federal banks and the FOMC is to work together to promote the health of the United States economy and price stability, coupled with the stability of the national financial system.

The way the Federal Reserve works is as follows. The Board of Governors, located in Washington D.C., is the governing body of the federal reserve system. It is made up of seven members who are nominated by the President of the United States and are confirmed in their positions by the Senate. The board guides the operation of the federal reserve system to promote the objectives and complete the responsibilities given to the reserve system.

All board members serve on the FOMC, which is the body within the Federal Reserve that establishes monetary policy. Each member of the Board of Governors is appointed for a period of 14 years; the terms are staggered so that a term expires on January 31 of each even year. After completing a full 14-year term, a Board member cannot be reappointed. The president and vice president of the Board are also appointed by the United States President and confirmed by the Senate, but they only serve for a term of four years, although they can be re-elected for another four years.

Nominees for these positions must already be members of the Board or must be appointed simultaneously to the Board. The Board oversees the operations of the 12 reserve banks and shares with them the responsibility of supervising and regulating certain institutions and financial activities.

The board also provides general guidance, direction and supervision when reserve banks provide loans to deposit institutions, and when reserve banks provide financial services to depository institutions and the federal government. As part of the surveillance, the Board evaluates and approves the budgets of each reserve bank. It also ensures that the concerns of consumers are heard by the central bank to respond to their needs.

The 12 central banks and their 24 branches are the operating arms of the Federal Reserve System. Each reserve bank operates within its particular geographic area or district. Each reserve bank collects data and other information about the business and the needs of the community in each district. Then that information is compiled by the FOMC so that the Board acts based on these studies.

The Federal Open Market Committee (FOMC) is the part of the federal reserve that is responsible for setting the national monetary policy. The FOMC makes decisions regarding open market operations that affect the interest rate of federal funds (the interest rates at which financial institutions lend to each other), the size and composition of the assets held by the reserve and communications with the public about the future course of monetary policy.

The FOMC consists of 12 voting members (7 members of the board of governors, the president of the New York Federal Reserve and 4 of the remaining 11 district presidents who rotate in this position annually.) All 12 presidents of the Banks in the districts attend the meetings they have with the FOMC and participate in the discussion about the state of the economy and what steps to follow, but only the presidents who are members of the committee at the time of the meeting can vote in Monetary Policy Decisions. By law, the FOMC determines its own internal organisation and by tradition, the FOMC elects the president of the Board of Governors as its president and the president of the New York Federal Reserve bank as its vice president.

FOMC meetings are usually held eight times a year in Washington D.C. and other times as necessary. This committee is in charge of supervising the open market operations, which are the main tools of the Federal Reserve to execute the monetary policy of the United States.

The monetary policy of the Federal Reserve is the set of actions taken by the central bank to achieve three specific objectives:

  • Maximum employment.
  • Stable price levels.
  • Stable and moderate interest rates in the long term.

The Federal Reserve conducts the national monetary policy by controlling the interest rate in the short term of the economy and by influencing the availability and cost of credits in the economy. Since monetary policy directly affects interest rates, there is an indirect effect on the prices of the goods of the economy, on the wealth of people and on the exchange rates with respect to other currencies. Through these channels, monetary policy influences the level of spending of the economy, investment, production, the level of employment and inflation in the United States.

An effective monetary policy complements the government’s fiscal policy to sustain economic growth in both the short and long term. Although the objectives of the bank with regard to the monetary policy have not changed, it has changed the form and the tools to control the variables of interest. The Federal Reserve was created by Congress in 1913 to provide the nation with more security, flexibility and a more stable financial system.

In the minutes signed in the creation of the Federal Reserve, it was established that the Board of Governors and the FOMC should conduct monetary policy to promote its three main objectives. In this mandate that was given to the federal reserve, the objectives will be considered fulfilled when the majority of people who are looking for work are successful in their search, and when the prices of goods and services on average are relatively stable.

The importance of stable prices for the economy is given because when there is stability in this variable, there is a stable growth in the long term of the economy, the level of employability is higher and more stable and helps the bank’s third objective since with stable inflation and within certain ranges, the interest rate in the long term will be moderate and in line with the expectations of the agents in the economy. In addition, they generate stability in the wealth of the population so stable prices over time will help improve the quality of life of American citizens.

Stable prices will also encourage savings and capital formation since when there is a low risk that inflation is outside of its target ranges, the risk of erosion in the value of assets is reduced, which is very evident when there is high inflation. For example, if a consumer wants to buy a machine for his factory and there is very high inflation, in the future, that acquired asset will lose its value which will also affect the confidence of people, who could postpone their consumption and investment decisions.

One of the objectives of the Federal Reserve that on some occasions has not been achieved is to control and promote the stability of the financial system by reviewing and regulating financial institutions and their activities. A financial system is considered stable when all institutions of the system such as banks, savings banks and cooperatives can provide resources to households, businesses and the community in general, to invest and participate actively in the economy which will generate long-term growth term.

The resources and services that a stable financial system should have are lines of credit for business, loans to students, savings accounts, retirement accounts among others. That is, there is an effective connection between lenders and borrowers where both parties are benefited by certain returns of their money and in other cases by the money supply that cannot be obtained otherwise. A healthy system must face low transaction costs that do not affect the distribution of resources because if the costs of lending are very high, the function of banks will not be fulfilled and there will be no relationship between people with money to invest and those who do not. They have the necessary resources.

With the task of the Federal Reserve to monitor the health of the financial system, it is supposed that there should be some regulations for banks to be able to face adverse conditions in times of crisis or possible bank runs that would affect the liquidity of banks. Monitoring risk through the financial system is the task of the Federal Reserve and other regulatory entities which should ensure that banks do not take excessive risks which have sometimes failed since private banks manage to bypass those regulations.

In conclusion, the federal reserve is a system composed of three key entities such as the board of governors, the banks of the 12 districts and the FOMC. Each of these entities has its own responsibilities, but they are under the authority of the Board of Governors. Within the board members, there are some members who are chosen by the president of the republic and confirmed by the Senate. The Federal Reserve is responsible for maintaining the good performance of the economy with stable price variables that allow interest rates without greater volatility. It is also a mandate of the reserve to monitor the financial system of the United States, but private banks have managed to bypass these regulations. For investor decision-making, it is important to analyse in each meeting who are the presidents of the banks with votes and the situation in their district to project what will be the decision of each one regarding monetary policy.


Categories
Forex Educational Library

FED Monetary Policy Report

Monetary policy reports are the result of the studies carried out by the Federal Open Market Committee (FOMC) showing how the United States economy behaves. With this report, you can analyse different local and foreign variables such as the real growth of the United States, inflation, unemployment rate, financial sector, the balance sheet of the central bank amongst others. In addition to exports and imports, the behaviour of the dollar with respect to other currencies such as the euro and the behaviour of its main trading partners.

The monetary policy report of the US central bank analyses the current state of the economy with its most important variables such as growth, inflation, the state of the internal financial market, and even the state of the economies of its trading partners, separating them according to the size of their economies. Also, depending on how the economy is at a given moment in time, short and long-term projections are made for the US economy, which can be taken as a signal about the possible measures to take by the federal reserve.

A review of the monetary policy report that was issued in February 2017 will be made first, then we will present the conclusions reached in its July report, and finally, we will analyse how the economy has behaved in recent months. Then we’ll try to assess if the central bank was right at the beginning of the year about its projections in the economy.

The FOMC is mandated to promote the highest possible level of employment, stable prices and moderate long-term interest rates. That is why their work is so important, given the fluctuations of the economy. So, the committee should periodically analyse how the state of the economy is, to decide whether to intervene or not, to reach their long-term goals. It is important to keep in mind that actions in monetary policy do not affect the economy immediately, they take time for the economy to react to these measures given the delay in transmission.

Monetary policy determines the rate of inflation in the long term, and the committee is the one that stipulates which long-term inflation target will be the most beneficial for the economy. When this objective is communicated to the public, the expectations of the agents are clarified, and the behaviour of the economy can be better predicted, given the knowledge about these expectations.

The maximum level of employment is determined mainly by non-monetary factors that affect the structure and dynamics of the labour market, for which no specific targets are set on the unemployment rate, since it would not be adequate, given the lack of tools to intervene this market. It is for this reason that when the monetary policy is determined, the committee seeks to mitigate deviations from the objective of long-term inflation and try to make the unemployment rate low without being its priority. Most times, these two variables are complementary, but in situations where both have imbalances and are far from the objectives, the committee will decide which will be the path of decisions for both variables to reach their objectives.

In February 2017, in its monetary policy report, the central bank observed a strengthened labour market, on the second semester of 2016. During this period, 200,000 new positions were added on average per month, which is a sign of a better behaviour of the economy compared to the first semester of that year; although slightly below the 2015 figures, when it reached up to 225,000 new jobs per month.

The unemployment rate decreased slightly from mid-2016 to 4.8% in January, which was in line with what was expected by the FOMC and with the figure that they estimate as the natural long-term figure in unemployment. The participation rate in the labour market rose at the beginning of 2017 thanks to its excellent labour market dynamics, but this effect they did not estimate it will continue, due to a demographic change in the population. Finally, concerning labour market, wages increased slightly since the end of 2016, which reflects a healthy market.

Regarding inflation, an increase was observed at the end of 2016 but remained below the expectations of the long-term FOMC, which is 2%. The 12-month inflation of 2016 was 1.6%, which means an increase of 1 point more than in 2015, which, in turn, reflects that the cost of energy has increased. That was a determining factor for inflation to be low in 2015. The personal consumption expenditure indicator, which excludes energy and food items, provides a better indicator of how the behaviour will be in the future. That indicator figure was at 1.7% at the end of 2016, which shows that during this period of time inflation has revived, and also its projections by different agents and analysts, but the 2% FED goal had not yet been achieved.

The real growth of the second half of 2016 was reported at an increase of 2¾%, only 1% more than in the first half of 2016. Expenditure on consumption has expanded but within moderate magnitudes, thanks to better income of the population and its effect on the wealth of families. The housing market has gradually recovered, and there were some stimuli with the fiscal policy on all levels of government, which stimulated the economic growth observed in 2016. The levels of business investment were weak throughout that period, but they achieved a reasonable level of earnings growth at the end of 2016.

A slight recovery on exports was observed in the third quarter of 2016, but in general, throughout the year the behaviour of exports was weak, showing the effects of a strong dollar worldwide and the mediocre growth of the economies that trade with the United States.

Domestic financial conditions have sustained economic growth despite slight increases in the interest rate by the FED in the last months of 2015 and 2016. The vulnerability of the financial system of the United States remained moderate since mid-2016, thanks to well-capitalised banks and significant liquidity reserves. The relationship between household debt and income changed little in the last quarter of 2016 and was well below the maximum level reached about a decade ago.

In December, the FOMC increased the objective of the federal funds’ rate, which reflects that, in the future, inflation will reach the objective 2%, and in addition to the good performance of the labour market. The committee also clarified that it did not know when these rates or their magnitude were going to increase since it would depend on how the economy behaved, and on inflation and the labour market for 2017. The committee expected that, for the current year, the conditions remained positive, as well as inflation, which would lead to gradual increases in the federal fund’s rate, but below the long-term level expected by the agent’s rate.

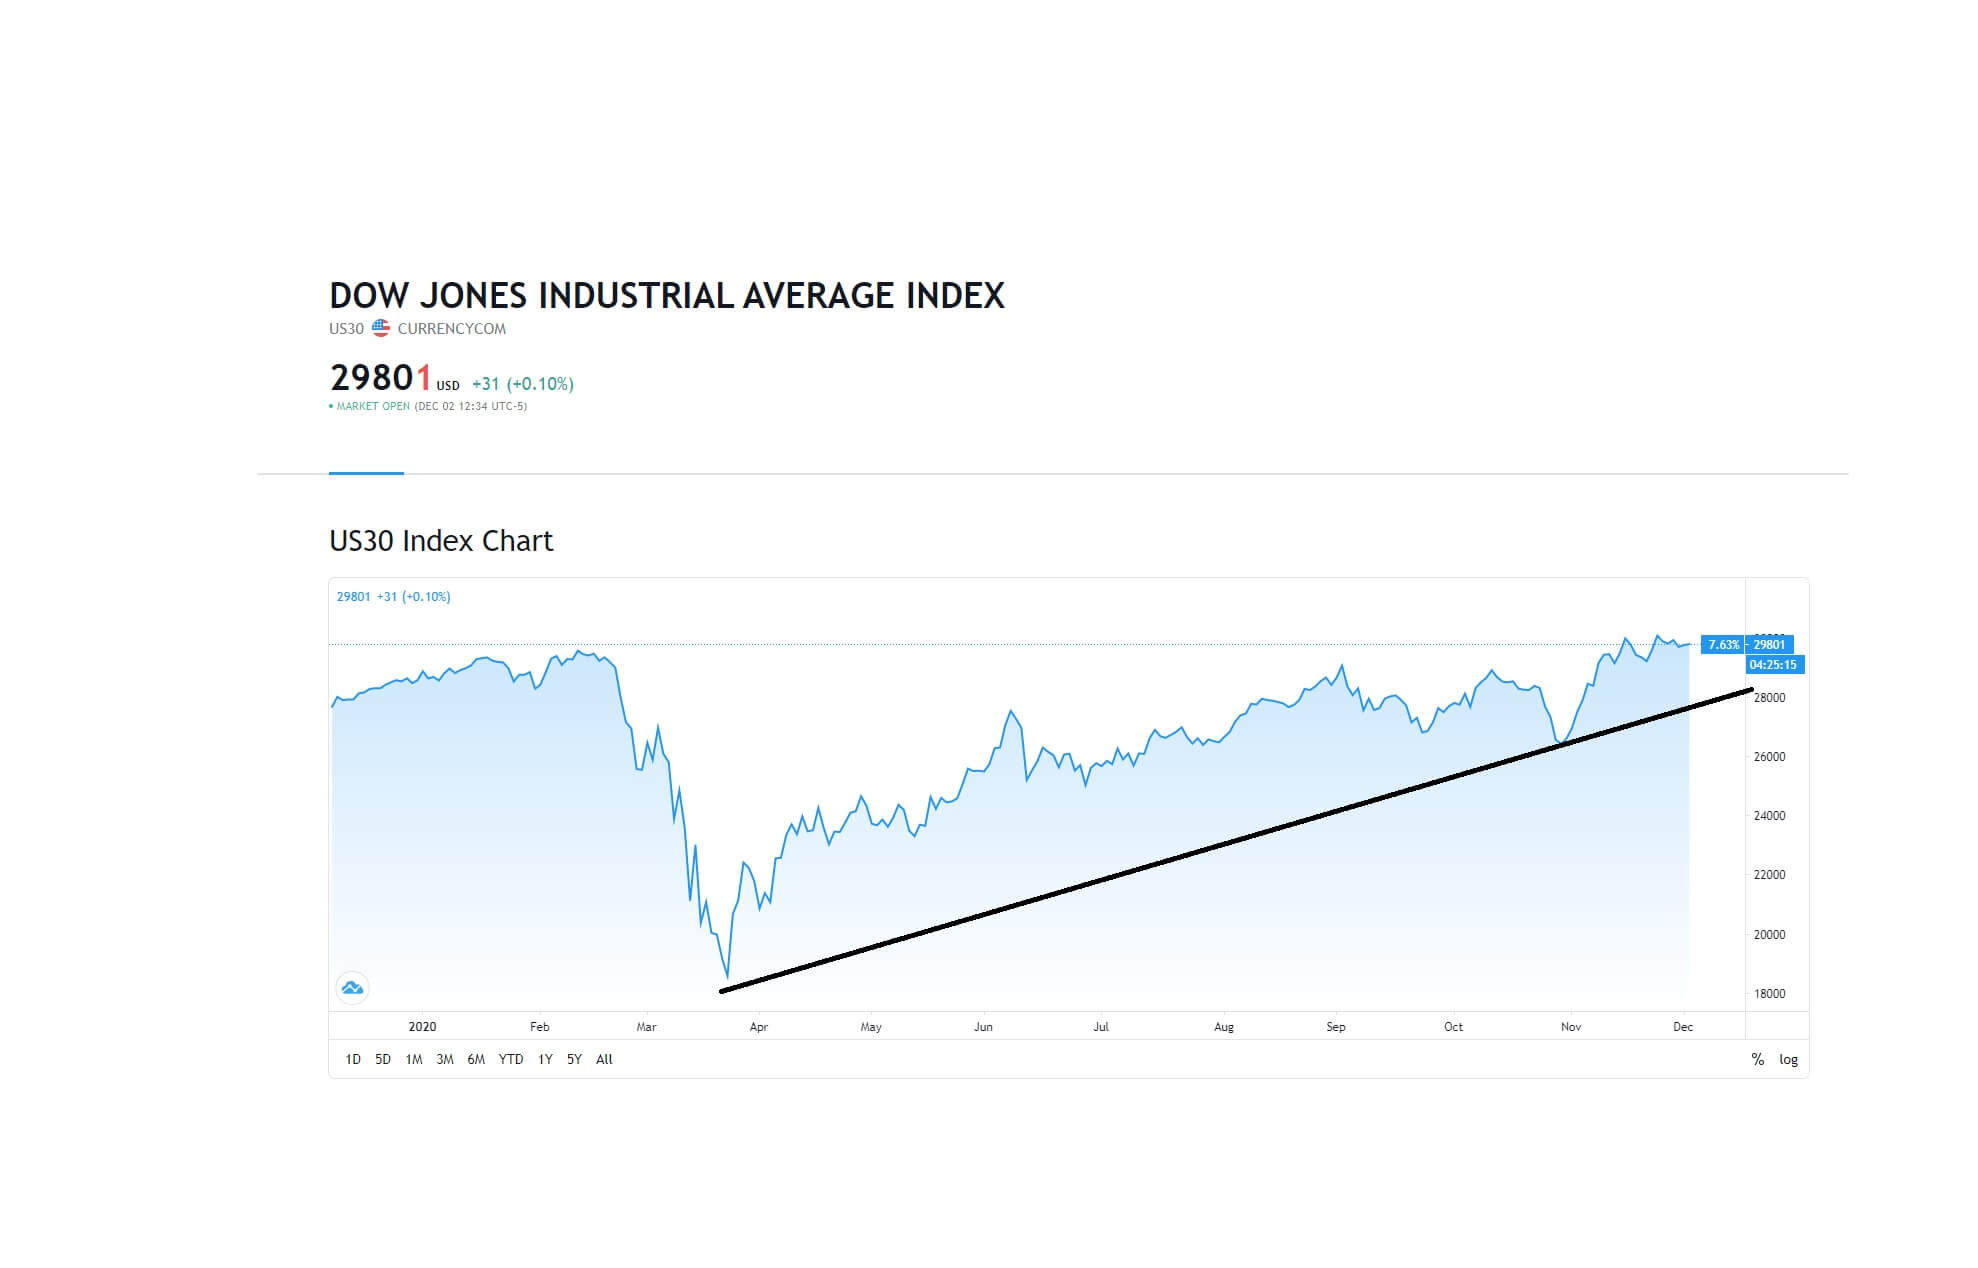
In conclusion, in the February 2017 report, the committee observed that economic growth was driven by financial conditions due to the low cost of debt for many households and businesses, and some gains in household wealth, thanks to the advance in the stock market at the end of 2016 and better conditions in the labour market. The negative aspect was the poor performance of exports due to the strength of the dollar with respect to the currencies of its trading partners.

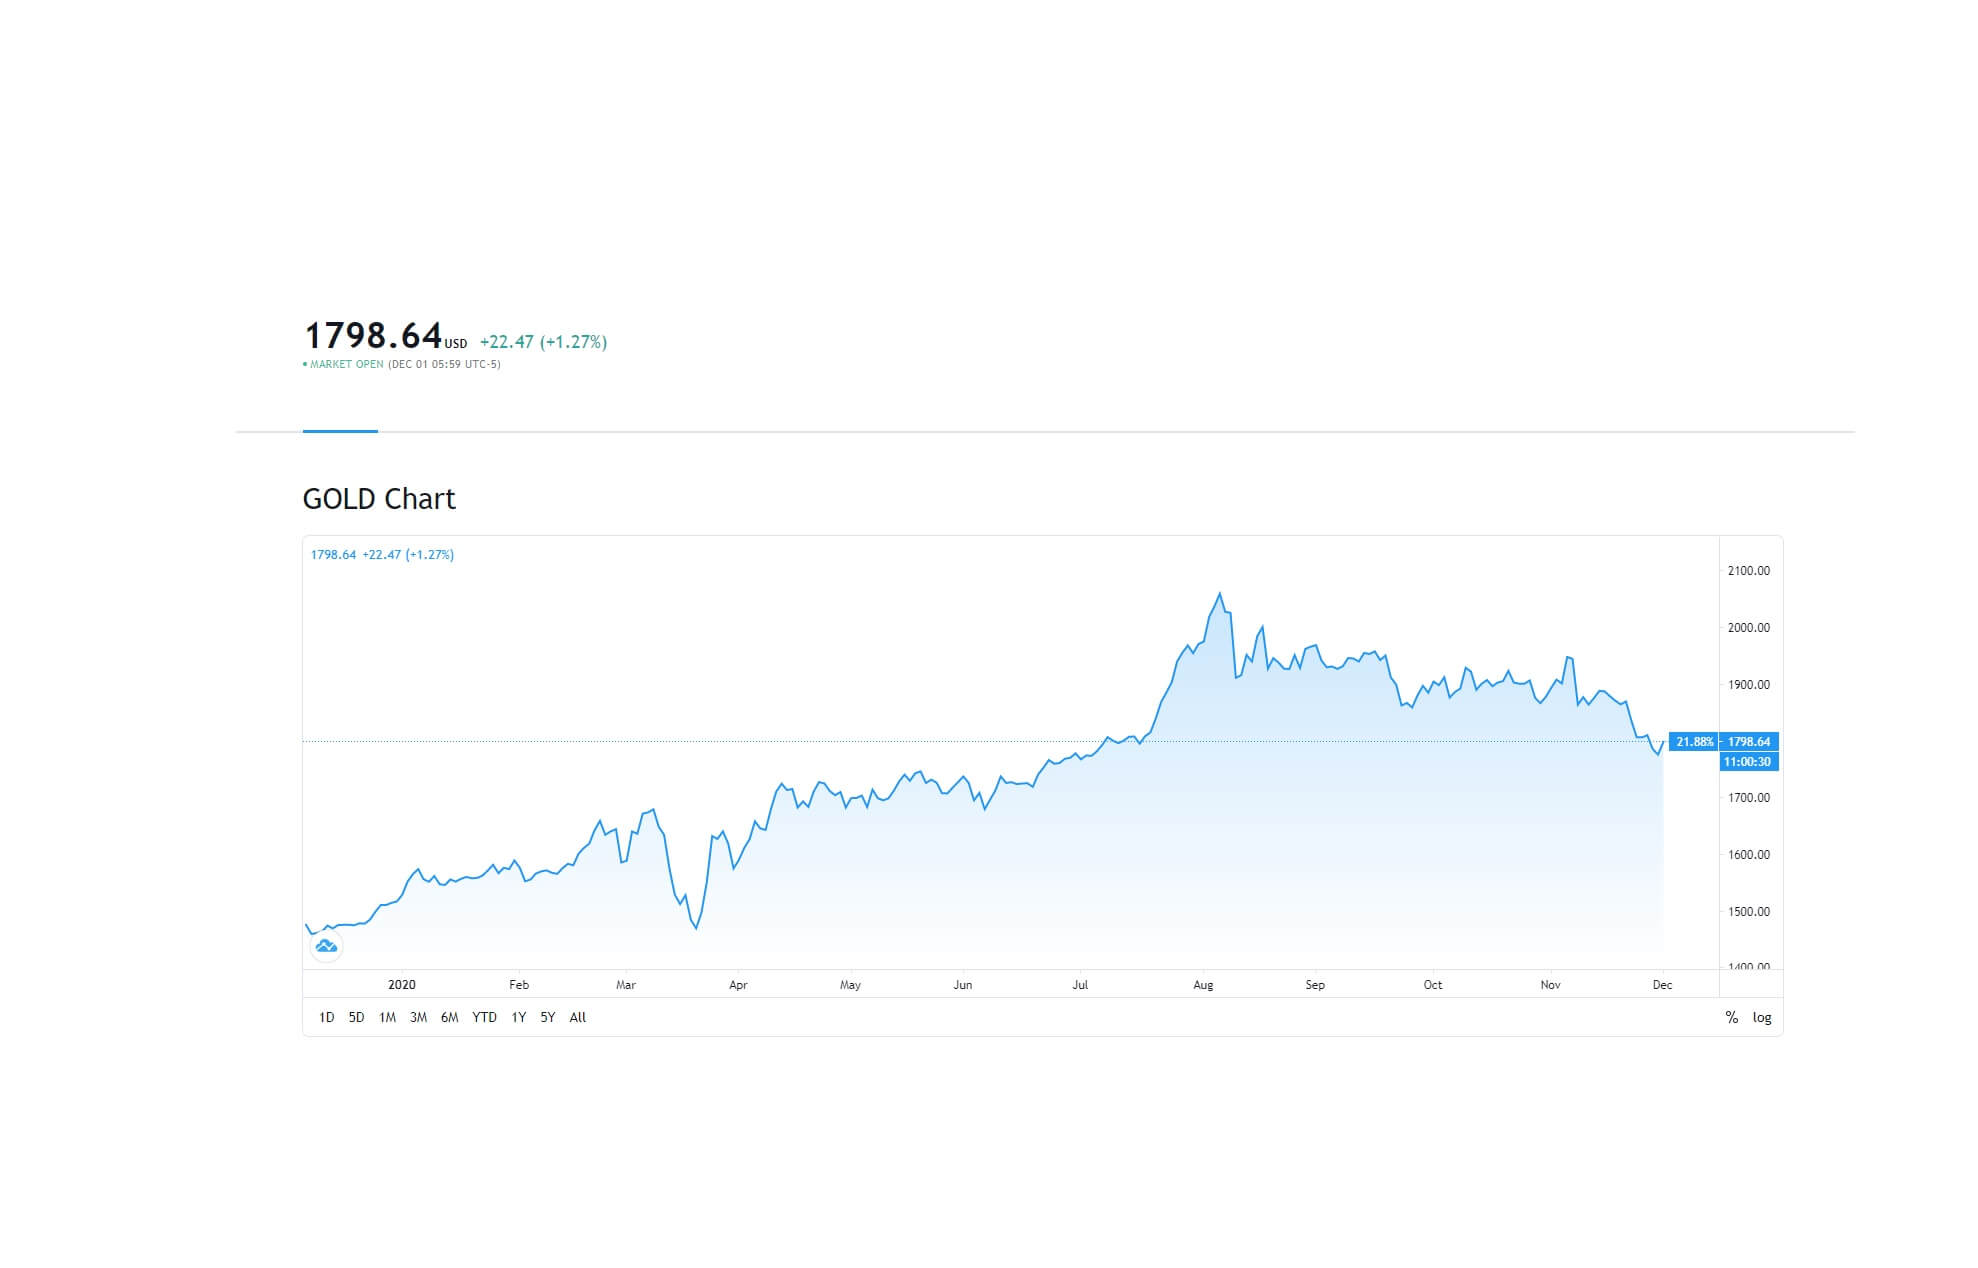
In terms of inflation, a slight recovery was observed in 2016, which is a relief for the central bank, since, in previous years, the fall in oil prices and the increase in terms of the dollar trade since 2014 caused prices to fall. Given this recovery in inflation, the FOMC’s goal in the federal reserve rates will increase for 2017, which will be added to the increase in the rate in 2016 and 2015 after the rate was close to 0% in years after the 2008 crisis, which was low to encourage growth and recovery of the economy.

Despite having observed good economic performance in 2016, the objective of the federal funds rate was below the long-term objective, which showed that the bank, despite seeing good signs in the economy, was cautious at the beginning of 2017, because of the drastic increases in interest rates.

The projections made in the February 2017 report show that, under an appropriate monetary policy, real gross domestic product growth should increase in 2017 and 2018, but not much beyond the long-term potential. Most analysts project that unemployment will be below long-term unemployment over the next few years. Finally, they expect inflation to reach or exceed 2% in 2018 and 2019, which would be positive since it would stay at the FOMC target. The following table shows the projections made in February by the bank’s committee.

Graph 41. Economic projections of Federal Reserve Bank. Retrieved December 30, 2017, from https://www.federalreserve.gov/monetarypolicy/mpr_default.htm

In the July 2017 report made by the central bank committee, there was a slight increase in economic activity in the first half of the year for the United States and the labour market continued to strengthen. The downside is that inflation slowed a bit in these months which contrasted with the projections made months ago when it was believed that inflation would be close to the 2% goal set by the committee. Despite this, at the July meeting, the FOMC increased its target of the federal funds rate and gave clues to the reduction in the size of its balance sheet in a gradual manner.

As for the labour market, it has continued to strengthen in the first half of 2017, just as it did in the two previous years. The jobs created were 162,000 per month on average which shows a slowdown in the figures shown by the market in 2016, but remaining with positive numbers for people seeking employment. The unemployment rate decreased to 4.3% in May, which was below the level expected by the FOMC for the long-term rate.

Consumer price inflation, year-to-year, reached 2% (FOMC objective) at the beginning of the year, but as the months advanced, inflation softened its trend, staying below the committee’s objective. The reading reached in May was 1.4%, slightly higher than the previous year’s inflation for the same period, which excludes food and energy prices, (Core inflation) as indicated above. It is an indicator reflecting how the behaviour of total inflation will be in the following periods, and May’s 1.4% figure reflects a deceleration in inflation. These are some historical hints showing that the inflationary trend has slowed down in the first half of 2017.

On the other hand, economic growth had an annual increase of 1½% in the first quarter of 2017, but evidence was found that this behaviour was not as positive in the second quarter. Consumer spending slowed in the first half of the year, but there were some signs at the end of May that suggested a rebound in consumption thanks to increases in household wealth and better expectations on the part of consumers. Investment in business increased in the first semester which is positive given the poor performance of this item in 2016. Finally, the housing market continued its slow recovery, and the foreign activity helping the economic growth in the United States had good behaviour.

In terms of financial conditions, domestic credit conditions for businesses and households have continued to support economic growth and stock market prices have continued to rise. The risk of the banking system has remained moderate thanks to the liquidity of the banks. Household debt as a proportion of GDP remains moderate and debt contracted by non-financial companies, although high, has been flat, and, even reduced in comparison to recent years.

The interest rate policy saw its target increase by the FOMC by the end of the year but remaining suitable for the US economy to continue growing, and for the inflation rate to remain at 2%; which would be utmost beneficial to the economy. The FOMC continues to hope that the economy will continue to grow for the next few years, the labour market will continue strong and inflation will reach 2% with the slight adjustments it will make with monetary policy.

Although these are the long-term objectives, in the short term, it expects inflation to stay below 2%, which will limit the interest rate hikes and therefore affect the decisions that the committee may take to direct the economy towards its objectives. Consistent with this, most agents expect the federal funds rate to be below the long-term rate in 2018.

Global productivity slows down, and this may be due to lower contributions in technological advances in the production of goods and services, as well as being a consequence of the crisis that occurred in 2008, which could have generated a significant impact in the development of new technologies.

The strength of the labour market is evidence of other indicators such as lower unemployment insurance claims, higher hiring and low dismissal rate. The only point that is not that positive in the labour market is the increase in salaries, which has been minimal due to those already mentioned productivity problems. Since 2008, productivity has only increased by 1% per year.

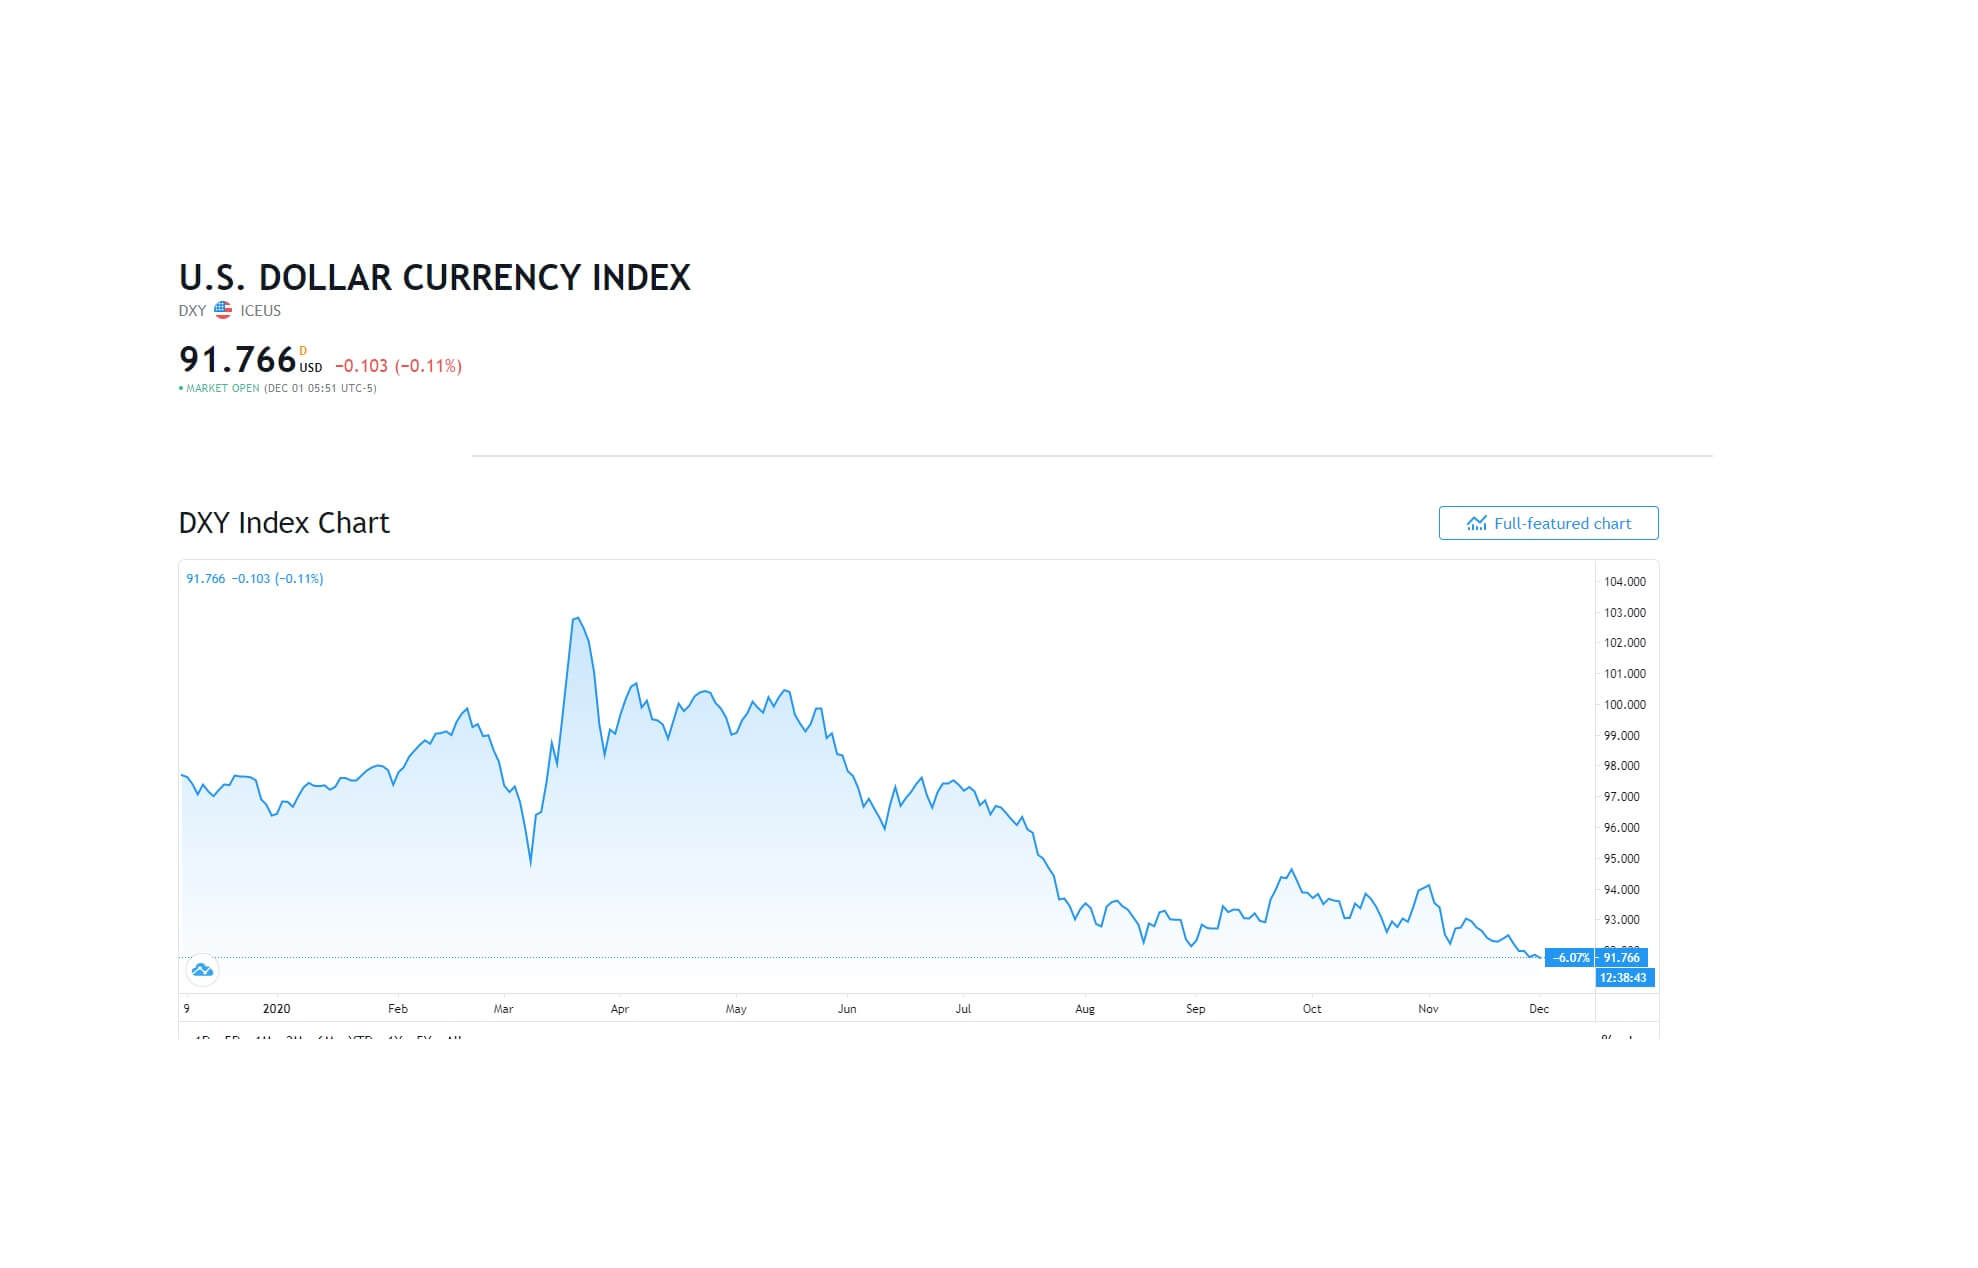
US exports increased more rapidly in the first half of 2017 than in 2016 thanks to the agriculture sector. At the same time, the real growth of imports was reduced in contrast to the behaviour they had during 2016. This could be due to a slight depreciation of the dollar at the beginning of 2017, as opposed to its former trend, between 2014 and 2016.

The following graph shows the main projections of the committee for the following years. The main estimates were that real product growth would be above natural long-term growth in 2017, an unemployment rate lower than that expected by the FOMC. Inflation is projected to be below its 2% target, but expecting it to accelerate in the next few years,  leaving more space for monetary policy.

Graph 42. Economic projections of Federal Reserve Bank, June 2017. Retrieved December 30, 2017, from https://www.federalreserve.gov/monetarypolicy/mpr_default.htm

If we examine the latest two reports of the central bank, we could observe that they presented more optimistic projections about the real growth of the economy at their June meeting compared to the one carried out at the end of 2016. The projections for the next two years continued to be stable relative to this variable. The change in labour market projections was also positive, observing a lower unemployment rate than projected in the previous year.

The negative aspect for the committee was the slowdown in the inflation rate for 2017, which caused the bank to refrain from raising rates in some meetings, limiting monetary policy and the decisions the FED expected to make. Even long-term inflation expectations were reduced, showing some concerns about prices. This is the only concern now due to the good performance of the economy in general, and by the labour market.

In conclusion, the bank’s monetary policy reports agree from one period to the other without drastically changing its conclusions about the behaviour of the economy, the labour market, inflation and other indicators. But since some variables are more sensitive than others, and therefore they may experience higher variability, it is normal that the inflation projections may change from report to report. As it was analysed, the United States economy is healthy with specific sectors that have marked the real growth, very good performance in the labour market allowed for an increase in the wealth of households, and a solid financial system that made possible to inject liquidity to the housing, investment and consumer market.  When reading both reports, we recognise that the sectors of the economy are dynamic, and not always growth was generated by the same sectors. For instance, consumption was important in 2016 and agriculture in 2017 in conjunction with the external sector,  which, conversely, had poor behaviour during 2016.

©Forex.Academy

Categories
Forex Educational Library

FED Beige Book – November 2017

Beige Book November

The Beige Book is a publication of the Federal Reserve system where the economic conditions of the twelve federal districts of the reserve are published monthly. This report characterises the regional economic conditions and shows how the projections by zones are based on vast information collected by the authorities of each district. Analysing each district, we can have a clearer picture of the conditions in which the main economic zones of the United States are located, which make it possible to make projections about the possible votes that the federated presidents will hold.

The qualitative nature of the Beige Book creates opportunities to analyse the dynamics of each region and identify possible trends in the national economy of the United States that may not be so clear in the monetary policy reports. That is, by analysing the report of each district in the United States, analysts could predict how the national economy will behave by uniting individual trends and their weight in the economy.

The information collected in the Beige Book is complementary to other reports issued by analysts and other central bank entities and can be used by any investor to make decisions. In addition, Beige Book publications often allow the investor to summarise and show what the central bank’s efforts are doing to manage the economy.

The publication of the Beige Book last September showed a moderate expansion of the economy in general in the twelve districts of the Federal Reserve between July and August. In most districts, consumer spending increased, especially in retail sales and tourism, but with mixed results in vehicle consumption; whilst manufacturing activity expanded modestly.

As for housing and commercial construction, they increased slightly in the twelve districts. In the real estate market, there was a low inventory of houses for sale which affected this market nationwide. Between July and August, positive signs were seen in the energy and natural resources sector before it was affected by hurricanes.

In the labour market, new jobs and salaries increased slightly in most districts. Some analysts indicated that the market was narrow, so many companies had difficulty finding qualified workers in the respective tasks they needed. Some companies from different industries pointed out that they had to lose new business agreements due to the lack of labour. Despite this, most districts reported few upward wage pressures with few exceptions. Added to these problems in the workforce, some inputs in production materials rose in price such as steel, wood and the cost of transport.

In summary, prices increased slightly at the national level. The inputs and material costs rose in contrast to energy prices and agriculture where the results were mixed, showing a weak upward trend.  The real estate market rose due to low supply which led to new equilibria in this market.

Looking at each district of the Beige Book report it can be seen that:

Boston: Reports indicate that revenues in manufacturing and retail sales continued to expand modestly. Prices were stable, and wages increased very little. As at the national level, the housing market did not show good dynamism due to restrictions in inventories. Analysts continued to observe a positive outlook.

New York: The economy moderately increased its growth, and the labour market remained narrow with a limited job offer. Regarding inputs, prices rose moderately. The housing market, as in Boston, did not have a good dynamic, but house prices rose.

Philadelphia: Modest economic growth with some signs of improvement in non-automotive retail sales, housing construction, and commercial stores. In general, new jobs and wages increased, and inflation rose, but only slightly.

Cleveland: Good dynamics in economic activity. Increase in wages. As in other states, the vehicle industry had a negative trend.

Richmond: The economy expanded modestly. Worrying signs were observed in consumer spending and the housing market where no positive trend was seen. Prices increased slightly.

Atlanta: Economic activity improved slightly. Salaries remain stable, while prices increased slightly.

Chicago: Its economic growth slowed down. Employment, spending on consumption, spending on business and manufacturing grew at moderate rates. Salaries and prices increased slightly.

St. Louis: Improvement in economic activity. Analysts expect this trend to continue throughout 2017. Prices increased modestly. They even increased further for this period than in 2016.

Minneapolis: Activity grew modestly. Tourism boosted economic growth in this region. The construction sector also boosted the economy. Prices increased for wages and retail sales, but for other goods and inputs remained stable.

Kansas City: Economic activity increased slightly. Manufacturing and business services expanded slightly. The trend in prices continued to rise, but the trend is no longer so positive. Analysts expect prices to continue rising throughout 2017.

Dallas: As in the other regions, the economy grew moderately. Manufacturing and consumer spending drove growth, in addition to retail sales. Inflation accelerated in August. There is upward pressure on inputs. The price of housing remained stable. The sale of new homes remained stable without significant growth.

San Francisco: Economic activity expanded slightly. Inflation, in general, did not increase and the labour market, as in the rest of the country, suffered supply problems for which companies had problems finding workers. Growth in consumption and business services remained strong trends. Activity in the housing market remained strong.

As mentioned earlier, these reports for each district of the Federal Reserve are made monthly. The conclusions of the November report will be presented in the next part of the article.

Economic activity continued with moderate growth, as indicated in the September Beige Book and the monetary policy reports of the central bank. Reports of consumer spending in retailers and the automotive industry showed mixed behaviour with little growth. Many districts showed growth in the transport sector, and the construction and housing sales sector showed limited growth due to supply restrictions. One aspect that differs from the September report is the more substantial growth in the number of jobs and salaries, although companies continue to complain about the lack of skilled labour, so the market is very narrow.

Most districts reported moderate growth in sales prices and slight increases in input costs, particularly construction materials. Also, an increase in real estate prices added to those in transport. The only sector where the results were mixed was in the agriculture sector where the price trend is not clear. In general, there is still a positive trend in the growth and prices of most districts.

Next, the situation of each district will be explained in the report issued in November.

Boston: Continued growth in economic activity thanks to manufacturing and retail sales. The labour market remains narrow and with few increases in wages. The change in prices is almost nil. In the real estate market, the situation is not very positive given the lack of inventories of houses for sale.

New York: Economic activity expanded moderately with a narrow labour market. The prices of the inputs grew slightly as well as the sale prices. In other sectors such as hotels, prices have remained stable, showing mixed results in this district. The real estate market has retreated a bit, but prices continue to rise.

Philadelphia: Economic growth was driven by manufacturing, non-financial services, and tourism. Commercial and residential construction increased slightly. The downside is the decline in retail sales. In general, wages and prices increased while the number of new jobs was slightly above the previous report’s data

Cleveland: The economy showed a weak performance although production is a bit above the data of the previous report. Due to pressures in the markets, inputs, wages, and prices of sales of goods increased during this period. We observe a real estate market with good dynamics showing better data than in 2016.

Richmond: The economy continued to grow at moderate rates driven by manufacturing and the transportation sector. In this district, the same problems arose as in others with the real estate market as it grew little due to the lack of suppliers. The price growth was too slight.

Atlanta: Economic conditions improved slightly compared to the previous report. The labour market remained very tight which led to a slight increase in wages and a lack of labour supply. The non-labour costs for the companies remained unchanged. Retail sales increased in the district. The sector that contributed most to growth was tourism. The sale of houses decreased, but not their price.

Chicago: Economic activity grew slightly. Manufacturing and new jobs grew at modest rates, but at higher rates than spending on consumption and spending on business. The real estate activity grew very little. Salaries and prices grew very little as in most districts.

St. Louis: The economy improved compared to the previous report. The labour market is still tight, bringing wages up. The outlook is optimistic for analysts in this district, which is a better outlook than for the same period in 2016. Prices continued to grow, but their increase was slow during the last quarter of the year. The behaviour of real estate stagnated compared to the previous report.

Minneapolis: The growth was quite modest. New jobs grew, and so did wages. Manufacturing is one of the sectors with the best projections. The real estate sector performed well. Prices increased slightly in construction materials and prices of fuels sold at retail.

Kansas City: Economic growth was moderate. The manufacturing and business services grew moderately following a good dynamic throughout the year. The consumption expenditure was very flat. Sales prices increased slightly, as did inflation. In general, all sectors showed an increase in prices.

Dallas: The economy grew moderately, and business returned to normal after Hurricane Harvey. Manufacturing and non-financial services continued with good behaviours expanding. Retail sales remained strong. The lack of skilled labour for new jobs is evident, which drives wages up. In general, prices increased in most sectors.

San Francisco: The economy continued to expand at moderate rates. Retail sales grew at moderate rates. Activity in the real estate market remained robust as well as commercial activity. The negative aspect was the behaviour of inflation that was flat without large increases.

Analysing the last report of November and the one of September, we can conclude that the economy of the United States in 2017, as it indicates this monetary policy report, has had a good dynamic in its growth, labour market and in its exports. But also, as you can see, each district shows that the increase in monthly inflation in most places has been low, so this affected the decision of the bank on whether it was convenient to raise interest rates or leave them unchanged. At the end of the year, it is acknowledged that the FED has raised the rate three times in the year, but there were certain doubts in each meeting about what the bank was going to carry out.

Despite the overall good performance of the economy, as could be seen by breaking down each district, it is important to highlight how prices have had downward pressures, which does not agree with the projections that were made at the beginning of the year. That, added to a labour market that performed well, with a good dynamic, and low rates of unemployment, but it is increasingly difficult for companies to find available skilled labour, and this has led to an increase in wages in almost all districts.

In conclusion, the United States and its districts are in a boom phase with prosperous sectors such as manufacturing, retail sales, tourism among others that have boosted economic growth. Analysing the main districts, the main problem is inflation, which does not grow at high rates. In addition to the real estate market, which, even though its prices rise in most places, its dynamics are quite limited due to the low supply of housing for sale; which has led to this price increase.

©Forex.Academy