
Technical Overview
The US Dollar Index (DXY) continues bouncing in the extreme bearish sentiment zone, testing the resistance at 90.983. The breakout of this resistance level could lead to expect further upsides in the following trading sessions.

The following figure shows the US Dollar Index in its 8-hour timeframe exposing the mid-term market participants’ sentiment unfolded by the 90-day high and low range, revealing the bearish trend’s exhaustion. In this context, the surpassing of the next resistance at 90.983 could warn about the Greenback recovery, which could boost the price until the next resistance is located at 92.236. Likewise, the exhaustion could imply the consolidation of the bearish trend.
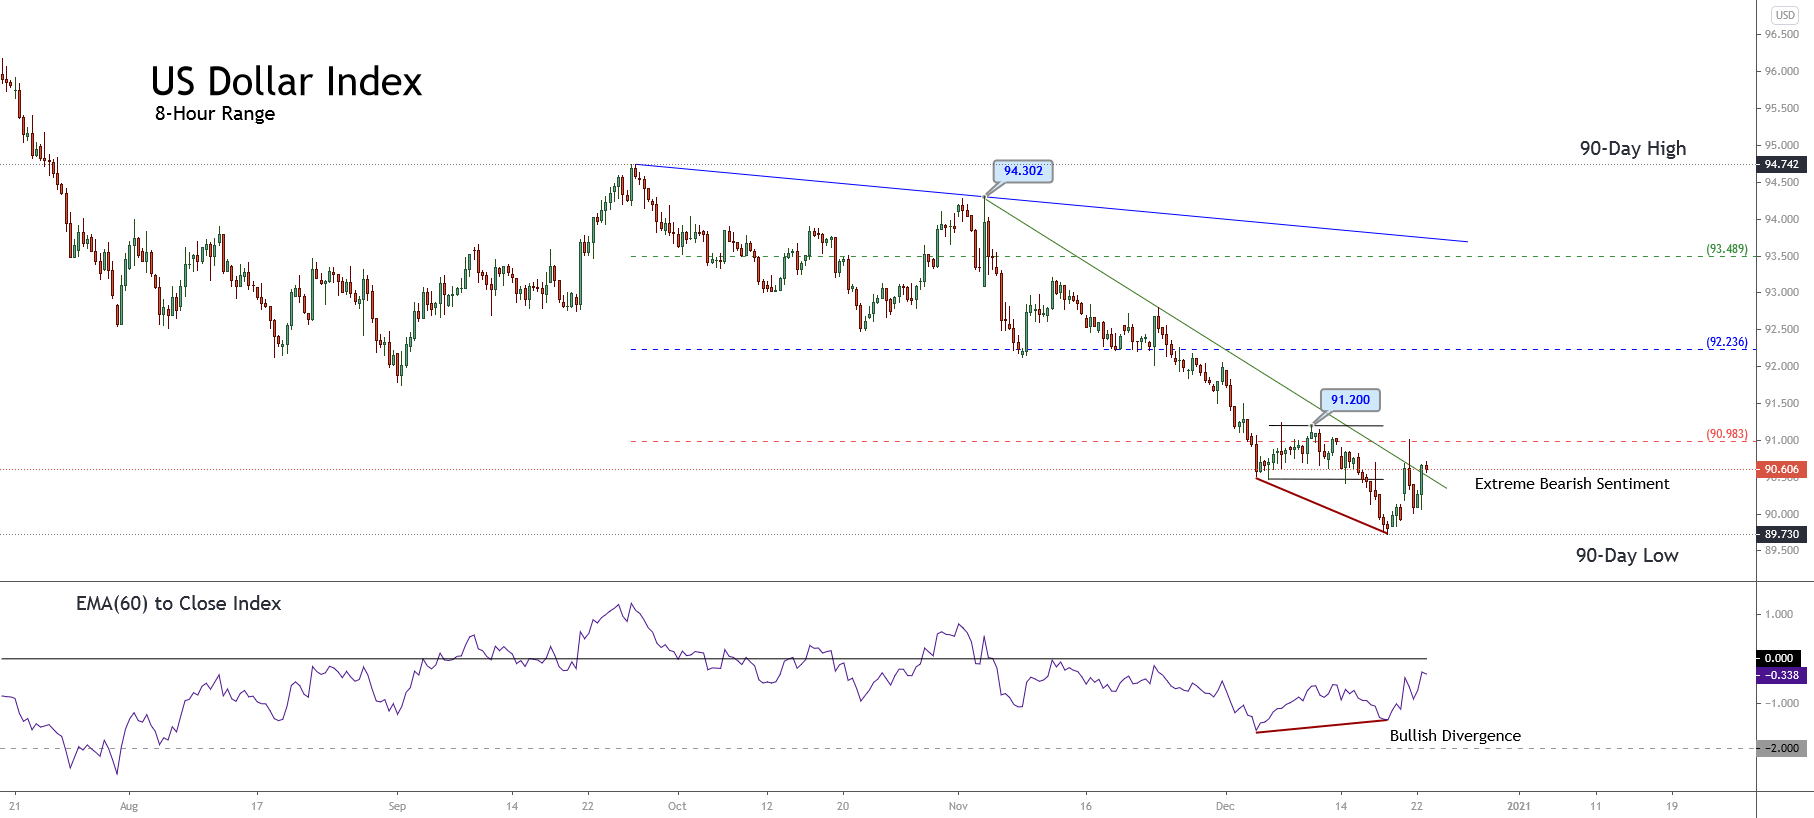
On the other hand, the primary mid-term trend plotted in blue shows the bearish pressure that remains in progress and the current since DXY found resistance at 94.742 on September 25th. Likewise, the secondary trend identified with the accelerated green downward trendline shows a pause of the short-term downtrend started at 94.302 on November 04th. In this context, the pause in progress represented by the rising minor trend could develop a limited rally, which could carry the price to test the precious swing at 91.200 reached on December 09th.
Technical Outlook
The short-term Elliott wave view for DXY exposed in the next 4-hour chart reveals the end of the bearish wave ((iii)) of Minute degree labeled in black and the start of wave ((iv)) of the same degree, suggesting the possibility of a corrective rally, which could take until January 20212.
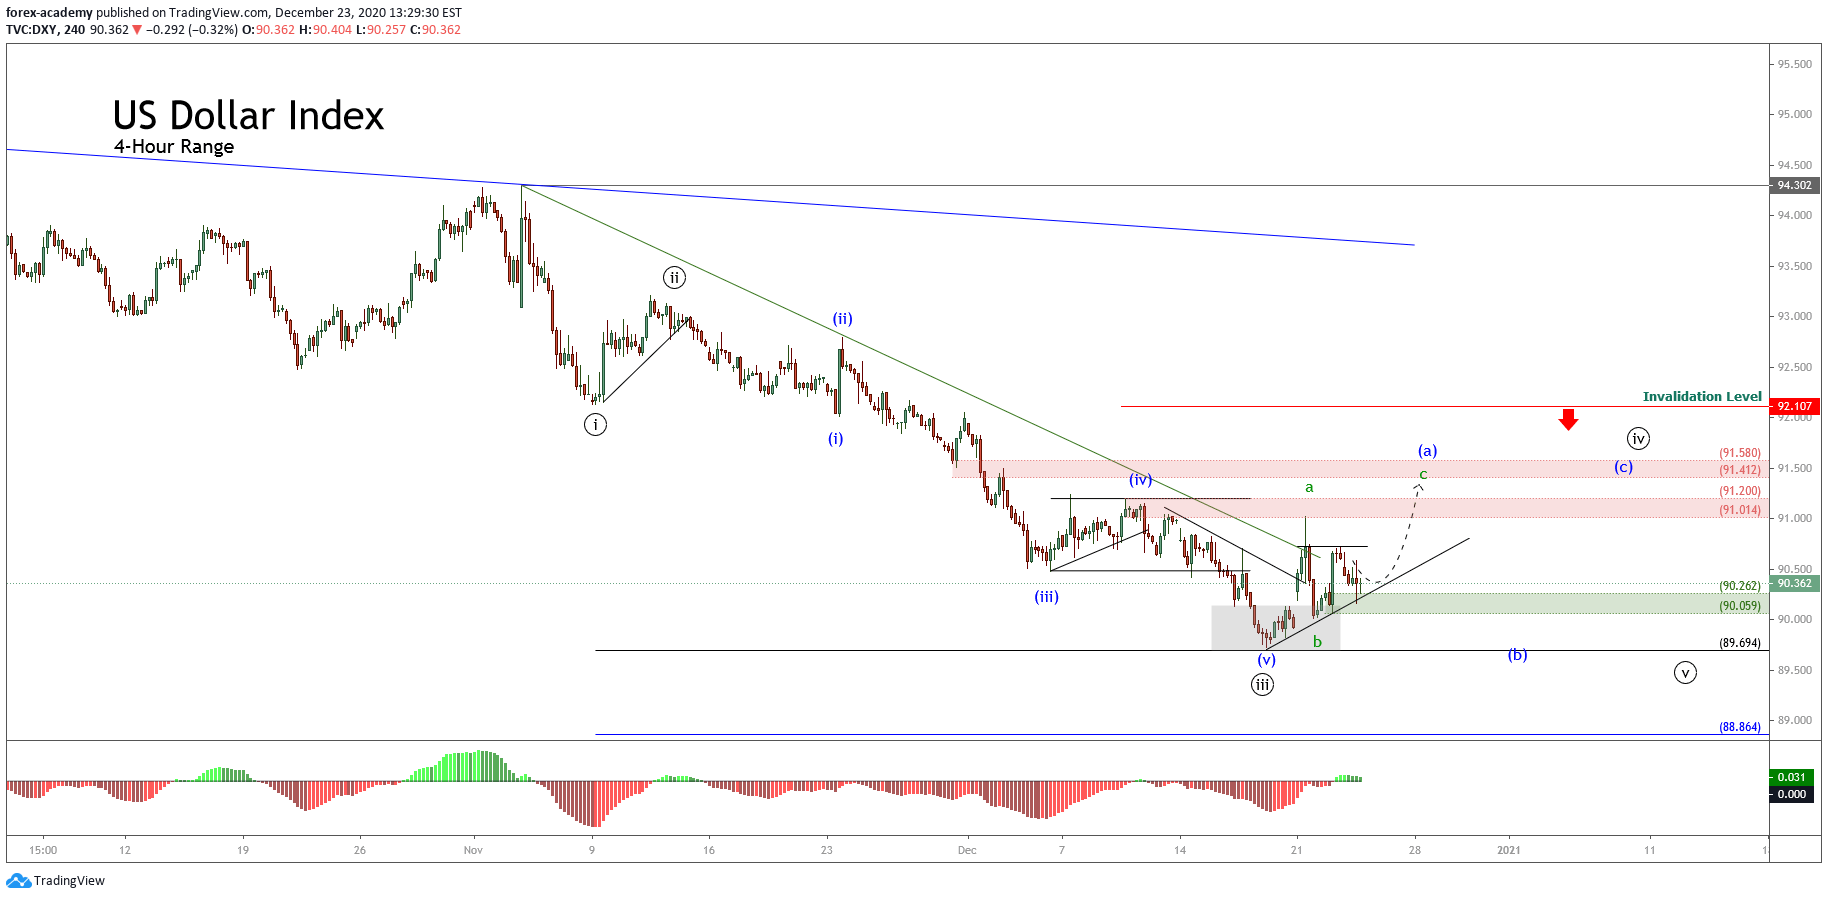
From the previous chart, we distinguish the start of wave ((iv)) identified in black, which began when DXY found support at 89.73 on December 17th, ending the third wave of Minute degree labeled in black. Likewise, the price action surpassed the short-term downward trendline plotted in green, suggesting the bearish sequence’s exhaustion that began at 94.302 on November 04th.
With the short-term trendline piercing, DXY developed the first segment of a corrective wave of Subminuette degree identified as wave a labeled in green, which found resistance in the supply zone between 91.014 and 91.200. Once topped at 91.018, the Greenback retraced, developing its wave b of the same degree, which found support in the intraday demand zone between 90.262 and 90.059.
The textbook suggests that the price action should develop a third move identified as wave c in green, which could advance until the next supply zone bounded between 91.412 and 91.580. Once the US Dollar Index completes the third segment, the Greenback will complete the wave (a) of Minuette degree identified in blue corresponding to the first segment of the wave ((iv)) in black.
In summary, the US Dollar Index looks starting to develop the first segment of the fourth wave of Minute degree, suggesting the pause of the primary trend’s downtrend, which could last up until January 2021. In this regard, DXY currently found temporary support at 89.730, and the price could develop a new decline corresponding to the fifth wave of Minute degree. The potential next decline could pierce the previous low, being its potential next bearish target located at 88.864. Finally, if the price action surpasses the invalidation level placed at 92.107, the Greenback could start to show recovery signals, which could carry to expect a bullish reversal move.