Categories
Forex Market Analysis

Ibex 35 Remains Under Bearish Pressure

Overview

The Spanish index Ibex 35 during this year underperforms over 25% (YTD). This negative performance observed during 2020 added to the price action moving below the 200-day moving average, leads us to see to Ibex 35 in a bear market. The bearish market sentiment is confirmed by the technical outlook that drives us to foresee more declines.

Market Sentiment Overview

In 2020, the Ibex 35 index moves mainly bearish after toped at 10,100.20 pts in mid-February, where the Spanish stock market began to decline in a massive sell-off that led it to lose over 42% in mid-March when the price found a bottom at 5,814.50 pts. Until now, Ibex 35 accumulates a loss that reaches 25.78 % (YTD), locating it into the bear market category.

On the other hand, the Ibex 35 prices, in its daily chart, exposes the price action moving mostly sideways below the 200-day and 60-day moving average. This market context, added to the consolidation movement below the 50% of the 52-week high and low range, leads us to observe that the Spanish stock market maintains its bearish pressure.

Summarizing, while the price action continues moving below the 200-day moving average and below 7,957.35 pts, the market sentiment of Ibex 35 will remain on the bearish side.

Technical Analysis Outlook

The long-term overview of Ibex 35 illustrated in its 2-week chart and log-scale, reveals a bearish sequence that began in early November 2007 when the Spanish index toped in its all-time high and found fresh sellers at 16,040.40 pts remains intact. 

The descending channel observed in the previous chart and the price action consolidating below the pivot level at 7,992.7 pts, leads us to maintain our bearish bias for the Spanish index. At the same time, the pierce below March 2020 low located at 5,814.50 pts could drive to Ibex 35 toward new lows. The potential declines could find support at 5,266.90 pts and even could extend from to 3,980.50 pts until 3,669.40 pts; this range coincides with the base-line of the descending channel and the reaction levels observed on January 1994 and August 1996.

The next figure illustrates to Ibex 35 under the Elliott wave perspective. The Spanish index moves sideways developing an incomplete triangle pattern (3-3-3-3-3) corresponding to wave ((B)) of Primary degree labeled in black of a wave II of Cycle degree that maintains in progress since Ibex 35 found sellers at 16,040.40 pts on early November 2007.

The potential next decline corresponding to wave ((C)) of Primary degree could drive the price to fresh lows, which has identified three possible support levels. These levels extend from 5,266.90 pts, following until 4,291.40, and could extend toward 3,669.40 pts. 

Finally, once completed the pending bearish five-wave sequence, Ibex 35 should finalize the wave II of Cycle degree, and in consequence, the Spanish stock market should start a new long-term rally of the same degree


Categories
Forex Market Analysis

Dow Jones – Long-Term Technical Overview

This year, The Dow Jones Industrial Average performance went down more than 36% during the first quarter collapse that dragged to the global stock market. Although the recovery experienced by the Industrial Average after March 23th keeps its performance on the negative side, the DJ-30 index could still reach a new all-time high.

Market Sentiment Overview

During the first quarter of 2020, the Coronavirus spread attained the status of a global pandemic, which triggered an economic crisis, originated from a worldwide lockdown. The economic context took down the stock markets. In particular, the U.S. stock market led the Industrial Average to plummet until the 18,213.5 pts, its worst level since November 2016. 

Once Dow Jones found support in its lowest level of the year, after losing over 36%, the Industrial Average began to recover partially from of its losses, advancing near 49% from its March’s low to date.

Under this context, the upper figure illustrates the Dow Jones moving in the 52-week high and low range’s strong bullish sentiment zone. At the same time, we distinguish its price moving above the 26-week moving average, which leads us to anticipate more advances in the short-term.

On the other hand, the Institutional Net Positions (green curve) informed in the latest CFTC report unveils that the speculative bull traders increased their positioning on the long side. However, the institutional sentiment remains on the bearish side.

In summary, the short-term sentiment remains on the long side. In this context, a potential recovery could make it advance toward the 28,595.2 pts, which corresponds to the opening price of 2020. On the other hand, if the Dow Jones Industrial Average develops a new bearish movement, the next key supports are located at 26,749.9 pts and 23,904.4 pts.

Elliott Wave Outlook

Under an Elliott Wave perspective, the big picture of the Dow Jones Industrial Average reveals its advance on an incomplete fourth wave of Primary degree identified in black.

The current bull market began in early March 2009, when the Industrial Average found fresh buyers at 6,466.6 pts. In the next figure, we distinguish that the third wave corresponds to an extended movement, which ended in early February when the Blue Chip U.S. stock market index found resistance at 29,595.3 pts.

Currently, the Dow Jones index advances in its fourth wave of Primary degree, which progress on its wave (B) of Intermediate degree identified in blue. On the other hand, we noticed that the second wave (identified in black on the left of the chart) developed a simple correction in a brief lapse of time. In this context, and considering the alternation principle, the fourth wave should be a complex correction that should take longer than the second wave,  for instance, in the form of a triangle formation, or a double three pattern. After this corrective wave formation, the price action should continue the bullish trend developing a fifth wave of Primary degree with a potential target at the psychological barrier of 30,000 pts.

Finally, with the completion of the five-wave upward sequence of Primary degree, the Industrial Average would complete a motive wave of Cycle degree. Hence, the end of the current bull market will give way to a downward corrective sequence in three waves of Primary degree.


Categories
Forex Forex Risk Management

Swing Trading ATR Risk Management Guide

Risk is essentially one of the crucial factors which have the power to endanger your entire forex trading career. Understanding how poor judgment and unsafe decision-making can impact individual accounts is key for all traders, be they at the beginning of their trading experience, or be they professionals. Because of the topic’s profound importance, this article will also discuss how each trader should address limits or at what point they should stop investing more money. Besides stressing the need for developing a wise and safe approach, we are going to provide practical advice on how to use the ATR indicator in order to assess risk levels in your trading and help you analyze how much pip value you should use in every trade. In addition, you will find out how many trades should be open at the same time as well as discover a comprehensive list of instructions that will save you from overlooking any high-risk aspects of swing type trading in the fiat market.

Processional traders often point out the importance of creating a detailed plan which naturally includes thorough risk assessment. A great number of traders nowadays appear to be focused on trade entries alone, which repeatedly leads to one of the three outcomes – a severe money loss, a break-even, or a barely significant gain. Such an approach neither allows these traders to grow their trading skills and reach the expert level nor does it help them build their finances as they imagined at first. Therefore, to prevent yourself from making the very same mistake as the majority of traders who experienced the above-mentioned scenarios, you need to take an entirely different approach to swing trading and invest in learning about the steps successful traders take to maintain their trading expertise and financial abundance.

Before proceeding to what makes a successful trader, let us first examine the choices that can hinder a forex trading career. Primarily, most of those who fail at forex either do not have a set risk or they opted for a random number without any prior logical analysis. The risk involved in trading is, in this case, a rather loose category as it depends on how traders feel, whether the previous trade was successful, upcoming news events, and other transient factors. To make matters even worse, this group of traders frequently does not stop after a loss, but they continue on to chase another win, thus entering a vicious circle of illogical thinking, occasional wins, and great losses.

When a trader does not include risk in trading, this individual inevitably imperils his/her account. We often see how a trader loses 20% of their account and believes that immediate return to the initial break-even point is possible. This, however, is highly unlikely considering the fact that such percentage equals some of the most successful traders’ average annual return. Bearing in mind the factors that led them to this stage, the probability of these traders suddenly becoming that good is very low. Unfortunately, despite it being a very common scenario, this challenge is one of the most difficult to surpass. Therefore, if your value dropped by half, from 50 to 25 thousand USD for example, you would actually need a 100% return just to get to your break-even, which is very much impossible at this point.

In case you are facing a similar problem, the best step you can take is to withdraw from trading, start all over again, and learn more about this market. This is such a specific situation and such an important signal that some traders should consider moving on to some other markets or businesses. Having this outcome directly indicates that a trader has not developed the necessary mindset which this particular market requires. Both reckless trading and the timid one may equally endanger your account because the risk can never be too high or too low in the forex market. Even if you managed to increase your account by 4% in a single year, it would still not be good enough if you had to go at great lengths to achieve this. Traders need to find that right balance and also think of some other factors, such as time, effort, and profitability, because there may be a safe but much easier, faster, and more lucrative way to seeing your finances grow.

This market is not risk-free, so it all boils down to the question of whether doing trading has a point. If you see that your finances are not developing accordingly, you may consider doing demo trading to learn how to set risk sensibly. If you have yet to do demo trading, you should bear in mind that this will help you build your system, psychology, money management, and trade management skills so that your account reflects these in a positive way and that you can transfer and exhibit the same level of skillfulness in real trading. Both demo and real trading, however, should not be void of risk since the most prosperous traders take many risks, but they know how to manage them properly, successfully minimizing the chance to fail. Consequently, the word risk does not imply that you are acting carelessly, but that you are intelligently assessing where you can invest to have financial benefits.

As risk is a necessary part of this line of business, but also the one that we need to control, we have to consider which percentage of the account any individual should be trading. Most of the available sources advise traders not to go above 2% of their entire trading accounts on each trade. Nevertheless, what this means is that the suggested percentage is the maximum limit, not the average one. While your stop loss should always reflect this, you can feel at ease knowing that most losses rarely exceed this amount. So, if you have 50 thousand USD, the 2% value would equal 1000. Although this may seem like a large quantity of money, and thus a large amount to risk, we need to understand that timid trading will not get you far and that you will not lose the entire thousand even if you happen to fail. Therefore, what understanding risk means is that every trader should allow themselves the opportunity to take risks, but also apply a strategy to minimize those risks.

To successfully track and control the risk level, you can always rely on the ATR, an indicator that tells traders how many pips on average a currency pair moves from the top to the bottom of the candle. While this tool cannot exactly predict the future, it can assist traders with money management, seeing how a currency pair is moving at present and what direction it may take later. Some of the best traders in this market suggest that the stop loss should be set at 1.5 times the ATR (default MT4 settings) value at the moment of position opening to see the greatest benefits, on the daily timeframe. Therefore, if a currency pair’s average true range (ATR) is 80 pips, the stop loss should be 120 pips away from the current price. With the help of this tool, you will always be able to set your stop loss and secure your trading, although once your profit starts to accrue, this limit is going to change.

How can we find out what the pip value is going to be? Even though we cannot expect to have the same pip value across the chart, what you can do is see how much the 2% of your account actually is. As the account will keep increasing and decreasing in value, the risk limit is naturally going to follow these oscillations. Afterward, we will need to count the 1.5 ATR of the currency pair and put the stop loss there. The last step to take here is to divide the risk (a dollar amount) by the 1.5 ATR (pips amount) to learn how much money you should put per pip on each trade. You can rely on this simple calculation for each trade you enter and apply it in your daily chart to get specific insight and information.

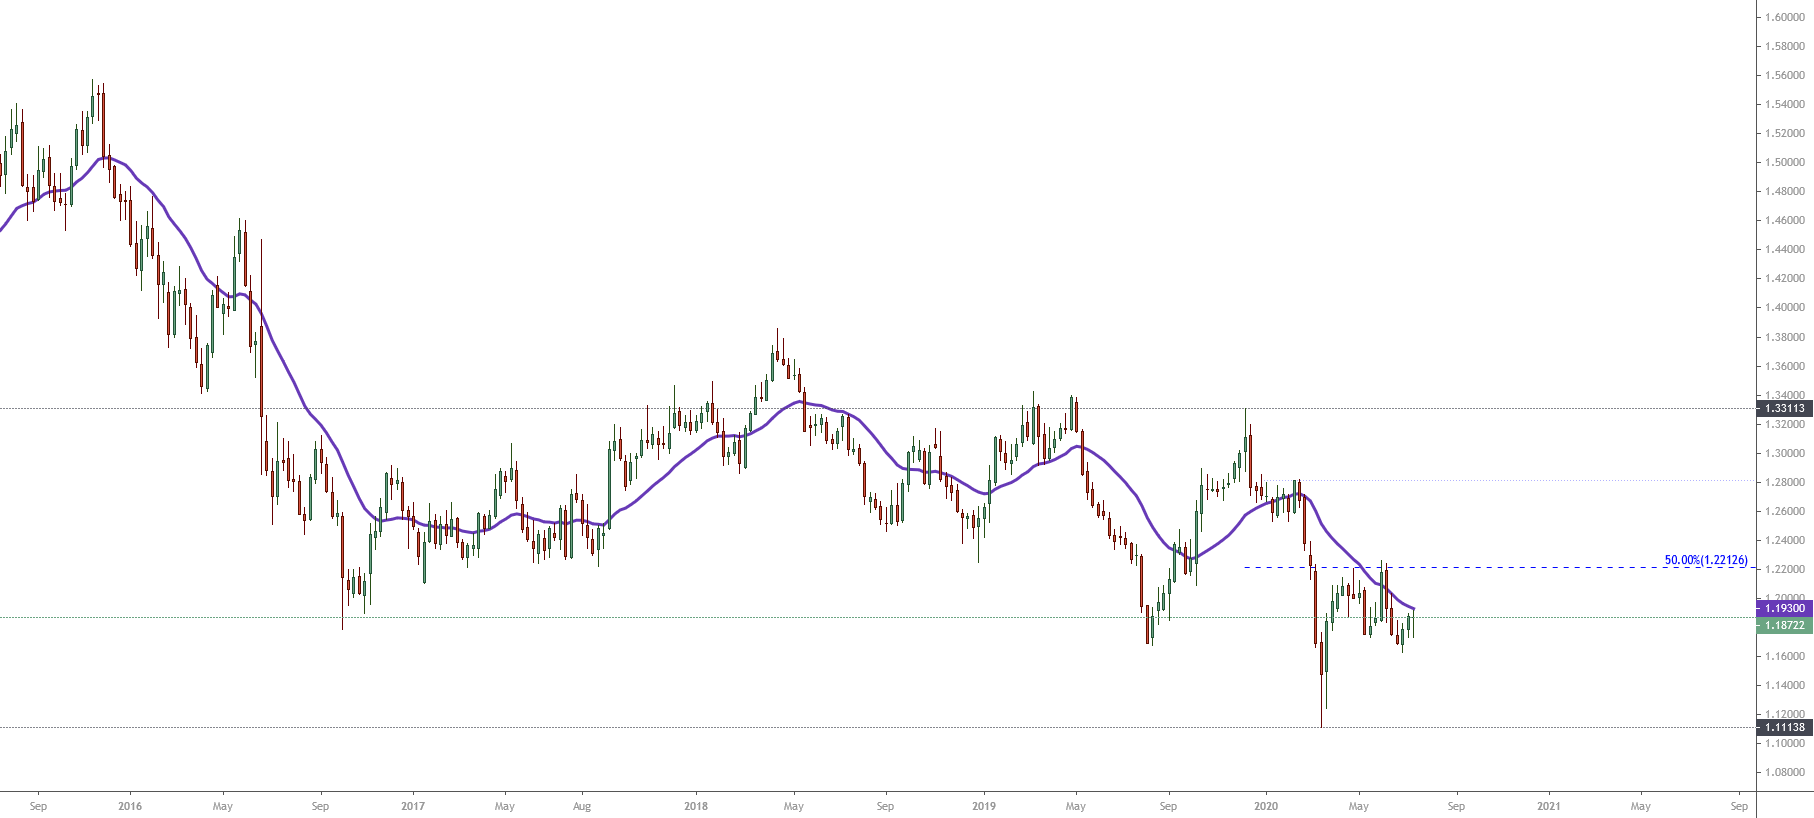
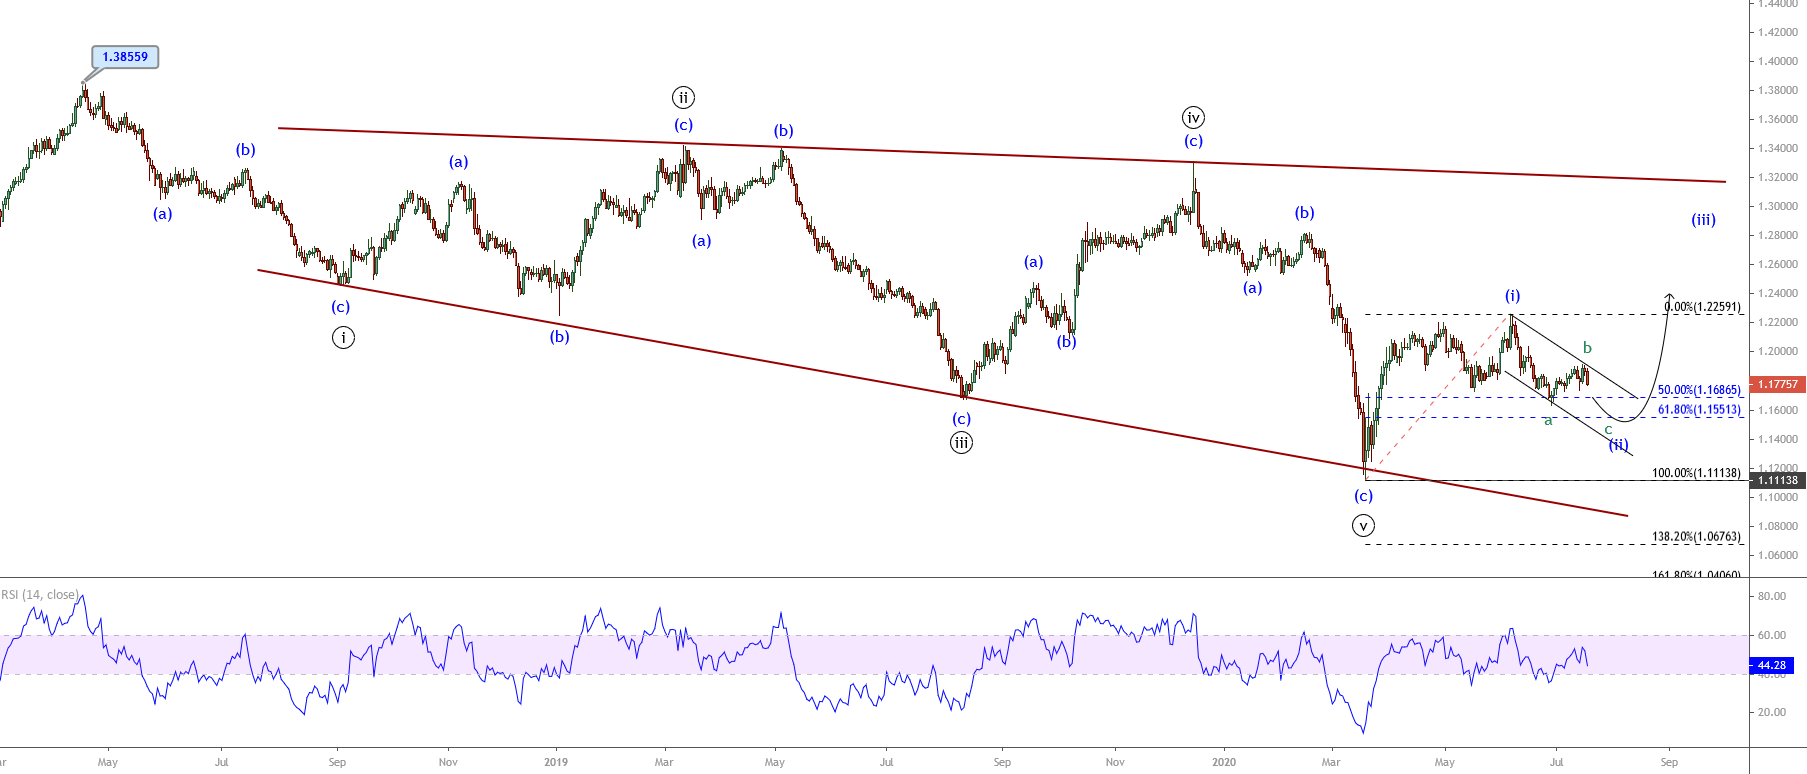
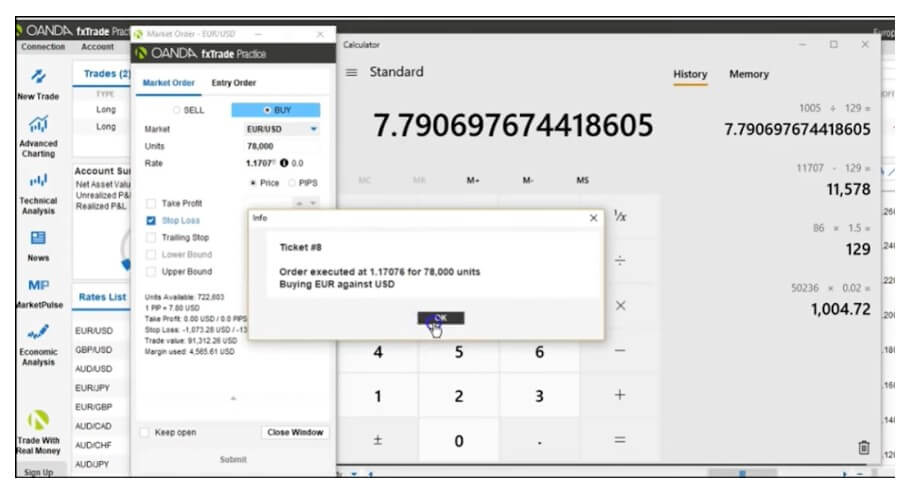
Most trades do not involve exact numbers, so let us say that your net account value is 50,263 USD. To estimate the risk, you will multiply this number by 0.02. Upon calculating the 2% of the account (roughly amounting to 1005 USD), we will seek the currency pair we want to trade and find the ATR only to multiply it by 1.5. If your ATR is 86 as in the example below, you should get a pip stop loss of 129.

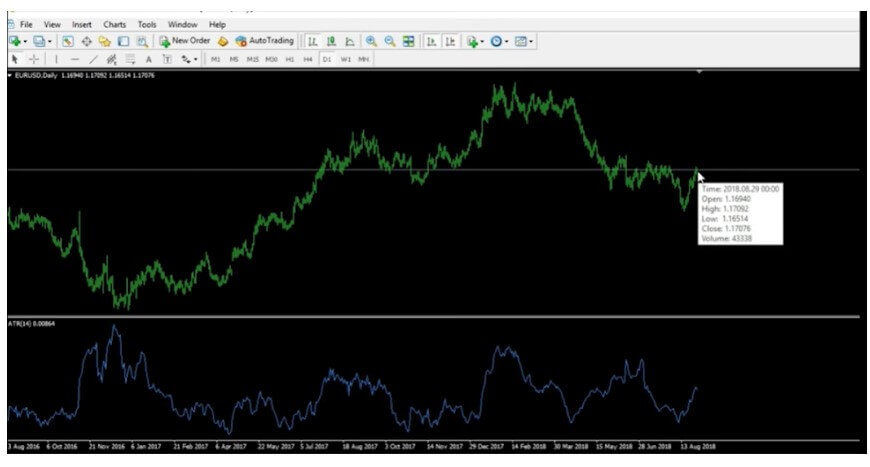
If you focus on the tip of the pointer, you will see that the price is at 1.1707. We can, in this case, decide to go long, which is why we are going to use this number and deduct 129 (we would do addition if we were going short) to learn where we should enter the stop loss order. Finally, we are going to calculate the pip value by dividing 1005 by 129, which approximately equals 7.7 USD. After acquiring the necessary information, we know that one pip equals $7.7, so we can estimate that the trade unit value should be 78,000 for the EUR/USD currency pair, or 0.78 lots. We will insert the stop loss afterward and enter the trade, as shown in the image below. Note that in the MT4 platform you can use different tools published on the MQL 5 market for this purpose to automate the whole process. There are even some EAs. If you want to really get this easy, try to use Tipu Stops and IceFX Trade Info panel so everything is precalculated for each asset. Just use the drag option to the Stop Loss line on the chart.

While this is a secure way to assess risk, you should always look for the right indicator which will signal you to exit bad trades on time. What is more, you should previously make use of an indicator that can tell you that you are on the right path and inform you that you should stop trading before your price hits your stop loss. By researching and creating your own indicator algorithm, and combining these confirmation and exit indicators as well, you will successfully trade in this market and mitigate the amount of incurring risk.

In terms of how many trades we can do at the same time, the information provided by professional traders suggests that any individual can enter as many trades as they want under the condition that the 2% rule is applied. However, we should also be mindful of the fact that the same currency is not to be traded more than once at the 2% risk. Even if your chart is signaling that you should be investing in a particular currency, you should not by any means be investing in several pairs involving this particular currency (e.g. EUR/USD, USD/JPY, and AUD/USD) long or short at the same time. Should you fail to abide by this rule, you will suddenly have 6% of your account on this one currency (USD) and, having done this, you have actually taken on too much risk all at once. In case this currency goes the opposite direction, you may be damaging your account to an irreversible extent.

Therefore, despite the fact that this approach has been used by various professional traders, you may want to pay close attention not to fall for the trap of over-leveraging. To avoid making this mistake, you should always follow the first signal for that particular currency. Should you, then, receive a long signal on the EUR/JPY pair and another long signal on the EUR/AUD one, you should opt for the one you saw first and follow through. Although we may see the opportunity and potential financial rewards, sometimes less is more in this world. Having said this, you can also apply the half-and-half approach and put 1% on each pair, which can almost function as a hedge saving you from loss should one on the pairs fail to bring you profit. You may also decide to take half the risk and wait for another trade as you can see some favorable progressions coming your way soon, which is not something professionals would advise you to do very frequently because you may be stopping yourself from earning sufficiently by trading timidly.

Risks have often been disregarded as inherently bad, but in the world of forex trading, we know that they are unavoidable and necessary to make a profit. By adopting these practical steps in your everyday trading, even if you are doing demo trading now, you will learn how to set the risk level properly, without protecting you too hard from failure or playing recklessly. A smart trader is thus not the one who fears risk or casts it away as an unimportant factor, but the one who deals with it effectively, applying the strategies discussed in this article intelligently and consistently.

Categories
Forex Market Analysis

Gold Hits a New Record High

The Gold price opened the current trading week to reach a new all-time high at $1,987.95 per ounce, approaching the psychological barrier of $2,000 per ounce. 

Market Sentiment Overview

During this year, the precious metal reports an advance over 31% (YTD), boosted by global recession concerns. The safe-haven metal has increased its value at a similar pace of the descents on the worldwide growth rate. A fact that reduces the possibility of an economic recovery in the near term.

In its weekly chart, the yellow metal exposes the bullish momentum that sent the price over September’s 2011 high at $1,920.24 per ounce, climbing to $1,987.95 per ounce this week.


On the first chart, we distinguish the price moving in the strong bullish sentiment zone of the 52-week high and low range, where we observe the precious metal reaching fresh highs. Simultaneously, the price action continues moving above the 26-week moving average, showing that the bullish bias remains intact. The separation between the moving average and price leads us to conclude that Gold is in an overbought stage. This condition may carry the precious metal to begin a corrective movement.

On the other hand, the Institutional Net Positioning – green curve at the bottom of the previous image- shown by its latest CFTC report, reveals a decrease in the speculative positioning,  decreasing by 11.12% (WoW) compared with the previous reading. This decrease exposed in the following figure illustrates the institutional net positioning moving bellow the 13-week moving average. 

Summarizing, although the price action continues reaching fresh all-time highs, the big participants’ actions reveal a take-profit activity on their long-side positioning, which could be being helped by an extreme bullish sentiment on news media.

Elliott Wave Outlook

The short-term Elliott wave  Gold’s perspective unveiled in its 2-hour chart reveals the price moving in a terminal structural series corresponding to an ending diagonal pattern. This technical formation comes after the price rallied, developing a third extended wave of Minuette degree identified in blue.

The bullish cycle that remains intact began on June 05th when the yellow metal found fresh buyers at $1,668.30 per ounce. The impulsive sequence observed in the previous chart, reveals its advance in a third extended wave, which topped at $1981.20 per ounce on July 28th, where the price retraced from, completing its wave (iv) of Minuette degree identified in blue. 

Once the fourth wave in blue was completed, the price of Gold advanced in the current fifth wave of Minuette degree, showing an internal structure that looks like an ending diagonal pattern. This Elliott wave formation warns us about the potential reversion of the bullish trend. Although it will likely decline short-term, Gold’s bias remains on the bullish side as long as the price stays above $1,907.20. However, if the price breaks and closes below the base-line ii-iv of the ending diagonal, the yellow metal could visit the $1,907 level as its first relevant support.

Categories
Forex Market Analysis

US Dollar Index – Technical Overview

The US Dollar Index (DXY) jumps on Thursday trading session after the FED’s policymakers decided to keep unchanged the rate at 0.25%

Market Sentiment Overview

In its weekly chart, the US Dollar Index exposes a downward movement with an accelerated bearish momentum that brought it to decline for the sixth week in a row, falling to its lowest level since mid-June 2018 when the DXY found support at 93.19.


The price action observed in the 52-week high and low range places DXY in the strong bearish zone. This market context leads us to expect more declines in the long-term. Simultaneously, in the short-term, we could see a limited recovery, which could find resistance at the 95.67 zone.

From an institutional activity perspective, the net positioning informed by the COT report released by the CFTC last Friday, reveals that speculative traders (green line) continue favoring a bearish-side positioning. 

In consequence, the long-term market sentiment for the US Dollar index remains bearish. At the same time, a short-term recovery could signify only a retracement of the primary bearish trend.

Elliott Wave Outlook

The short-term Elliott wave perspective for DXY illustrated in its 4-hour chart reveals the advance in a bearish trend that began on the last March 19th high at 102.99. Once the Greenback found fresh sellers, the bearish market participants took the price down in an incomplete descending sequence.

In the figure, we observe the US Dollar index moving in an incomplete wave ((c)) or ((iii)) of Minute degree labeled in black. At the same time, the price advances in its wave iii of Subminuette degree identified in green, this move belongs to the fifth wave of Minuette degree labeled in blue, which began on June 30th when the price made a lower high at 97.80.

Although the third wave in green touched the bearish target area located in the blue box and started to bounce, there is no evidence to support the end of the bearish cycle. Neither does the bullish divergence observed on the RSI oscillator bring us a signal of exhaustion or reversal trend. On the other hand, considering the alternation principle and that the current bearish movement has strong downward momentum, the fourth wave in green should likely evolve as a sideways sequence, possibly as a triangle pattern. This technical formation could find resistance at 94.65, corresponding to the last March 09th low. Even, the move could extend until the 95.72 level, where the price might reverse towards the primary bearish trend.

In summary, the US Dollar index currently runs in a bearish five-wave sequence, which seems incomplete. There exist a possibility that the Greenback starts to develop its fourth wave of Subminuette degree identified in green, which could find resistance in the area between 94.65 and 95.72. The current bearish scenario will be valid as long as the price stays moving below 96.37.


Categories
Forex Market Analysis

Russell 2000 Technical Overview

The U.S. stock index Russell 2,000 and the S&P 500 shows a divergence in its long-term trend. While the S&P 500 reaches fresh highs recovering from its 2020’s losses, the Russell 2000 index remains negative.

As the previous chart illustrates, Russell 2000 continues moving below its 24-month moving average while the S&P 500 already moves on the bullish side. This market context could lead Russell 2000 to see more declines in the coming weeks, although, currently the short-term bias is still hinting to further advances.

Market Sentiment Overview

This year, the index that groups the 2,000 most prominent small-cap U.S. companies sheds near 11.5% (YTD), dragged by the pandemic lockdown.

The following chart exposes to Russell 2000 in its daily timeframe. On the figure, we distinguish the price moving above the 60-day moving average, which leads us to conclude that the short-term bias still remains on the bullish side.

At the same time, from the 52-week high and low range, we note the price action continues moving bellow the 1,523.65 pts, which makes us hold our bullish bias. In this context, the possibility of a strike over the 1,523.65 pts could reveal an extreme bullish sentiment on the Russell 2000 index.

On the other hand, the absence of a bearish reversal pattern discards, for now, the probability of a plummet in the U.S. stock market.

Elliott Wave Outlook

The short-term Elliott wave perspective of the Russell 2000 index exposed in its 4-hour chart reveals the recovery experienced by the U.S. stock market from last March 23rd when the price found fresh buyers at 963.62 pts.

In the previous chart, we observe a first five-wave structural sequence corresponding to a leading diagonal pattern identified as wave ((a)) of Minute degree labeled in black. The first five-wave sequence topped at 1,376.52 pts where the price started to develop a corrective move in three waves corresponding to wave ((b)) in black, which found support at 1,177.26 pts on May 14th.

Once the second wave ended, the price began a new rally, which remains in progress. After the third wave of Minuette degree labeled in blue, Russell 2000 developed a correction identified as a triangle pattern. After the breakout of the upper guideline b-d, the U.S. index resumed its short-term upward trend.

Currently, the price action remains consolidating in a wave ii of Subminuette degree identified in green. In this context, the RSI oscillator continues moving above the 40-level, which leads us to confirm the retracement and the bullish bias of Russell 2000.

Finally, the upward continuation could drive to Russell 2000 toward 1,590.42 and even extend its gains until 1,702.17 pts. On the other hand, the bullish scenario will remain valid while the price continues above 1,377.25 pts.

Categories
Forex Market Analysis

NZDJPY Shows Long-Term Bullish Signals

The NZDJPY cross continues its recovery after the massive sell-off that made it lose over 18.6% in the first quarter of the year when it plummeted until 59.49. From this yearly low, NZDJPY raised near to 17.9% to date.

Market Sentiment Overview

The market sentiment of NZDJPY exposed in its weekly chart reveals the market action showing bullish reversal signals after surpass and consolidate above the 26-week moving average. 

At the same time, we observe that, last week, the price closed in the upper zone of its 52-week range. This context leads us to conclude that the market participants might continue pushing the price higher.

The following figure shows the net positioning of the New Zealand Dollar and Japanese Yen futures. In the chart, we observe that institutional participants maintain a bullish pressure on the kiwi. At the same time, big participants on the Japanese currency continue having a net positioning to the long-side under 50% of the 52-week high and low range.

Consequently, considering the market sentiment on both the NZ Dollar and Japanese Yen futures, we could expect more upsides for the NZDJPY cross.

The Elliott Wave Outlook

The long-term Elliott wave perspective of the NZDJPY cross illustrated in the following chart shows a bullish structural series in progress. The upward sequence began on March 18th when the cross found fresh buyers at 59.49, where the price action developed a V-turn bounce movement.

Once the NZDJPY cross started its bounce movement, the price began to develop an impulsive sequence subdivided into five internal segments of the Minuette degree identified in blue. According to the Elliott wave theory, the structural series drawn by the NZDJPY cross corresponds to a leading diagonal formation, which tends to appear in the first wave of an impulsive sequence or corrective structure. This pattern usually follows an internal structure subdivided into 3-3-3-3-3 or 5-3-5-3-5.

After the leading diagonal completion on April 30th, high at 66.103, when the cross ended its wave ((i)) of Minute degree identified in black, the price made a higher low at 63.46 on May 17th corresponding to its wave ((ii)). Once this second wave ended, the NZDJPY cross began to rally on the wave ((iii)), which remains incomplete.

Currently, the NZDJPY cross advances in its wave (iv) of Minuette degree in blue of the incomplete third wave of Minute degree.

Our outlook for the NZDJPY cross, based on the Elliott Wave perspective, anticipates a limited decline into five waves, which could complete the wave (iv) of the Minuette degree in blue. Once this sequence ends, the market action should find fresh buyers expecting to continue pushing the cross higher. This way, the NZDJPY cross should complete the wave ((iii)) of Minute degree.

Considering that the next movement will correspond to wave ((iv)) of Minute degree, we could expect the price moving mostly sideways before starts climbing on its fifth wave of Minute degree.

Finally, considering that the market sentiment reveals an increasing bullish momentum for the New Zealand Dollar, and the Japanese Yen exposes a neutral bias that seems to start turning bearish, long-term, NZDJPY could experience more rallies.

In consequence, our preferred positioning for the NZDJPY cross still remains on the bullish side. Any time the price drops could be an opportunity to join the long side.

Categories
Forex Market Analysis

GBPCHF Could Start a New Bullish Cycle

The GBPCHF cross during this year underperforms over 7.3% YTD easing over 940 pips. Although the market action made it decline until lower levels since 2011, the cross could experience a recovery that could propel it toward fresh highs.

The Market Sentiment

The GBPCHF cross in its weekly chart illustrates the price moving below 50% of the 52-week high and low range, which reveals that market participants maintain its bearish bias for the cross. At the same time, we distinguish the 26-week moving average acting as dynamic resistance at 1.19298.

On the previous chart, we distinguish a bearish sequence that began in mid-November 2016 when the price topped at 1.5572 and looked ended on last March 19th, when the cross found support at 1.1113. Once the GBPCHF dropped until the lowest level since August 2011, the price bounced, finding a short-term resistance in the zone of 1.2212, which coincides with 50% of the 52-week high and low range.

During the previous two weeks until now, the market action moved it down, finding resistance at the 26-week moving average, which leads us to conclude that bear traders still maintains the market control.

Consequently, while the GBPCHF keeps moving below the 26-week moving average, the market sentiment bias continues being bearish.

The Elliott Wave Outlook

The GBPCHF cross under the long-term Elliott wave perspective exposes a broadening diagonal formation that began on April 17th, 2018, when the price found fresh sellers at 1.3855.

In the previous figure, we distinguish an expanding sequence that follows a 3-3-3-3-3 internal subdivision of Minuette degree identified in blue. This structural series could have its fifth wave of Minute degree (labeled in black) concluded on March 19th, when the price found support at 1.1113.

After the market participants took down the price to the lowest level of the year, the pair reacted mostly upward, developing a bounce in a five-wave sequence. This bullish movement may correspond to a wave (i) of the Minuette degree, which ended last June 05th, from where the GBPCHF cross started to develop an incomplete corrective corresponding to wave (ii) in blue, which remains in progress.

On the other hand, the RSI oscillator, which moves below the level-60, confirms the short-term bearish bias that GBPCHF maintains.

However, considering that the price action advances in an incomplete bearish wave (ii), our preferred near-term positioning remains neutral until the current bearish structure completion expects the potential rally corresponding to wave (iii), which could raise until 1.28 area.

Categories
Forex Market Analysis

Silver: Sustained Bullish Pressure

Silver advances over 3.14% this week, increasing its gains by the sixth week in a row. The precious metal could visit the $20 per ounce, the highest level since September 2016.

The Market Sentiment

Silver, in its weekly chart, reveals that institutional participants hold a bullish sentiment. The speculative positioning identified in green, taken from the Commitment of Traders report (CoT) issued each Friday by the CFTC, confirms that institutional traders hold its long positions expecting new higher highs. At the same time, both the COT report as the price action doesn’t reveal signals of a reversal trend.

On the other hand, the strong upward momentum that can be seen on the precious metal is driving it near its 52-week high located at $19.65 per ounce. This market context leads us to expect an increment in volatility on the metal sector, which could hit new highs.

The following daily chart reveals that Silver volume remains above the 250 trading sessions average. The relatively high volume level along with its price advancement confirms that the current uptrend remains intact.

The Elliott Wave Outlook

The Elliott wave perspective sketched in the following 12-hour chart exposes an incomplete bullish five-wave sequence, which could drive prices to exceed the $20 per ounce.

The precious metal started an incomplete bullish sequence last March 18th when the price found fresh buyers at $11.64 per ounce. Once Silver started its recovery, the market participants sent it into an internal five-wave rally to $15.84 per ounce, where it completed wave ((a)) of Minute degree labeled in black.

In the previous chart, we observe a narrow-range corrective sequence developed into a three-wave structural series that failed to achieve a new lower low. This market context warns us about the potential strong upward momentum that could drive Silver toward new higher highs. In fact, the price action reveals an incomplete fifth wave of Minuette degree labeled in blue, which remains in progress.

The RSI oscillator reveals a bearish divergence, which leads us to confirm that Silver currently moves in its fifth wave, possibly belonging to a wave ((c)) of Minute degree. In an alternative count sequence, Silver could be advancing in a wave ((3)) of Minute degree.

Considering the Elliott Wave rule of extensions, the current fifth wave could be the extended wave of the entire upward sequence. On the other hand, the Fibonacci projection suggests that the precious metal could extend its gains in a range from $20.04 to $21.66 per ounce.

Finally, as long as the price action continues advancing above the $18.47, the short-term trend will continue being led by the bull traders.

Categories
Forex Daily Topic Forex Psychology

Sentiment Analysis- An Introduction


Market Sentiment

The Market sentiment term is used in reference to the mood of the market traders. Sometimes most traders feel fear and pessimism, and at other times they feel overconfident positive and, even, greedy. Investors trade their beliefs about the market, and the beliefs are raised by its over-protective system one (Please, read https://www.forex.academy/know-the-two-systems-operating-inside-your-head/). Thus, they react emotionally to the market, and these reactions influence the market at the same time that the market is changing their emotions.

The two systems

In the mentioned article, we talked about the work of Dr. Daniel Kahneman and the Two-systems model to explain people’s behavior. System one is fast and closely related to the primal emotions and instinctive knowledge. In contrast, system two is slow and is the way people use in rational thinking, computations such as math operations such as counting. We also said that system two trust system one most of the time. That is the way we are programmed. System one is a warning system if danger appears. 

Market Sentiment is a Contrarian Indicator

But the marketplace behaves very differently from the real world where system one was trained. Thus, market sentiment is a contrarian indicator. That is because the majority of market participants are non-professional investors moved mainly by greed or fear. Therefore, when a large portion of traders shows expectations about the future curse of an asset pointing to one direction, the market tends to move in the opposite direction. That is logical. Let’s suppose that a large percentage of retail investors think the EURUSD is going to rise significantly. That means they are invested in or plan to do it right away. At the times when the crowd is the most bullish, it is when they are nearly fully invested. 

The market is fueled by the buyer side. When everyone has already invested in the EURUSD most of their funds, almost no fuel is left to lift it further, as they don’t have more financial capacity to continue investing. Thus the demand shrinks. Only the supply side is left, since professionals, who sold every available lot to the masses, are not willing to buy that high; therefore, the prices should fall.

The Market Players

There are three types of market participants: The informed, the uninformed, and the liquidity players. The informed players have insider information about the course of the fundamental drivers and can position themselves in the direction of the future trend. These are the institutional traders. They tend to sell at the top, when the crowd is mostly optimistic and buy at the bottom when the public sees no end to the drop.

 Uninformed traders are the majority of retail traders. They act moved by greed and fear. Their greed made them bet with disproportionate leverage at the wrong moments. Their fear made then close their positions at the worst possible time or close it with minimal gains so as not to lose. 

 Liquidity traders are professional traders interested in short-term plays, so they mostly do not affect the primary market trends. On the forex, Liquidity traders operate using technical analysis and price-action strategies, using money management schemes and systems that have been proved to be profitable.

Traders are their worst Enemies

  •  Everybody knows they should buy low and sell high, but the majority buy high and sell low.
  • Everybody thinks it is easy to be successful in trading and be rick
  • Anyone should know that panic selling is a bad idea, but nobody follows the advice.
  • The major part of market signals is worth less than a coin toss, but people still crave them and then overtrade and lose at the first slight market retracement.
  • Nobody takes seriously trading with reward to risk ratios over two. Instead, they prefer High percent winners with lousy RR ratios.
  • Everybody trades untested strategies. Thus, they ignore the statistical parameters of the system, and, even, they cherry-pick the signals.
  • Nobody knows about position sizing even when they want to trade at maximal leverage.

Advice for you

Market Sentiment is a contrarian indicator. If you consider yourself a uniformed trader ( and 85% of retail traders are), trade against yourself. A lot of brokers trade against you, and they are getting rich.

Instead of one impulsive trade based on greed, consider yourself direction agnostic by taking two opposing trades using 15-pip away stop orders and a 2:1 Reward: Risk ratio: 

Practical System Example:

Two simultaneous and opposing orders with a Reward/Risk Ratio of 2.

1 One LONG EURUSD position
  • Buy Pending Order: Current price + 15 pip buy stop order
  • Stop-loss: 20 pips below the entry price
  • Take profit: 40 pips away from the entry price
2 One SHORT EURUSD position
  • Sell-short Pending Order: Current Price – 15 pip Sell stop order
  • Stop-loss: 20 pips Above the entry price
  • Take profit: 40 pips below from the entry price

Using this kind of order, you let the price tell you its direction. One order gets filled the other not. Also, an RR ratio of 2:1 protects you against a decrease in the percent of the winners, since only one good trade every three is needed to be profitable. 

Money management

Finally, do not risk more than one percent of your total assets initially. On the EURUSD, we know that every pip is worth $10 on each lot. Thus a 20 pip stop-loss distance is worth $400. To trade a full lot risking one percent, your account balance should be $40,000. Therefore if you own just $4,000, do trade one mini lot, and if your account is only $400, you should use just one micro-lot.

Learning is hard. You will think that trading that way you won’t get rich quick, but just four things you must consider.

  1. Your initial purpose should be to learn your trading job and know how the system performs.
  2. The primary goal of a trader is to preserve the capital
  3.  Compounding is a powerful concept.
  4. You should know your risk and its characteristics.

References:

THE COMPLETE RESOURCE FOR FINANCIAL MARKET TECHNICIANS, THIRD EDITION, 2016. Charles D. Kirkpatrick II, CMT Julie Dahlquist, Ph.D., CMT

Thinking, Fast and Slow, Daniel Kahneman


Categories
Forex Videos

Forex Risk VS Sentiment – Bad News For The Pound!

Risk versus Sentiment

Traders interpret technical analysis on their screen charts in many ways, such as price action. But they are always reading between the lines in terms of perceived risk and sentiment, which may have little bearing in the price of a currency pair before an important event.
One such event, as in Example A, is a screenshot of a one hour chart of the GBPUSD pair on the 6th of December 2019. The British people were voting this day on an election, which would have a strong bearing with regard to Britain’s possible exit from the European Union: Brexit.

In the example, we can see that just before exit poll information was released at 10 p.m. GMT, the pair began to fall, was being sold off. This was due to perceived risk That Boris Johnson’s conservative government would not win the election, and therefore allowing labor to potentially win and where their pledges of heavy government borrowing were perceived by the traders as being bad news for the pound.

However, the exit polls indicated that the conservative government would win with a major majority the pound surged to over 1.350. When the dust began to settle, and some profit-taking took place, risk began to unnerve traders, who perceived that although Brexit was likely to happen now, the government might not be able to get all of the necessary laws in place for this to happen within the designated time frame to complete all of these laws and to broker a new trade deal with the European Union by December 2020. Therefore the pound began to fall again.
As a trader, it is imperative that when you see a major political event unfold, such as this one, that you fully understand what is going on at the time of the event, and not just afterwards, because By fully understanding the risks that are involved in such an event it will create an opportunity for you to make money.


However, many traders, in fact, did lose money trading this event because they were not fully appreciative of the risks involved. Not only the GBPUSD pair but also to other currencies, for example, the strength and weakness of the US dollar at the time of the event and also other currencies such as the Yen, Swiss Franc and the Euro, which were also being traded against the pound at this time.

Therefore during technical analysis, while traders depend on technical tools such as the MACD Stochastics and price action, it is imperative that traders are also mindful, and especially when it comes to major political events, with regard to perceived risk and sentiment.

Categories
Forex Market Analysis

Forex and Indices – Daily Update 02.08.18


Fundamental Overview


In today’s session, market sentiment is led by the preference of risk protection assets facing the expectation for the US employment data, which will be announced on the Friday 03rd session. The US Dollar and Japanese Yen, which advanced 0.30% and 0.30% respectively. Within the commodity currencies group, the oceanic currencies are the hardest hit; the New Zealand Dollar is the worst performer which falls 0.49%, followed by the Australian dollar that drops 0.45% in the trading session.

Source: Forex Academy Collection


Technical Analysis


EURUSD

EURUSD in the 1-hour chart is moving bearish, below the weekly pivot level. For short positions, the price should break under the 1.1657 level with a profit target in the confluence zone between the first weekly support and the Lower HHL at 1.16061 level. For long positions (reversal case), the price should break above the breakdown candle at 1.1691, with a profit target between the confluence zone between the first weekly resistance and the Upper HHL at 1.1729.


GBPUSD

The pair GBPUSD is moving slightly bearish below the weekly pivot consolidating between 1.3090 and 1.3140. A breakdown below 1.309 could drive to the pound to the first weekly support at 1.3050. The bullish case, if the price breaks above 1.3140, the potential target is the first weekly resistance located at 1.3189.


USDCHF

USDCHF in the hourly chart is consolidating as a triangle pattern; this chart pattern suggests more upsides. For long positions, is essential that the price breaks above the weekly pivot level at 0.9937, with a profit target at the third daily resistance at 0.9974. Short positions should be valued if the price breaks under 0.9917, the potential target is the HHL at 0.9880.


EURGBP

The EURGBP cross is running bearish and is consolidating as a flag pattern. For bearish continuation, the price could drop to the confluence zone between the second daily support and the first weekly support at 0.8860. For long positions, the price should break above the weekly pivot level at 0.8897 with a potential move to the HHL at 0.8928.


GBPNZD

The GBPNZD cross is running sideways with a bullish bias in the last sequence which started from the first weekly support at 1.76318. For long positions, the price should break above the first daily resistance with a mid-term target placed on the confluence between the second weekly resistance and the third daily resistance at 1.7864. Short positions should be valued if the price closes below the daily pivot level at 1.77059, and the potential target is at the first weekly support at 1.76318.


DAX 30

DAX 30 is moving slightly neutral in the weekly pivot level at 12,746 pts. For short positions, the price should break below 12,707 with a potential target in the first weekly support at 12,604 pts. Long positions should be regarded if the German index closes above 12,800 pts, with a potential profit target at 12,920 pts.


FTSE 100

The FTSE 100 index shows bearish signals closing below the weekly pivot level at 7,687.9 pts. Continuation of the previous bearish move should be valued if the price breaks under the first weekly pivot at 7,635.2 pts., with a profit target in the confluence zone between the HHL and the third weekly support at 7,521 pts. Long positions could be valued if the price breaks above the weekly pivot level, with a potential target in the first weekly resistance at 7,754 pts. Additionally, note that if the price plunges to the third weekly support, it could be an interesting reversal level.


Categories
Forex Market Analysis

Forex and Indices – Daily Update 26.07.18


Fundamental Overview


Forex News: The market sentiment of the session was led by the US Dollar (DXY), which advanced against the main currencies group climbing 0.68 per cent. The Dollar boost was aided on the one hand, by the labour market data, in the Thursday session the Initial Jobless Claims data rose 217,000, which despite the increase of 9,000 from the previous week’s revised level, continue showing optimistic levels for the American economy. On the other hand, the ECB interest rate decision continues without changes for the common currency, contributing to the strength in the USD appreciation. The worst performer currency of the session was in the “commodities currencies group”; the Aussie (AUD) fell 1.04 per cent dragged by the dive in Copper price which retraced 1.59 per cent.

Forex News – Daily Performance

Forex News - Daily PerformanceSource: Forex.Academy Collection.


Technical Analysis


EURUSD

EURUSD made a false breakout which could not reach the first daily resistance, turning to the daily pivot and even falling below the weekly pivot point changing the market sentiment from bullish to bearish. For long positions, we need to see the breakout above the bearish breakdown candle at 1.1710, with a first potential profit target placed at the first daily resistance at 1.1756, the second potential target is the confluence level between the second daily resistance and the first weekly resistance at 1.1785. Short positions should be valued as a continuation of the breakdown, with a profit potential target at 1.1615. Pay attention to this area because the confluence with the third daily resistance at 1.16077 could be a potential buy zone.


GBPUSD

The GBPUSD pair in the 30-minutes chart tested the first daily resistance of the intraday trading session at 1.3214, After this, the price made a re-test, from where the pound started to fall and found support in the weekly pivot point at 1.31257. For long positions, the price should break over the daily pivot level at 1.31739 with a potential profit target at 1.3215 (first intraday resistance). Short positions should be valued as the continuation of the previous movement when the price breaks under the weekly pivot level (1.31257) with a potential target in second daily support at 1.31065.


USDCHF

The Swiss currency in the 30-minutes chart continues moving sideways between the first daily support (0.99007) and below the first daily resistance (0.9942). For long positions, the USDCHF should break above the first daily resistance at 0.9942 level with a short-term target at 0.9960 (weekly pivot level); for bearish positions, we need to see that the price to close below the intraday range at 0.9910 with a potential profit target in 0.9877 (first weekly support.)


EURCAD

The EURCAD cross in the 30-minutes chart is moving bearish, testing the second weekly support located at 1.52488. For bullish positions, the price should break and consolidate above 1.5278 with a potential target is at the first weekly support at 1.5325. For bearish positions, as a continuation of the trend, the price could drop to the third weekly support at 1.51778.


GBPCAD

The GBPAUD cross is moving bearish nearly above the first weekly support at 1.71211. For long positions, the price should breakdown candle at 1.7185 with a potential target on the daily pivot level at 1.7232. If we are looking bearish continuation, the price could see the bottom at the 1.70067 level (confluence zone between the third daily support and second weekly support.)


FTSE 100

FTSE 100 in the 30-minutes chart is moving in a narrow range below the daily pivot level (7,669.8 pts) and above the weekly pivot level (7,649 pts.) For bullish positions, the price should break above 7,686 pts, with a potential target on the first weekly resistance at 7,735 pts, which is the convergence zone with the second daily resistance. Bearish positions should be considered if FTSE 100 index breaks below the weekly pivot level at 7,649 with a potential profit target at the first weekly support (7,593 pts.), the second profit target is the HHL at 7,521 pts.


DAX 30

The DAX index 30 in the 30-minutes chart soared to the third daily resistance (12,827 pts), from this zone we have two options. Long positions could extend to the second weekly resistance at 12,912 pts, only if the price breaks above the 12,827 pts. The second option is for short trades; it could be considered if the price breaks below 12,715 pts with a profit target located at 12,604 pts.