Overview
The Spanish index Ibex 35 during this year underperforms over 25% (YTD). This negative performance observed during 2020 added to the price action moving below the 200-day moving average, leads us to see to Ibex 35 in a bear market. The bearish market sentiment is confirmed by the technical outlook that drives us to foresee more declines.
Market Sentiment Overview
In 2020, the Ibex 35 index moves mainly bearish after toped at 10,100.20 pts in mid-February, where the Spanish stock market began to decline in a massive sell-off that led it to lose over 42% in mid-March when the price found a bottom at 5,814.50 pts. Until now, Ibex 35 accumulates a loss that reaches 25.78 % (YTD), locating it into the bear market category.
On the other hand, the Ibex 35 prices, in its daily chart, exposes the price action moving mostly sideways below the 200-day and 60-day moving average. This market context, added to the consolidation movement below the 50% of the 52-week high and low range, leads us to observe that the Spanish stock market maintains its bearish pressure.
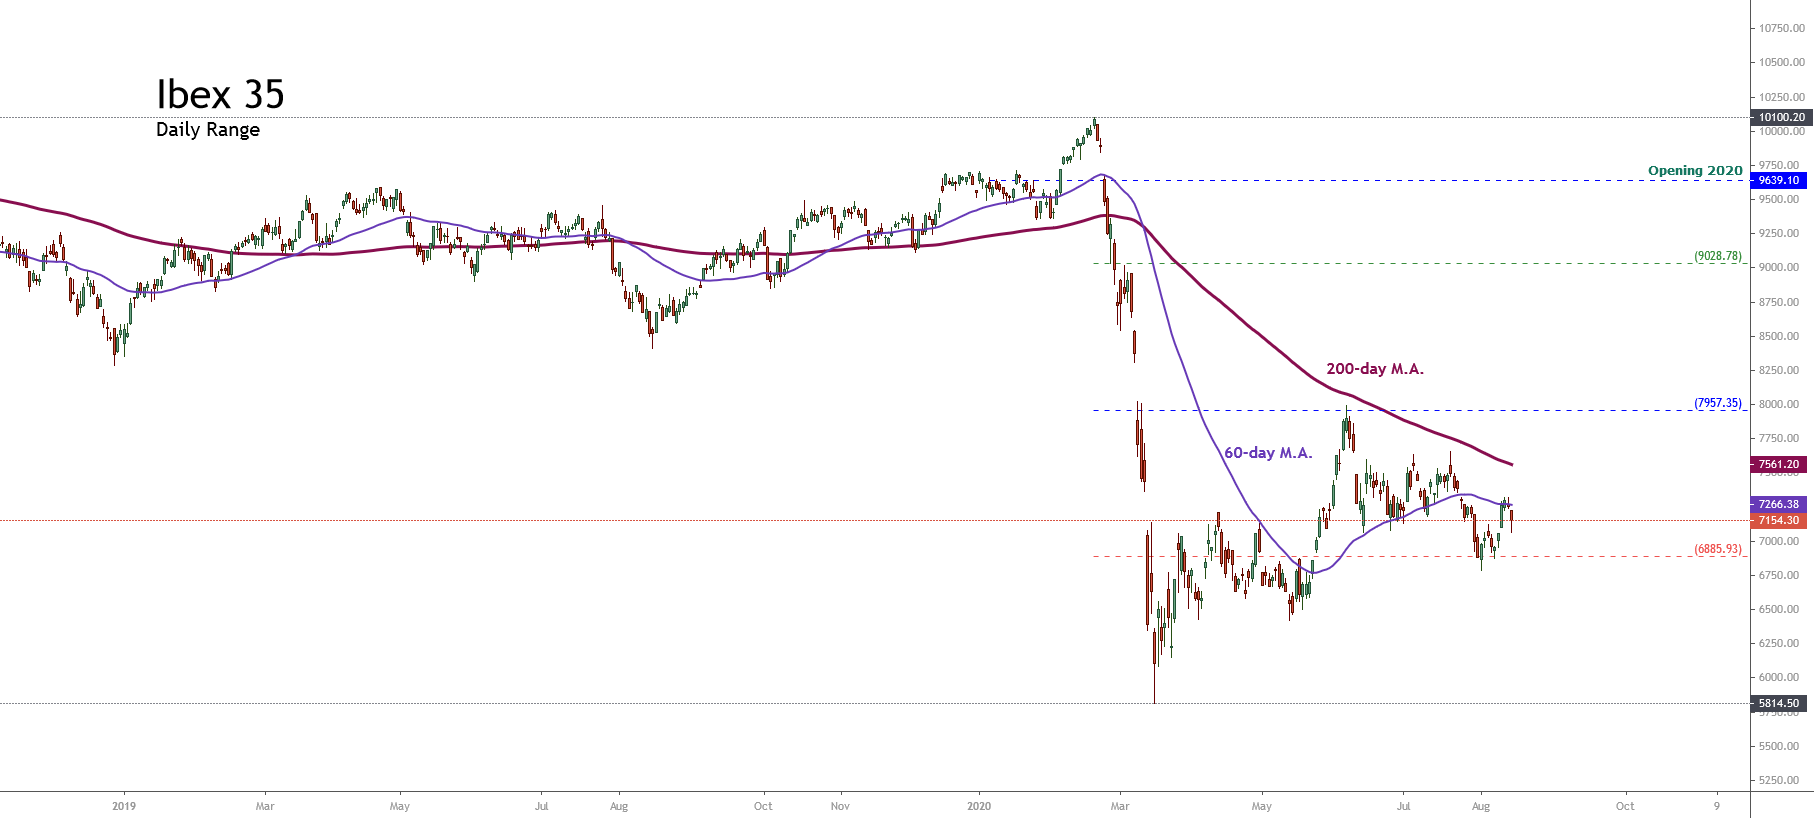
Summarizing, while the price action continues moving below the 200-day moving average and below 7,957.35 pts, the market sentiment of Ibex 35 will remain on the bearish side.
Technical Analysis Outlook
The long-term overview of Ibex 35 illustrated in its 2-week chart and log-scale, reveals a bearish sequence that began in early November 2007 when the Spanish index toped in its all-time high and found fresh sellers at 16,040.40 pts remains intact.
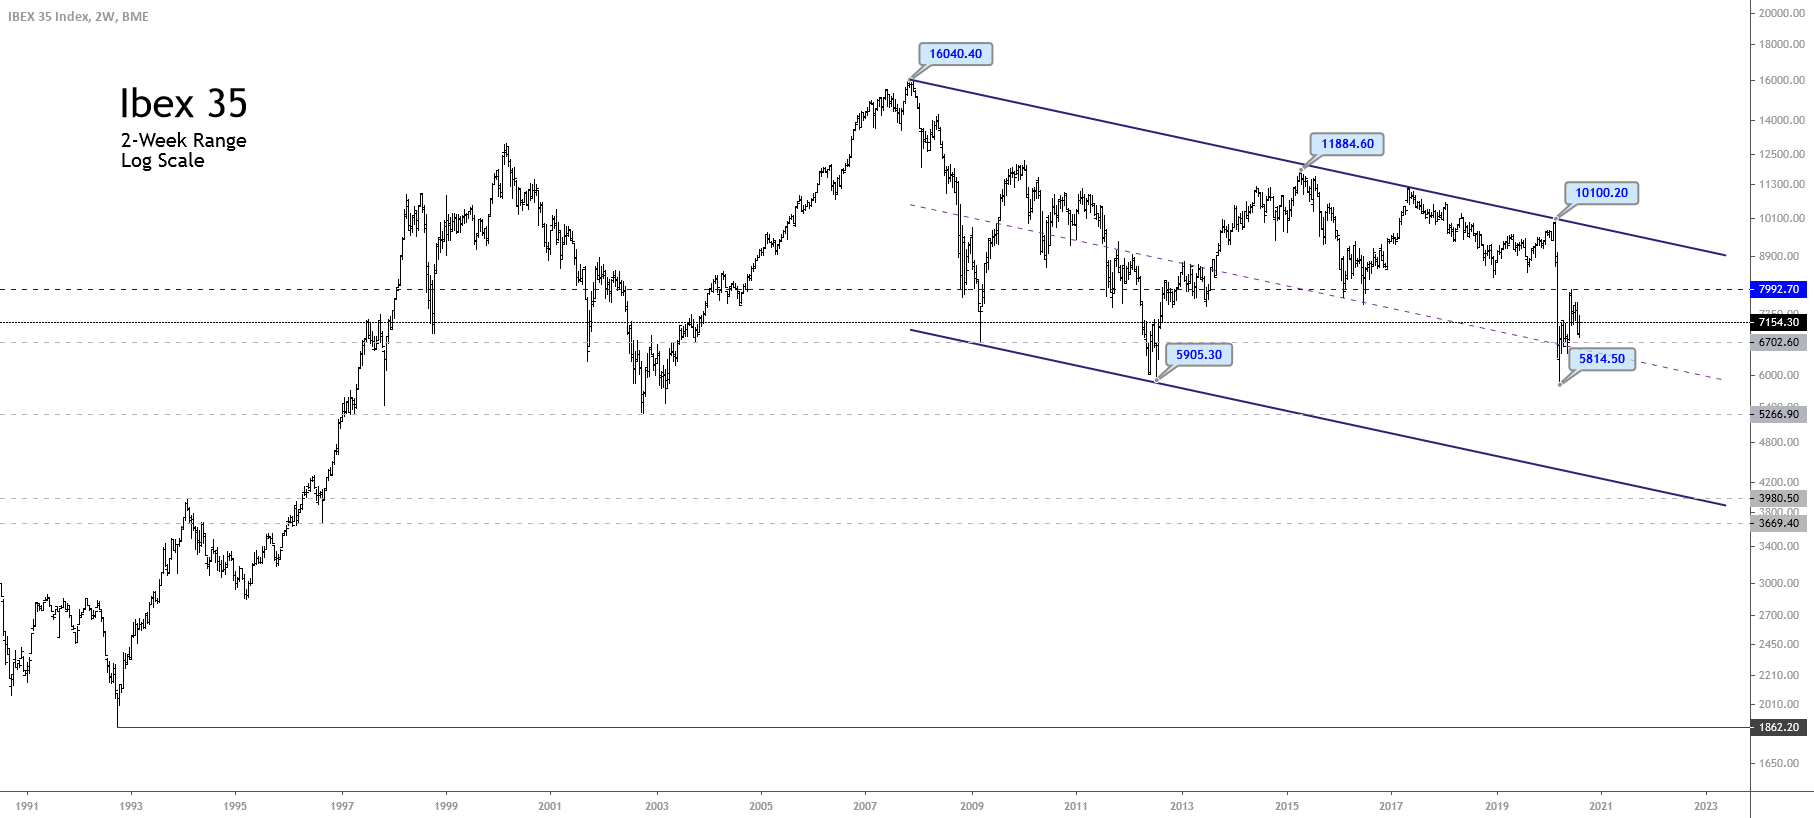
The descending channel observed in the previous chart and the price action consolidating below the pivot level at 7,992.7 pts, leads us to maintain our bearish bias for the Spanish index. At the same time, the pierce below March 2020 low located at 5,814.50 pts could drive to Ibex 35 toward new lows. The potential declines could find support at 5,266.90 pts and even could extend from to 3,980.50 pts until 3,669.40 pts; this range coincides with the base-line of the descending channel and the reaction levels observed on January 1994 and August 1996.
The next figure illustrates to Ibex 35 under the Elliott wave perspective. The Spanish index moves sideways developing an incomplete triangle pattern (3-3-3-3-3) corresponding to wave ((B)) of Primary degree labeled in black of a wave II of Cycle degree that maintains in progress since Ibex 35 found sellers at 16,040.40 pts on early November 2007.
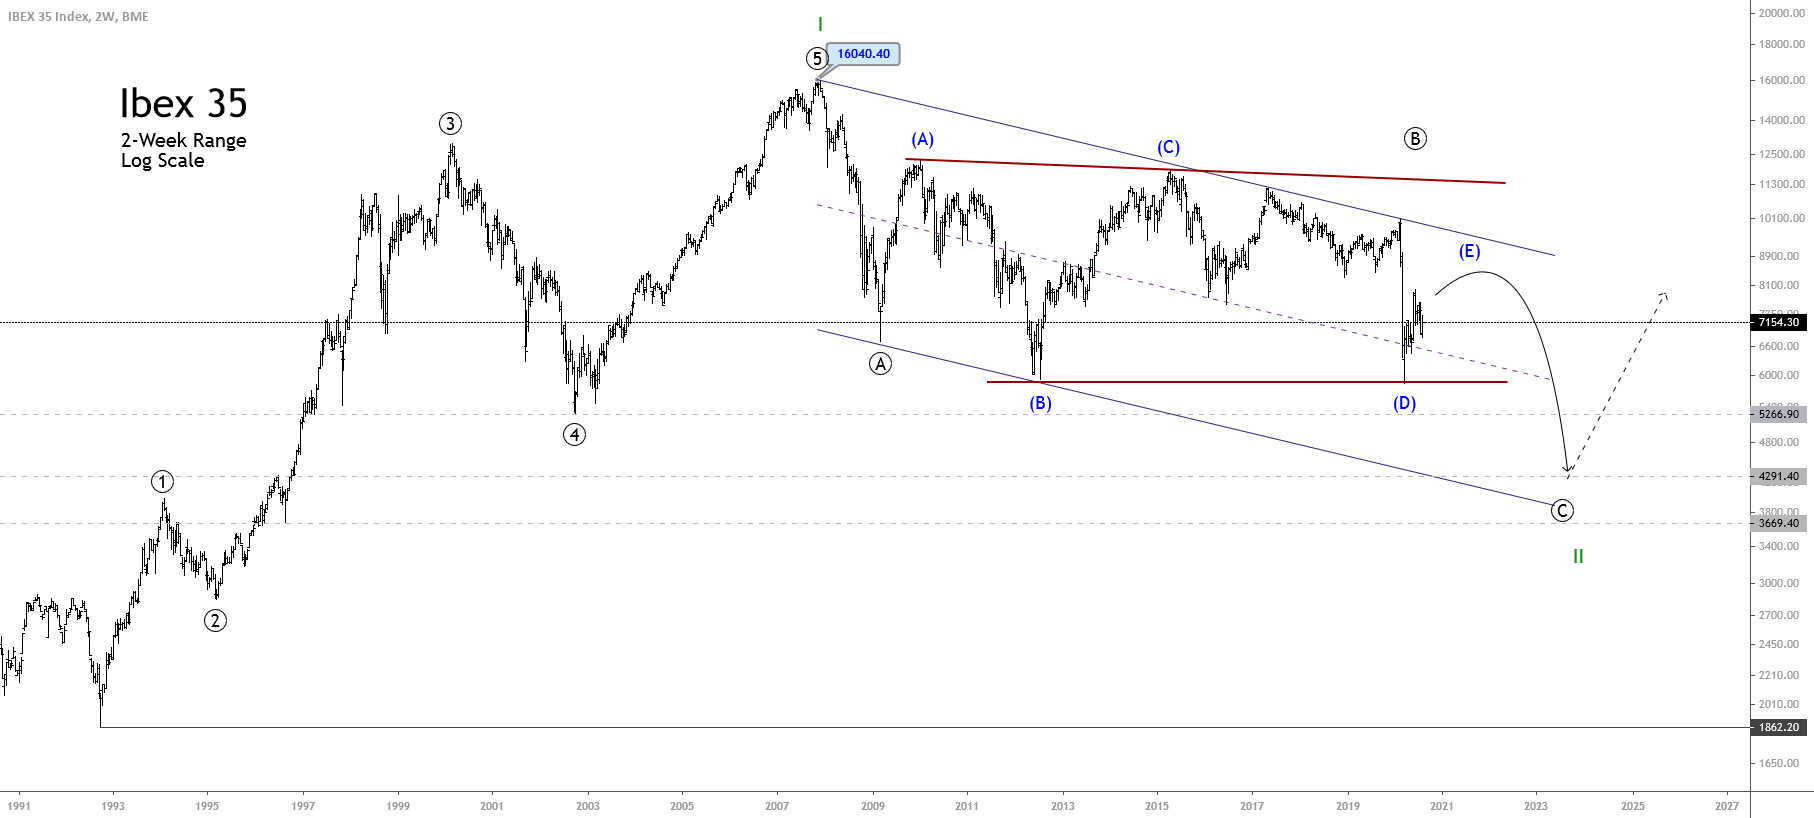
The potential next decline corresponding to wave ((C)) of Primary degree could drive the price to fresh lows, which has identified three possible support levels. These levels extend from 5,266.90 pts, following until 4,291.40, and could extend toward 3,669.40 pts.
Finally, once completed the pending bearish five-wave sequence, Ibex 35 should finalize the wave II of Cycle degree, and in consequence, the Spanish stock market should start a new long-term rally of the same degree