The Gold price opened the current trading week to reach a new all-time high at $1,987.95 per ounce, approaching the psychological barrier of $2,000 per ounce.

Market Sentiment Overview
During this year, the precious metal reports an advance over 31% (YTD), boosted by global recession concerns. The safe-haven metal has increased its value at a similar pace of the descents on the worldwide growth rate. A fact that reduces the possibility of an economic recovery in the near term.
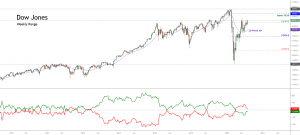
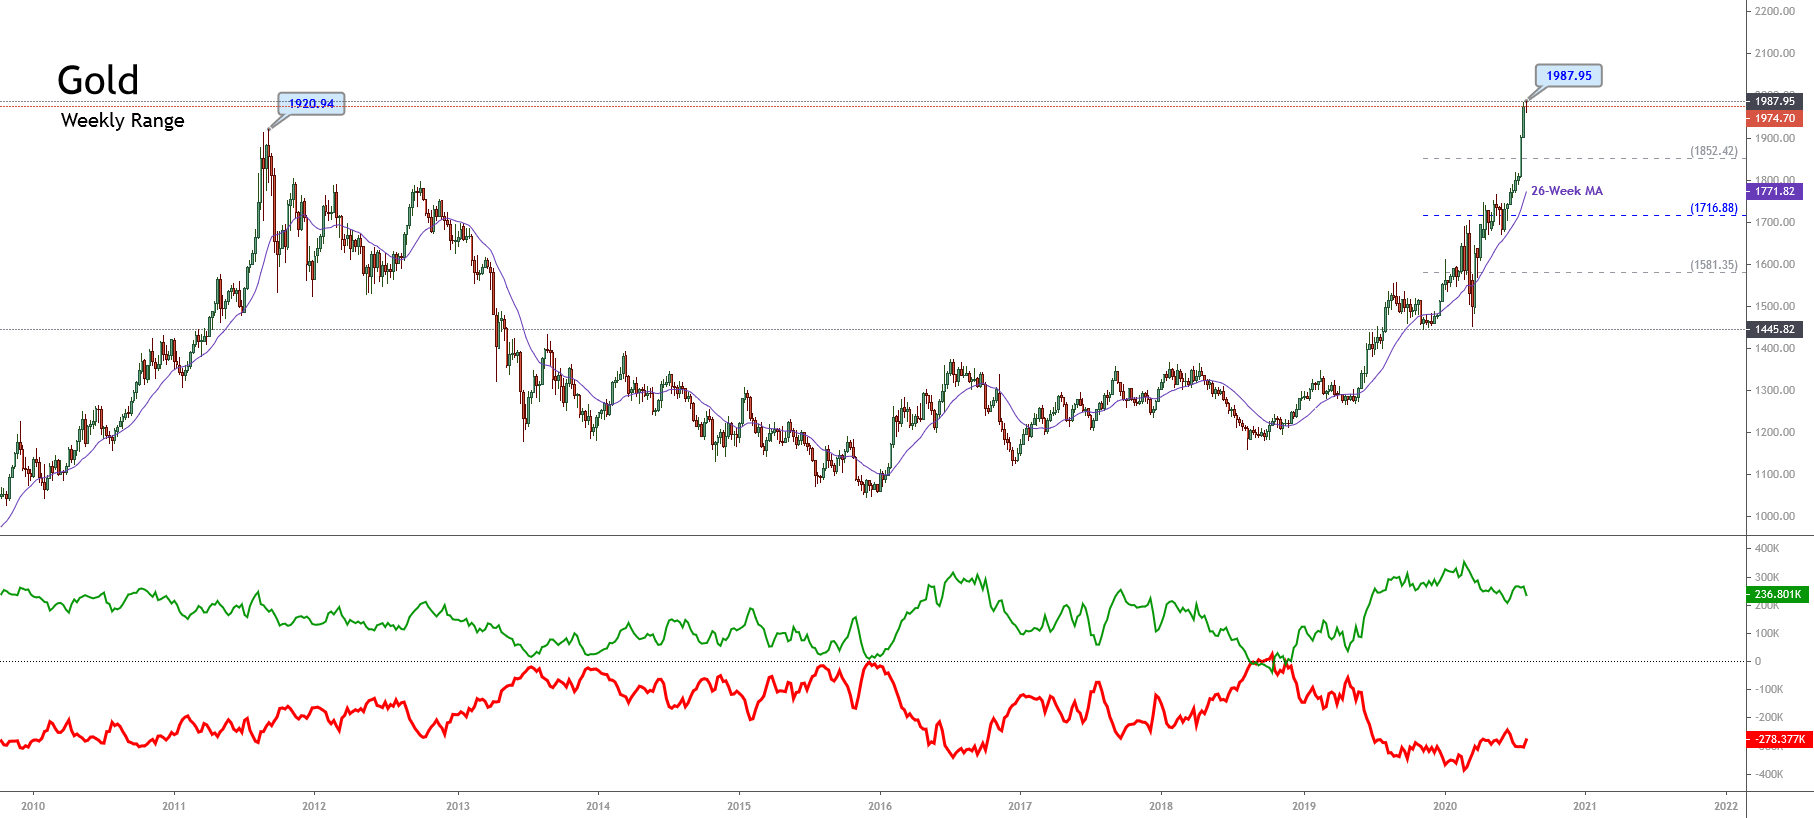
In its weekly chart, the yellow metal exposes the bullish momentum that sent the price over September’s 2011 high at $1,920.24 per ounce, climbing to $1,987.95 per ounce this week.
On the first chart, we distinguish the price moving in the strong bullish sentiment zone of the 52-week high and low range, where we observe the precious metal reaching fresh highs. Simultaneously, the price action continues moving above the 26-week moving average, showing that the bullish bias remains intact. The separation between the moving average and price leads us to conclude that Gold is in an overbought stage. This condition may carry the precious metal to begin a corrective movement.
On the other hand, the Institutional Net Positioning – green curve at the bottom of the previous image- shown by its latest CFTC report, reveals a decrease in the speculative positioning, decreasing by 11.12% (WoW) compared with the previous reading. This decrease exposed in the following figure illustrates the institutional net positioning moving bellow the 13-week moving average.
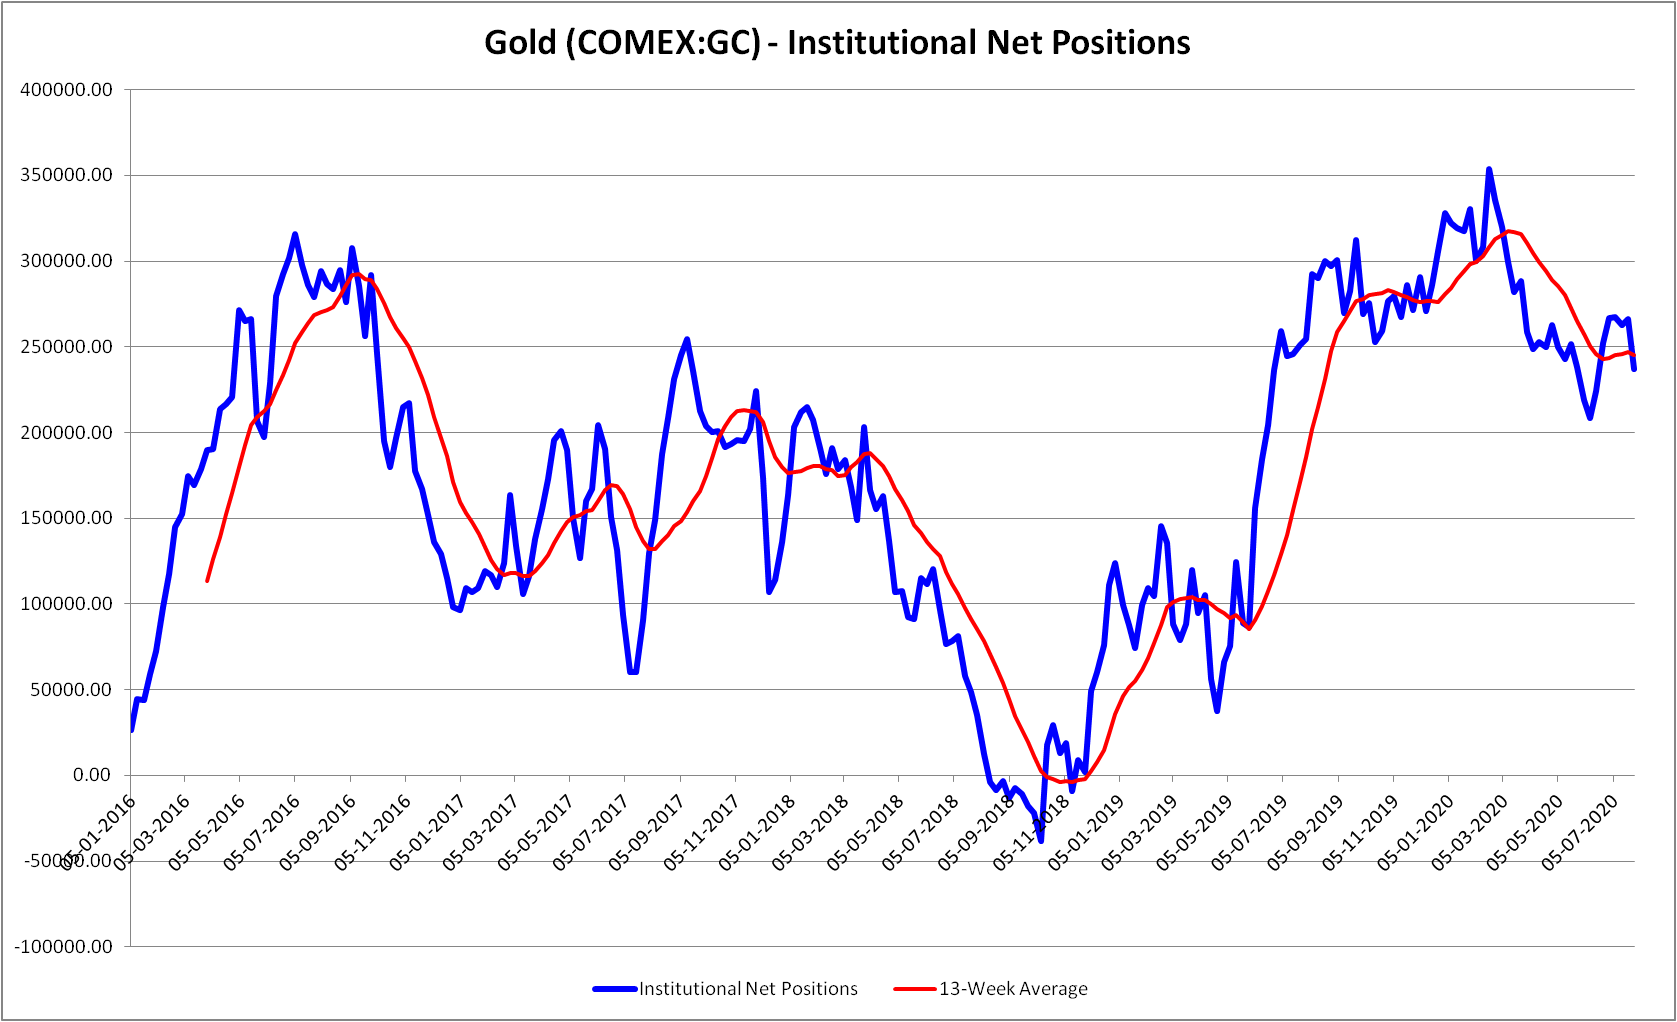
Summarizing, although the price action continues reaching fresh all-time highs, the big participants’ actions reveal a take-profit activity on their long-side positioning, which could be being helped by an extreme bullish sentiment on news media.
Elliott Wave Outlook
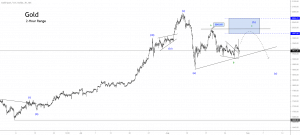
The short-term Elliott wave Gold’s perspective unveiled in its 2-hour chart reveals the price moving in a terminal structural series corresponding to an ending diagonal pattern. This technical formation comes after the price rallied, developing a third extended wave of Minuette degree identified in blue.

The bullish cycle that remains intact began on June 05th when the yellow metal found fresh buyers at $1,668.30 per ounce. The impulsive sequence observed in the previous chart, reveals its advance in a third extended wave, which topped at $1981.20 per ounce on July 28th, where the price retraced from, completing its wave (iv) of Minuette degree identified in blue.
Once the fourth wave in blue was completed, the price of Gold advanced in the current fifth wave of Minuette degree, showing an internal structure that looks like an ending diagonal pattern. This Elliott wave formation warns us about the potential reversion of the bullish trend. Although it will likely decline short-term, Gold’s bias remains on the bullish side as long as the price stays above $1,907.20. However, if the price breaks and closes below the base-line ii-iv of the ending diagonal, the yellow metal could visit the $1,907 level as its first relevant support.