Overview
The GBPCHF cross began the current trading week, advancing over 1.30%, boosted by the U.S. post-election rally and Pfizer’s Covid vaccine upbeat results. However, the Elliott Wave view anticipates that the euphoric rally could soon end, and the cross could reverse its course toward new lows.
Market Sentiment
The week started with a risk-on U.S. Presidential post-election stock market rally, driving the risk-off currencies to drop. In this context, the GBPCHF cross advances over 1.30% to its highest level since late September.
The following 8-hour chart displays the intraday market sentiment. Although the sideways movement predominates since late September, the strong bullish move developed in the Monday trading session takes the GBPCHF cross to the extreme bullish sentiment zone.
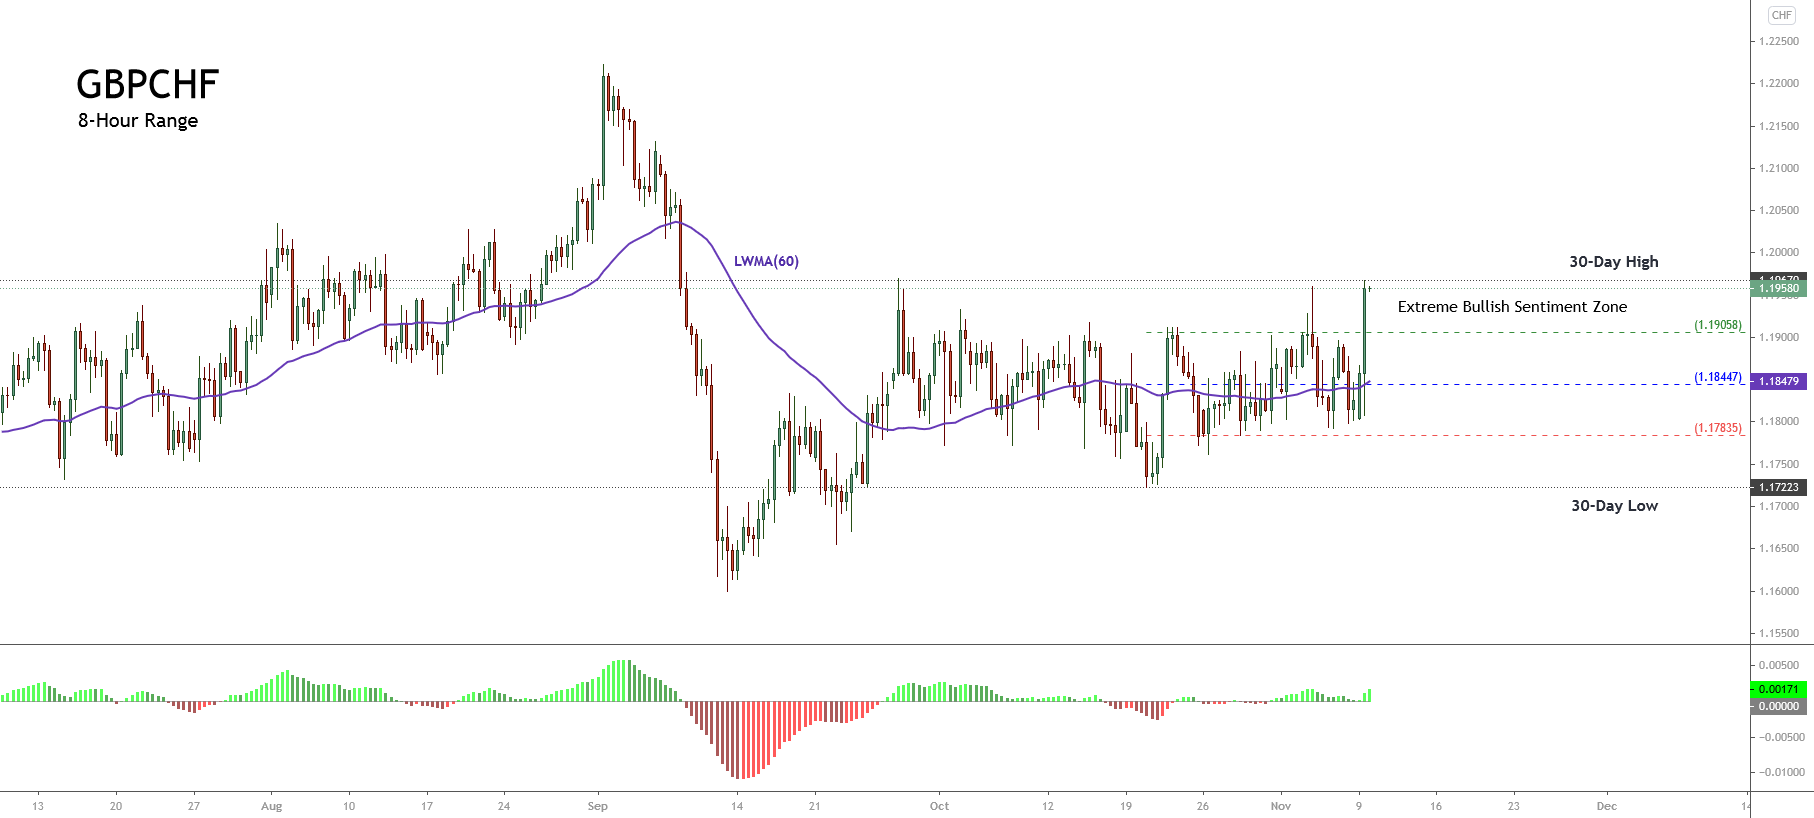
Likewise, we can see the price action developing above the 60-period weighted moving average, which confirms the intraday upward bias that could hold during the following trading sessions.
On the other hand, the euphoric sentiment bolstered by news media’s coverage of the U.S. elections and the continuation of the stock market rally added to the news of the promising vaccine results developed by Pfizer and BioNTech leads us to expect a limited upside in the risk-on currencies.
Technical Overview
The big picture of the GBPCHF under the Elliott wave perspective reveals its progress in a descending broadening formation. Its latest downward sequence began on December 13th, 2019, when the price found fresh sellers at 1.33113. We can see, as well, that this leg still remains in progress.
The following daily chart unveils the advance in the fifth wave of Minute degree labeled in black, which started on 1.22224, where the price action declined in a bearish impulsive movement reaching a new lower low. This decline that ended on 1.15989 completed the first wave of Minuette degree labeled in blue.

Currently, the GBPCHF cross moves in its second wave (in blue). Nevertheless, the psychological barrier of 1.20 could represent a significative intraday resistance.
Technical Outlook
The intraday outlook of the GBPCHF cross reveals the bullish continuation of the current upward momentum. The next 2-hour chart exposes the supply and demand zones according to the potential next move that the cross could develop in the coming trading sessions.
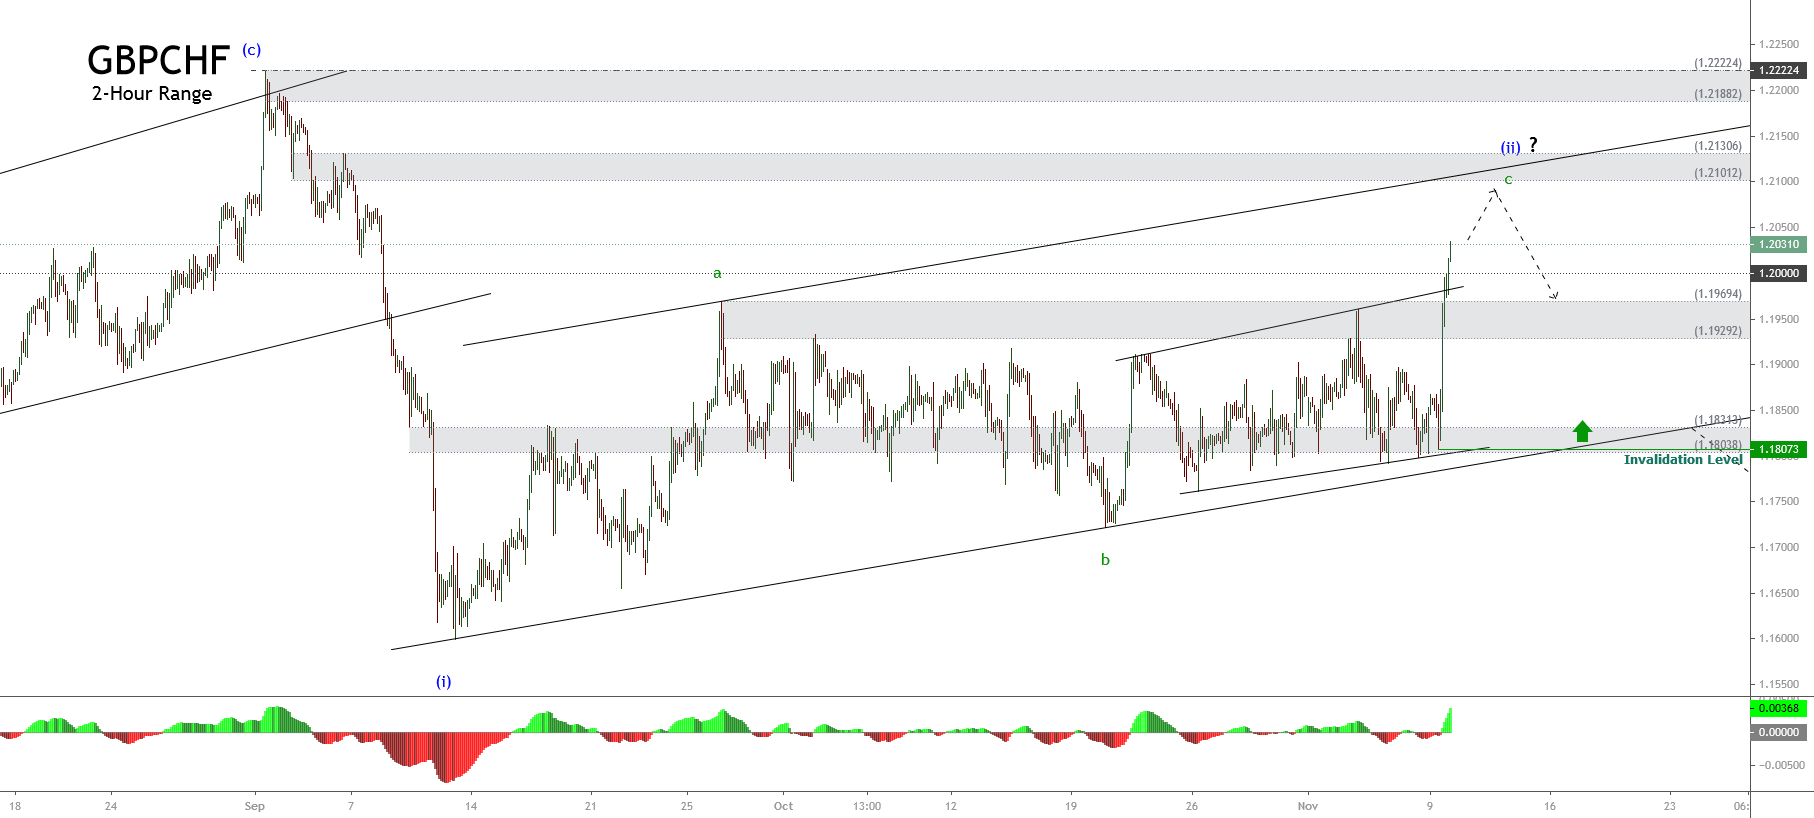
On the one hand, the price advances in its wave c of Subminuette degree identified in green, developing the third internal wave. Likewise, the retracement that should correspond to its fourth internal wave could retrace to the area between 1.19292 and 1.19694. This zone could back the possibility of a new rally that would boost the price toward 1.21012 and 1.21306.
On the other hand, our first scenario considers the bearish continuation. In this case, if the price action penetrates and closes below 1.1803, the cross could see further declines toward the zone of 1.1650.
Finally, our second scenario considers that if the GBPCHF cross continues its advance beyond 1.22224, the cross could extend its gains toward the descending upper- trendline shown in the daily chart.