
Overview
The GBPUSD pair advances in an incomplete bearish corrective formation that corresponds to a wave B of Minor degree. In this context, the completion of wave B could lead to a new decline, which could drag the price below Septembers’ low.
Market Sentiment
The GBPUSD pair suffered another drop for the second day in a row, falling from the extreme bullish to a bullish sentiment zone, where it found support in the psychological barrier of level 1.31.
The following daily chart illustrates the 90-day high and low range, revealing the mid-term market participant’s sentiment. The figure shows the price action moving mostly sideways in a range that oscillates between the bearish and bullish sentiment zones; that is, between 1.27204 and 1.32289.
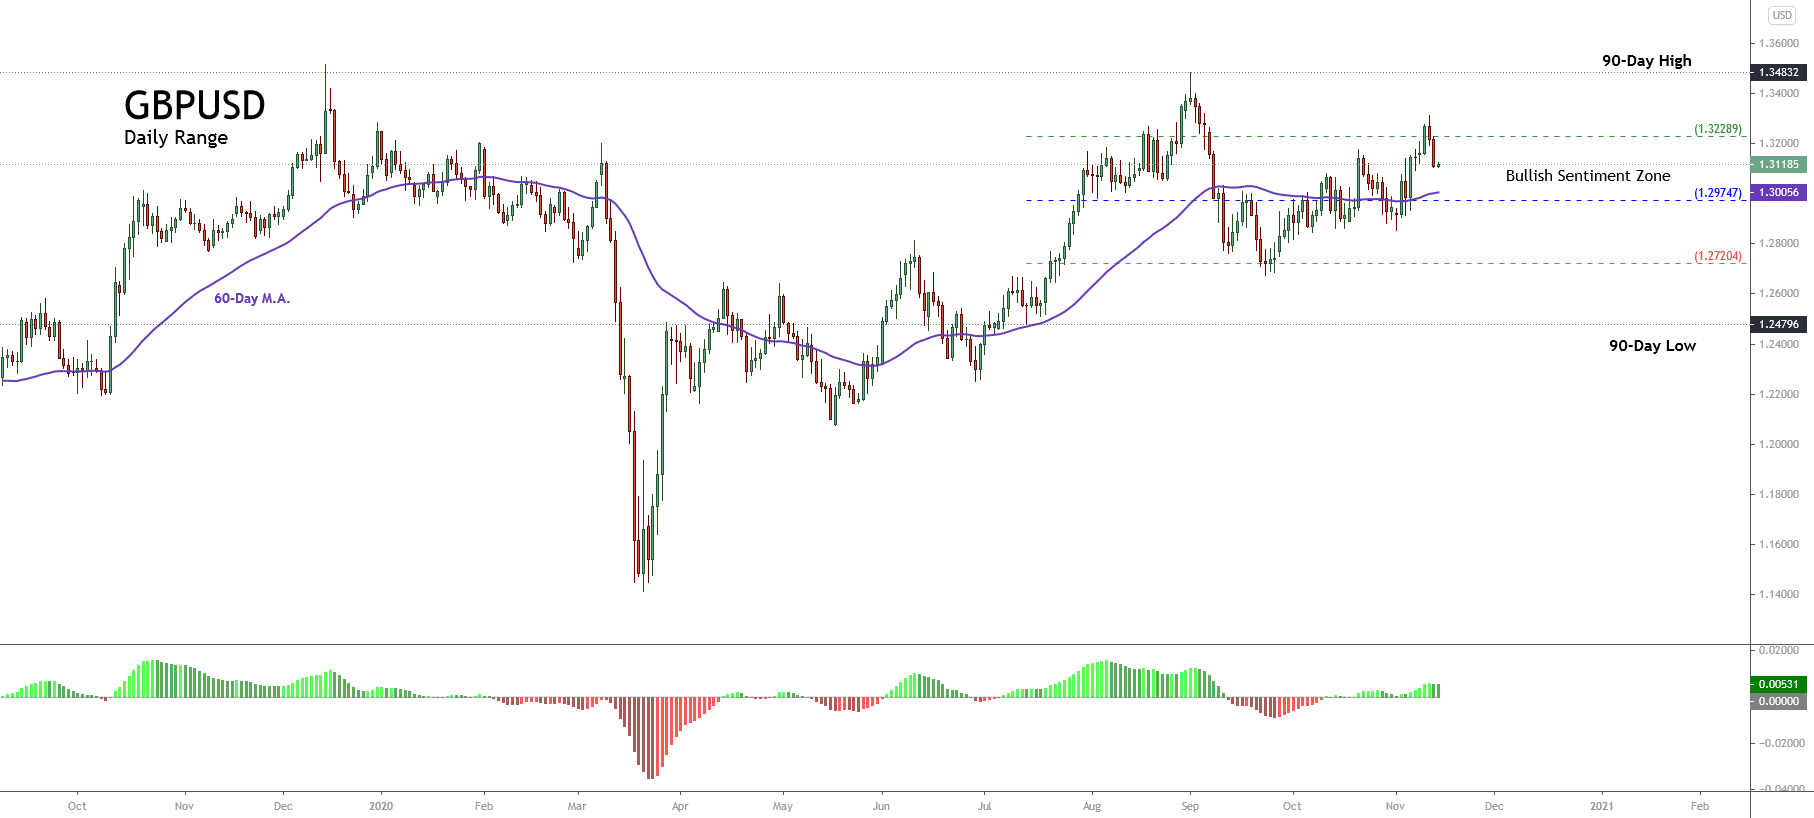
Furthermore, the 60-day weighted moving average is seen moving below the Pound’s price, which confirms the short-term bullish bias that carries the price.
Considering the indecision, the cable is exhibiting since last August. The intraday bias will stay neutral until the GBPUSD pair confirms its next movement, for example, through a breakout.
Technical Overview
The GBPUSD price reveals a yearly long-tailed candlestick that suggests the price will continue being dominated by the upward bias. As exposed in the following 2-day chart, the Pound erased the first 2020 quarter losses that reached up to 13.89%. The cable currently eases 0.67%(YTD).

The big picture of GBPUSD and under the Dow Theory unfolded in the next daily chart illustrates the cable developing a primary upward trend in progress, which currently could be forming a corrective secondary trend.
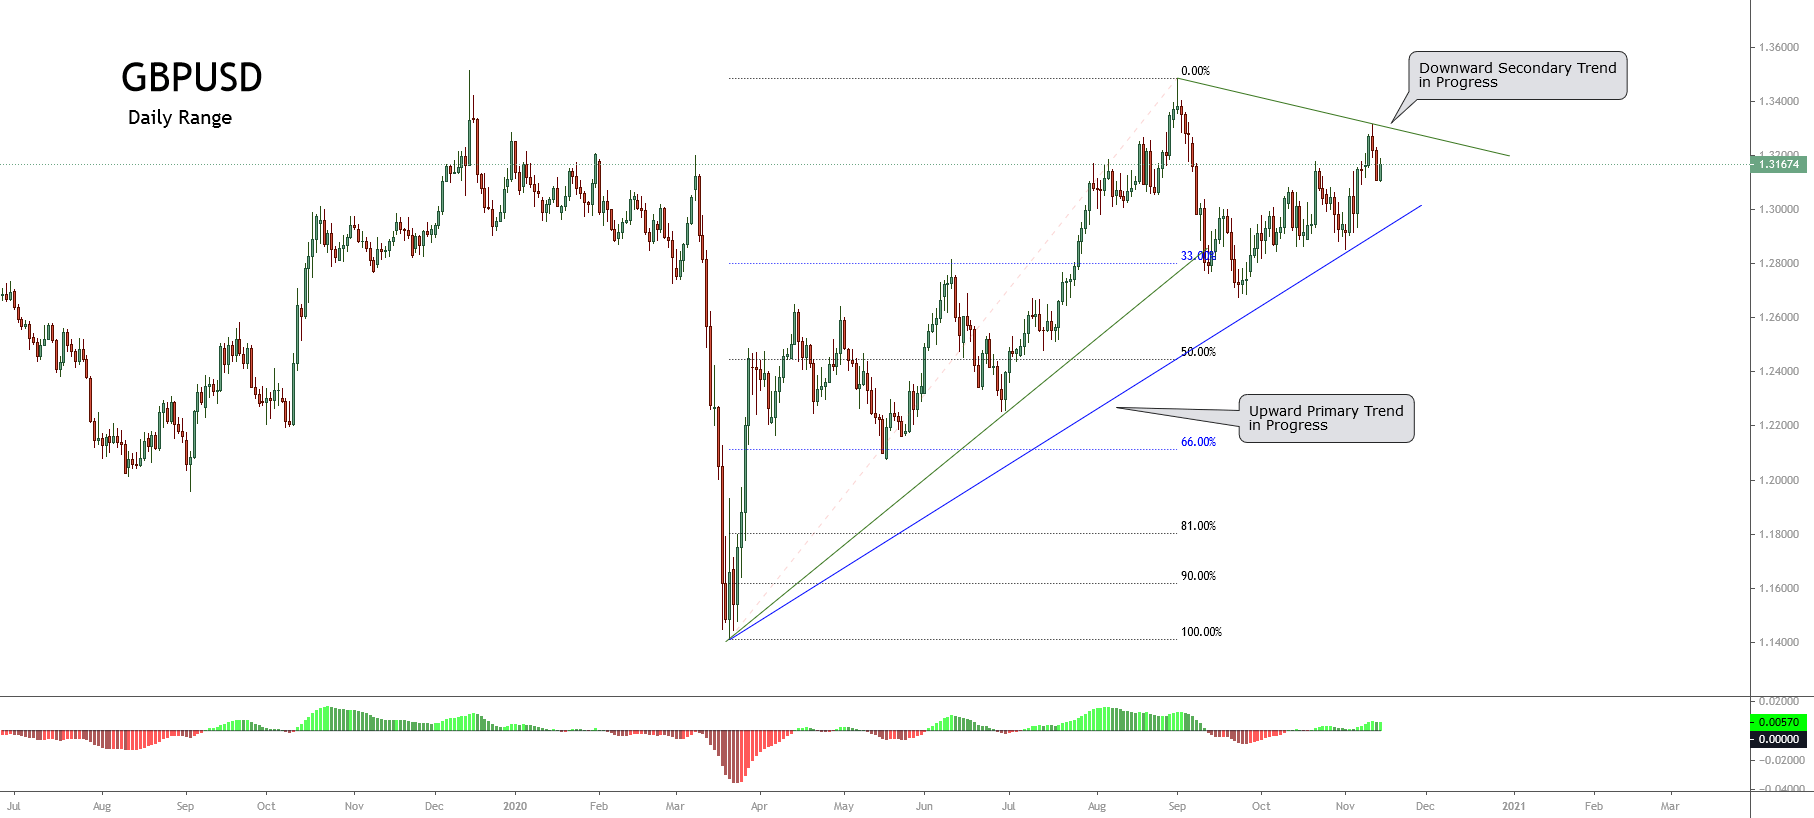
In this context, according to Dow Theory, the price retraced below 33% of the first upward movement, which accomplishes with the minimum requirement for a correction of the previous move of a similar level.
Nevertheless, considering that the price remains in a short-term downward trend, the price could continue developing a new bearish sequence.
Short-term Technical Outlook
The short-term Elliott wave outlook for GBPUSD unfolded in its 8-hour chart reveals the corrective rally that corresponds to an incomplete wave B of Minor degree identified in green, which leads us to expect a decline in a five-wave sequence for the following trading sessions.
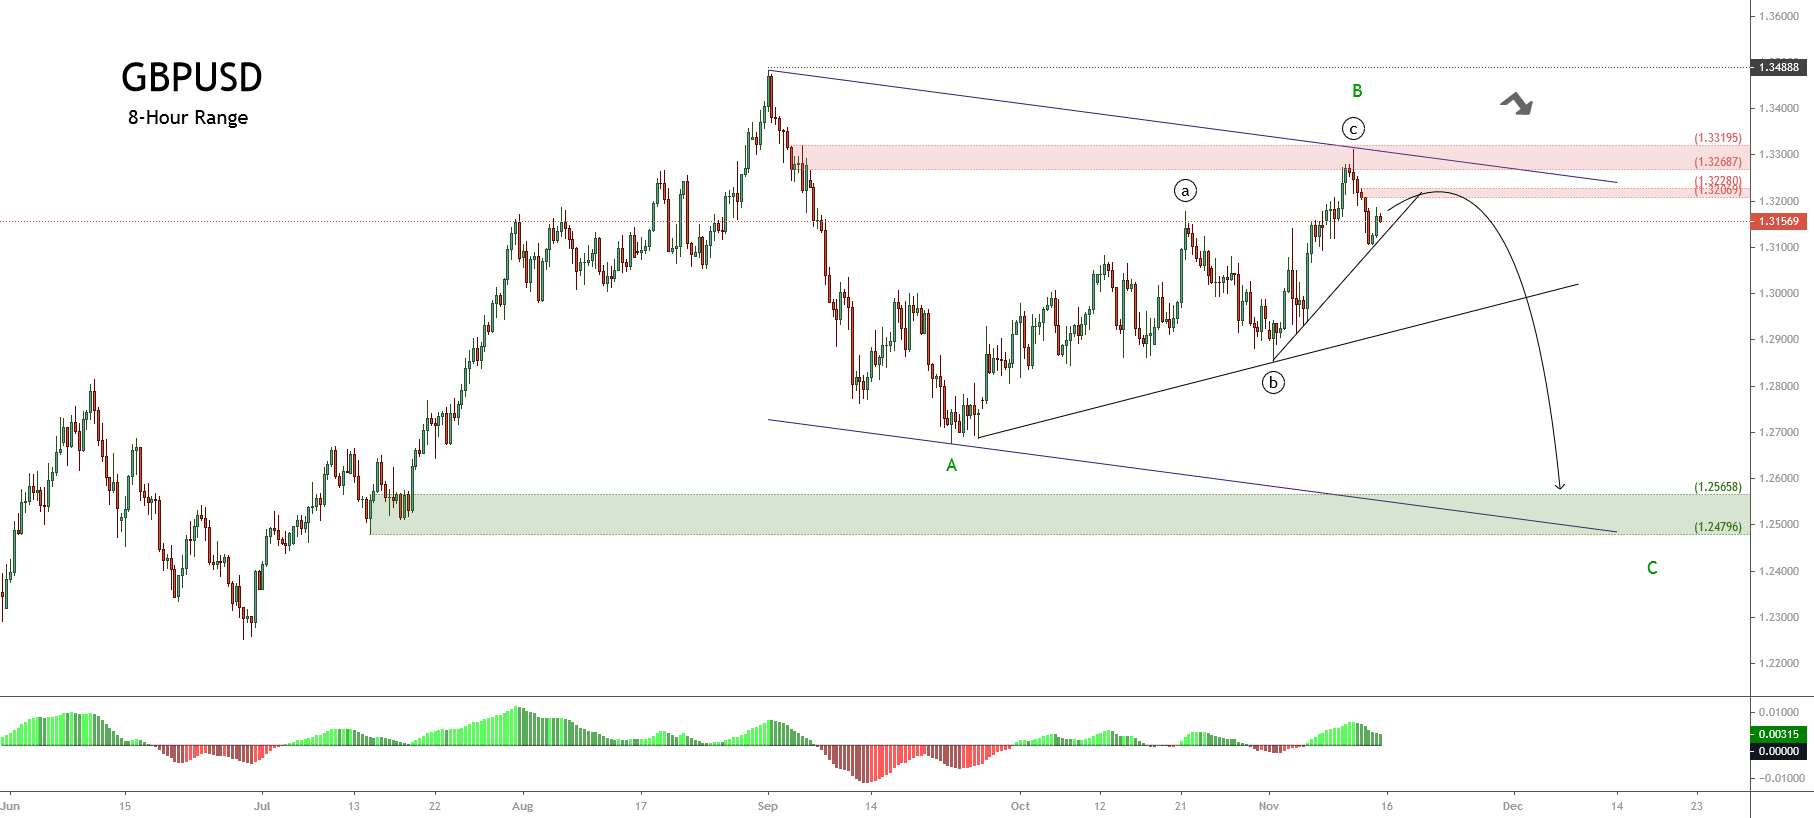
The previous chart exposes a corrective structural series that began on September 01st when the price found fresh sellers at 1.34832 and dragged the cable until 1.26751 on September 23rd, where the pound started to advance in its wave B that remains in progress.
In this regard, the current upward movement could find resistance in the first supply zone between 1.32069 and 1.32280. If the price extends its previous progression, creating a bull trap, it could climb until 1.33195. There, the price could start to decline in a five-wave sequence corresponding to wave C identified in green.
The potential next wave C could extend until the demand zone between 1.25658 and 1.24796, which corresponds with the mid-term descending channel’s base.
Finally, the bearish scenario’s invalidation level locates at 1.34832, which agrees with the origin of wave A in green. Nevertheless, before positioning on the downward side, the GBPUSD pair should confirm (or discard) the bearish entry.