Overview
The French index CAC 40 develops an incomplete triangle pattern that began in late August 2000. This year, CAC 40 underperforms 17.51% (YTD), recovering from the losses that dragged it to plunge until 3,632.1 pts, losing over 39.6%. The long-term outlook leads us to foresee a potential limited upside before to resume its drops corresponding to the incomplete bearish sequence in progress.
Market Sentiment Overview
The CAC 40 index, in its daily chart, unveils the advance mostly sideways since the price found resistance in the June’s high located at 5,213.7 pts. The current trading zone coincides with the mid-region of the 52-week high and low range, which leads us to observe that the market sentiment remains with a weak bullish sentiment. At the same time, we distinguish the French Index moving between the 60-day and 200-day moving average, which confirms the consolidation sequence that the French index remains in progress.
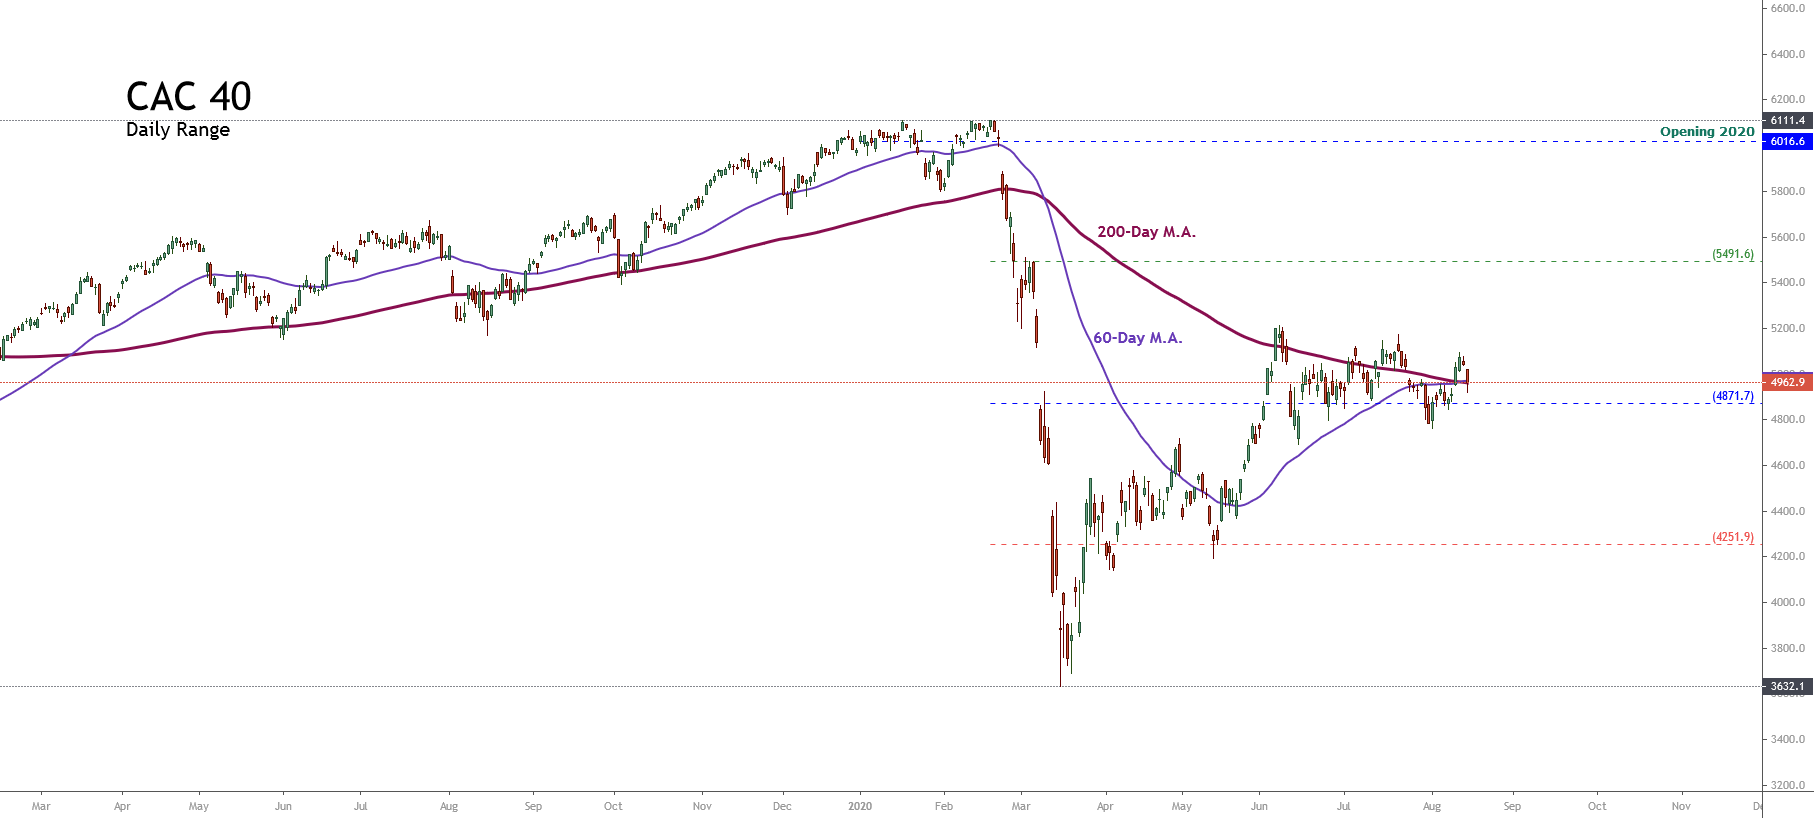
Nevertheless, considering that CAC 40 underperforms 17.51% (YTD), we observe that the Fresh index remains under bearish pressure, on the other the consolidation above the 4,871.7 pts., that corresponds to the 50% of the 52-week high and low range, the sideways formation could drive to CAC 40 to develop a limited upside before to resume a new decline.
Elliott Wave Outlook
The French stock market tracked by the CAC 40 index moves in a triangle pattern that began in late August 2000 when the market participants carried up the price until its record high at 6,944.8 pts. Once the price found resistance below the 7,000 pts, the French index started to move sideways, developing a triangle formation that remains incomplete.
The next figure illustrates to CAC 40, in its 2-week chart and log scale, under the Elliott wave perspective. The French index develops an incomplete triangle pattern (3-3-3-3-3), which moves in wave ((4)) of Primary degree identified in black.

The corrective structural series that remains in progress since the French index topped at 6,944.8 pts in late August 2020, currently develops its wave (E) of Intermediate degree identified in blue. Simultaneously, according to the Elliott wave theory, wave (E) must have three internal segments. In this context, from the figure, we distinguish that the price action completed the first bearish leg corresponding to wave A of Minor degree identified in green, which found a bottom at 3,632.1 pts on last March from where the price started to bounce, developing the wave B that remains in progress.
Currently, CAC 40 advances in its wave B of Minor degree labeled in green. Once completed this internal leg, the French index should resume its declines, with a possible support level located at 3,600 pts, even if it could extend until 2,957 pts.
Finally, once completed the long-term corrective sequence corresponding to wave ((4)), CAC 40 should start a new long-term rally corresponding to the fifth wave of Primary degree.