With this publication, we will look at an incredible method of market analysis based on the volume Volume Spread Analysis (VSA), developed by the famous American financial analyst Tom Williams and published in the book «Master the Markets». This is an unusual view that deals with how market makers manipulate crowd behavior.
Not to recount the book, so in this series of articles, we will focus on the practical side of the method with a traditional reference to cryptocurrency trading. You can apply this method to any financial instrument, my examples will be in the BTCUSD pair.
Now, let’s discuss the theoretical principles of price formation in the market and how large capital traders influence the market. I will define the main concepts that I will use throughout the course. Therefore, you should study this article if you are interested in VSA and want to better understand the actions of large traders.
What are Trading Volumes?
Even if you’re just starting your trading career, you’ve probably found the following phrase: “The market goes up when demand prevails oversupply. And, on the contrary, the market will suffer a decline at the moment when supply is surpassing demand”. We need to study the principles suggested by this phrase in order to better understand what the volume of trade means.
For those who could not find a similar term, I must explain that, in trading, is the number of lots traded on the market within a specific period. Firstly, it should be understood that the volume taken in isolation does not provide much information. But, if what we do is compare the current volume with the previous day’s volume, or a week earlier…, you will see clearly the changes in business activity.
To better understand market processes, let us compare a change in volume with the price differential. This will show the feeling of the great players: bullies or bassists. Remember, the spread is the difference between high and low prices during a particular period.
In practice, price movements do not always correspond to current market activity. There are often cases where, after a small increase in volume, the price increases sharply, confusing many traders. But if you have already studied the concept of inertia, then you will have everything clearer. Then, in this situation, the market can be compared to a car in which driving at high speed will go uphill for a while, even if the driver has taken his foot off the accelerator.
What is Volume Spread Analysis?
The VSA method provides a complex approach to market analysis, which defines the relationships between asset price, spread, and volume. The last indicator shows the activity in the market. While the spread speaks of the amplitude of the price movement.
In establishing the relationships between these two characteristics, we strive to identify the imbalance between demand and supply. For the most part, it is a consequence of transactions opened by large operators, and in the trading environment, it is considered one of the most significant reasons for the market to move in one direction or another. In turn, knowing the imbalance and the true causes of its occurrence, we can easily predict the direction of future price movement.
Principles for the Movement of Assets
Volumes, like stock market trends, are also divided into bullish and bearish. The bullish volume increases the volume in the upward movements and decreases the volume in the downward movements. Consequently, the bearish volume increases the volume in downward movements and decreases the volume in upward movements.
Now let us examine the concepts of accumulation and distribution…
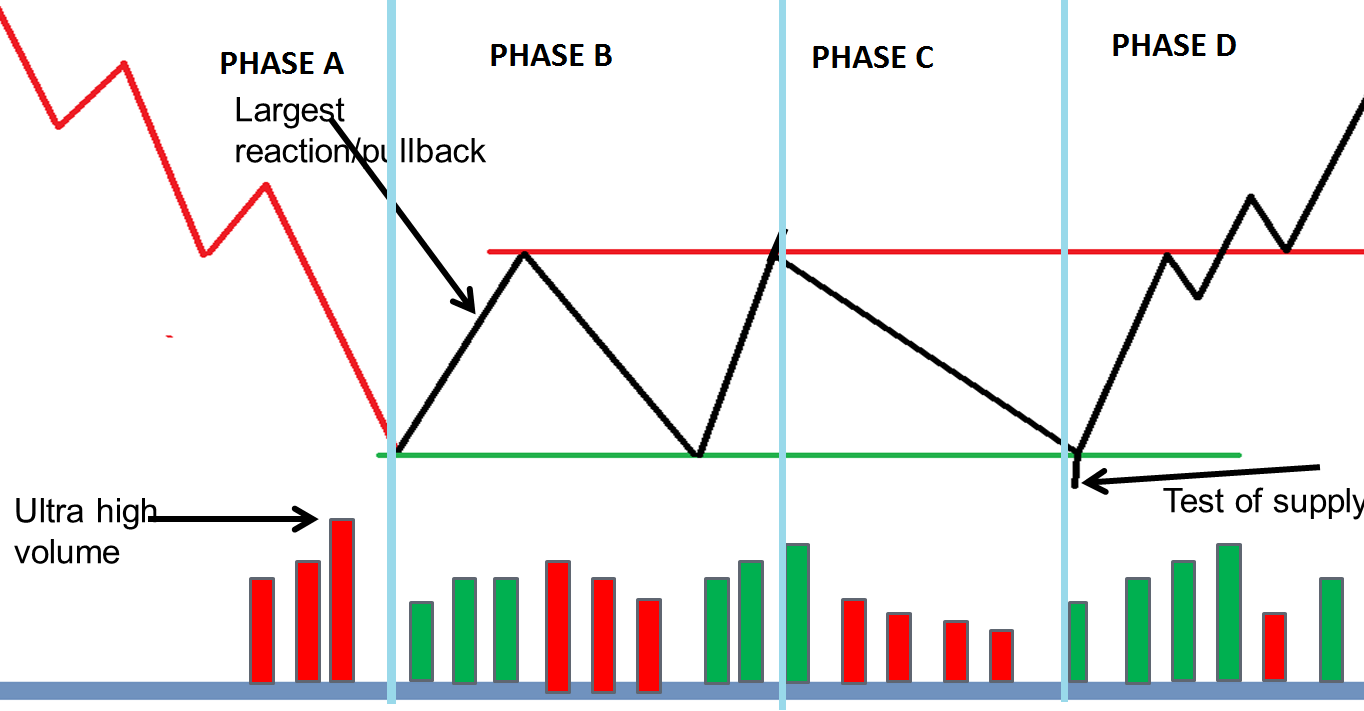
Cumulation means buying as many shares as possible, without significantly increasing the price compared to your own purchase, until there are few or no shares available at the price level you have been buying. This purchase usually occurs after a bearish move in the stock market and there are the best prices to buy.
Once most shares have been removed from the hands of other traders (ordinary natural persons), there won’t be much action left to sell at an additional price. In other words, resistance to the bullish movement has been neutralized. Then, in this situation, we can expect a steady increase in prices until syndicated traders perceive prices too high to sell those assets that just bought.
Distribution is the sale of assets, which should ideally be achieved without lowering the price against the sale of the market maker. This operation is done to take advantage of the profits of selling at the conditional peak of a bullish market. At the same time, most of these great players place large orders not even at a fixed cost, but at a range of prices.

If the total volume of transactions is so large that prices are forced to fall, the sale is suspended. Traders have another opportunity to sell securities profitably in the next wave upwards. Once professionals have sold most of their holdings, a bearish market begins because markets tend to fall without professional support.
Now, you understand that big forks see both sides of the market at the same time, which gives them a big advantage over common traders. To better understand the market, study the concepts of strong and weak holders.
Strong forks are professionals who have convenient positions and are able to easily read the market. Despite their ability, they can open more unprofitable operations than profitable ones, but close them quickly, considering losses as inevitable trading costs.
Weak holders are often new market amateurs, tied to their capital and therefore make emotional decisions, which are often at odds with common sense. They are often subjected to market pressure when prices turn against them, which is why they suffer heavy losses.
If we combine these concepts with those described above, we can summarize that: a bullish market is like this when a significant transfer of shares from weak holders to strong holders, usually with a loss for weak holders. A bearish market occurs when there has been a substantial transfer of shares from strong holders to weak holders, usually with a gain for strong holders.
When the market moves from one major trend state to another, an event called a buying or selling climax will occur. As a definition, it is an imbalance of demand and supply that causes a bullish market to become a bearish market or vice versa.
The climax of the purchase arises at a time of high demand for the asset and the active dumping of securities by the big players, which makes continuous growth impossible. In addition, in the bullish bar, the volume looks exceptionally high, accompanied by a new maximum and a widespread. At the end of the purchase climax, the market will close in the middle or high of the candle.
The selling climax, as seen in the name, is the exact opposite of a buying climax and usually occurs at the time of high sales. It presents an extremely high volume in downward movements, accompanied by wide spreads, with the price entering the local minimum. In the last phase of the sale climax, the price will close in the middle or under the candle.
Causes of Price Reversal
There are only two main reasons why there is a reversal of long-term trends in the market:
- Most traders panic after observing substantial drops in a market (often from bad news) and usually follow their instinct to sell. Professional traders, in turn, think differently, asking a question: “Are big market players prepared to buy mass stock at these price levels?” If this is fulfilled, this will be a sign that indicates the strength of the market.
- After substantial increases, usually for good news, most will get angry by missing the upward movement and will rush to buy. At this point, their professional colleagues are only interested in the willingness of big players to sell enough securities at the current price to meet demand. As you’ve already guessed, mass sales are a sign of market weakness.
Fundamentals of Market Reading
First, it is necessary to understand that markets move in so-called phases. Looking at the changes in volumes and price spreads, we can see that the market builds a cause for the next phase. The duration of the phases may vary. At the same time, it is normally assumed that short phases lead to small changes, while long ones lead to serious steps. In addition, we will group spreads in width, narrow, or simply average, which will allow us to delve into the current processes.
Definition of Market Strength
Marketers generally process and match purchase and sale orders from traders around the world. It’s your job to create a market. To perform its functions, the creator must have sufficiently large participation or values. If you do not have enough quantities on your books to trade at the current price level, you can move the price to a more appropriate level.
Often there are situations in which the bullish movement manages to get a better price from the floor of the bag. Why are you getting a good price? Incredible kindness from the creators? The reason is different. In fact, the market value perceived by market makers is much lower than theirs, because they have already received enough sales orders and want to get rid of them quickly, expecting a reversal of the trend or at least the transition from the market to the uncertainty stage.
Such action, repeated many times with any other buyer, will tend to reduce the spread of the day towards contraction. In other words, the upper price limit will be minimal. If, on the other hand, market makers have a bullish view, they will increase the price on their purchase order, giving you what appears to be a low price. This, repeatedly, causes the spread to expand as the price is constantly marked during the day.
Then, by simple observation of the extension of the bar, we can know the references of those who can see both ends of the market.
Another example is when you find market gaps or price gaps. This term in the technical analysis refers to a situation where there is a gap between the closing of the first bar and the opening of the next bar. For example, the market opens when market makers trap as many traders as possible in a potentially weak market and lose trades and create additional stress. As a rule, weak gaps are always in the zones of new highs, when the news is good and the bullish market seems to last forever.
It should be noted that gaps can be seen in strong markets. However, in such cases, a serious difference can be noticed in the form of an extended plane. Traders who have been trapped inside the channel will panic, convulsively trying to exit the trade at a price very similar to what they first entered. Some of them expect a break in price after having bought assets close at the upper limits of the channel. Others bought at the bottom, but do not see any serious upward movement.
In turn, professional traders are aware of the situation and, looking for the time it takes to sell their own assets, to keep the bullish sentiment raise prices, or open a new candle with a gap up. The volume increases, substantially supporting the movement. This leads to the conclusion that the movement of price is not a deceptive maneuver and the big players really see the strength of the market.
Broad spreads in most cases are designed to block most traders out of the market rather than trying to absorb them. This will tend to postpone, as it goes against human nature, buying something today that could have been bought cheaper yesterday. Such manipulations also frighten market participants who opened short positions near the last minimum in the constant bad news that appeared during this period.
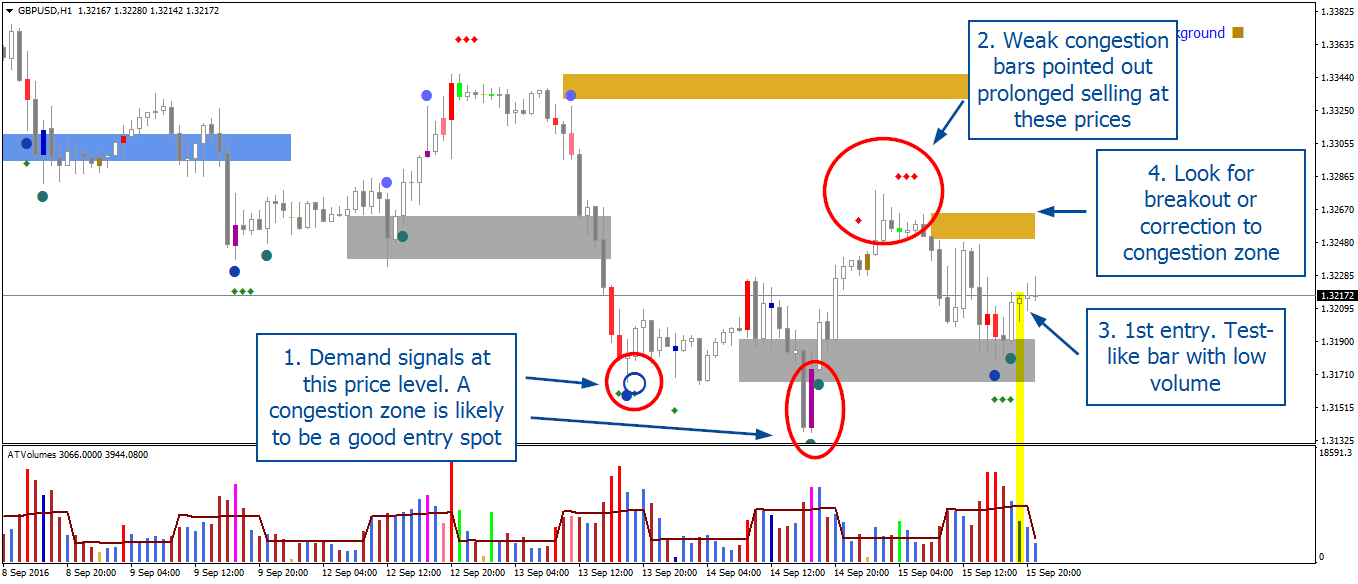
So we draw an obvious conclusion. The volume that usually shows a healthy increase is the bullish volume. However, excessive volume is never a good sign, this indicates that supply can saturate demand. The low volume warns you of a clearly misleading upward movement. In this case, professionals perceive the market as weak, refusing to participate in the bullish movement. The amplifier of this signal will be the presence of a flat before the price jumps to low volumes.
We must also pay attention to the low volume rates in the downbars. This is a sign that the strength of the upward trend remains high, and the upward movement will continue in the foreseeable future.
For a bearish movement, the indications are the opposite. A bearish trend is strong when the falling bars have a high volume. However, excessive volume warns that the fall in price may not be natural and that demand may affect supply.
If the volume is decreasing on bearish sails, the sales pressure is also decreasing, which means that professionals are not interested in a further drop in prices. The market may be declining for longer due to inertia, but, soon, the price may increase due to insufficient supply.


