Today we’ll go with an entry about a tool that interests a lot of you, the economic calendar, and its impact on Forex trading. It is constantly updated so that you have access depending on the day you are looking at it. To get started, let’s see what this tool is and why I tell you that it is a tool that should interest you a lot if you trade in currencies (or any other type of asset).
Index
- What is the economic calendar?
- Is a Forex calendar important?
- When should I look at the economic agenda?
- What is important in a macroeconomic calendar?
- Trading based on macroeconomic data.
- Technical analysis, fundamental analysis, and the economic agenda.
- Where to look for Forex news data
- Publication of macroeconomic data
- Global indices and commodities
- How do I use the economic calendar?
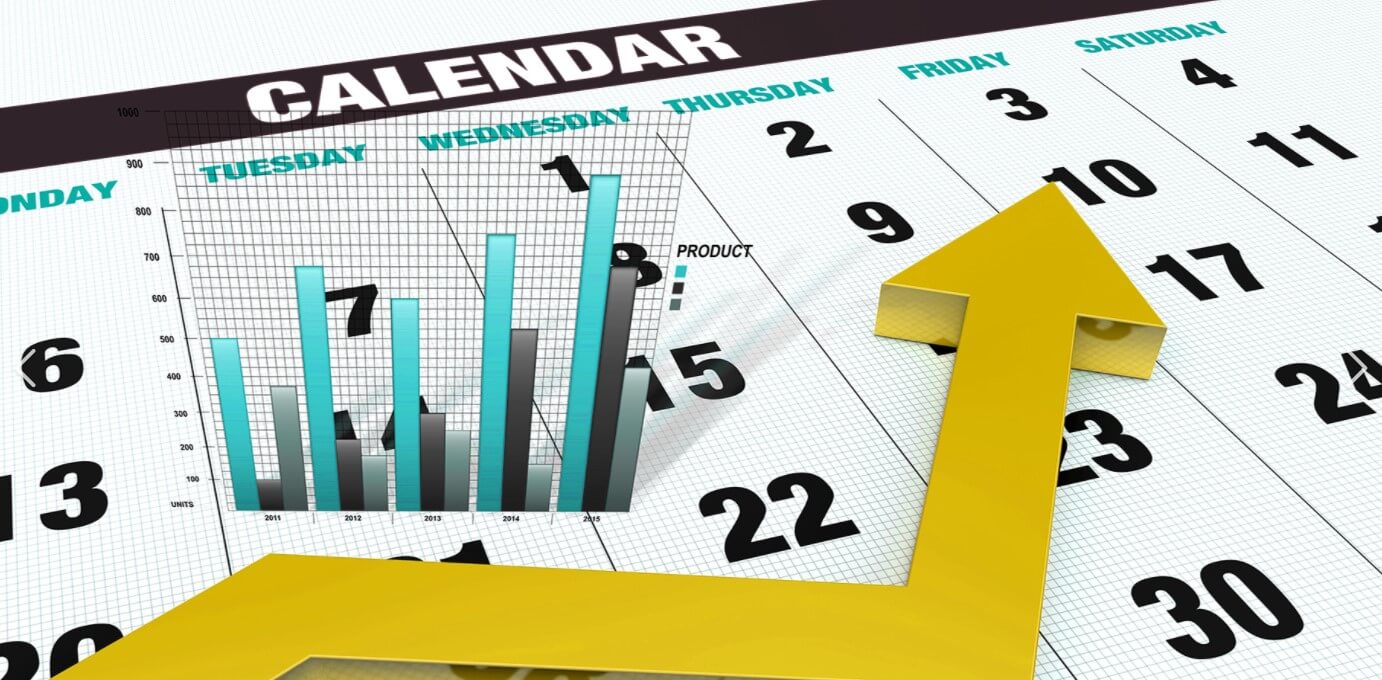
- What is the economic calendar?
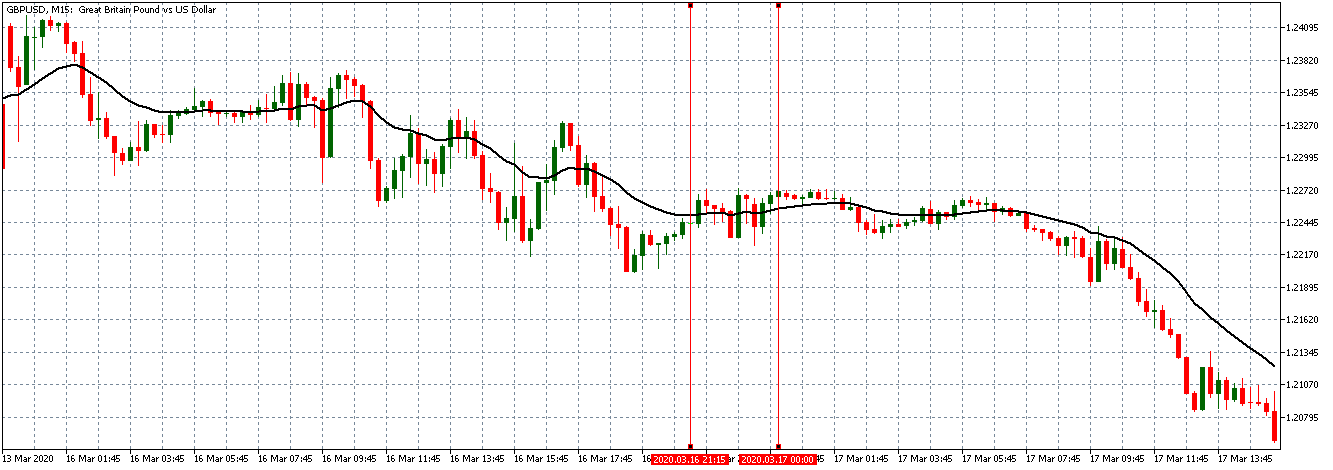
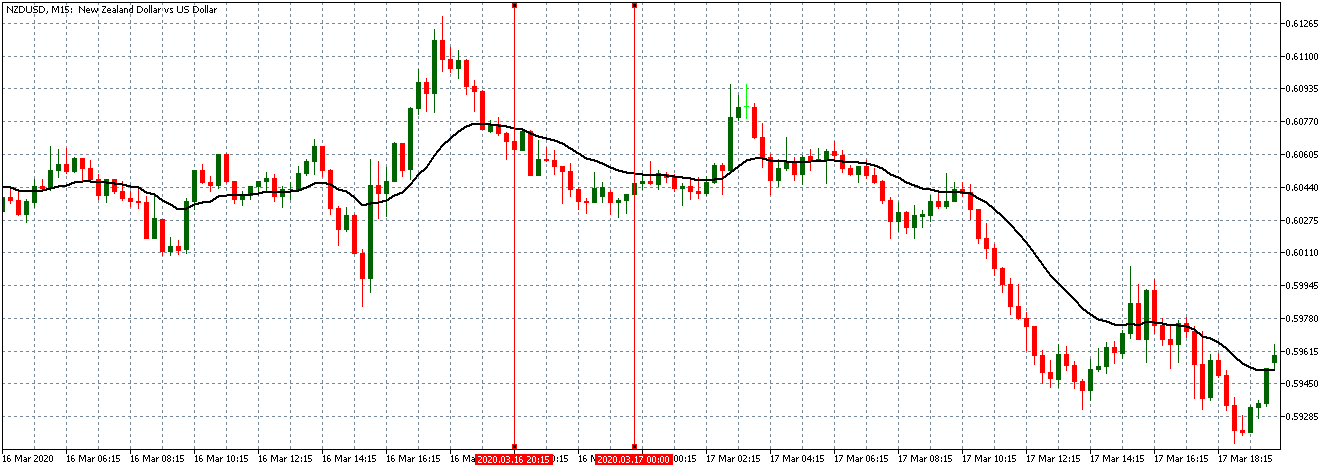
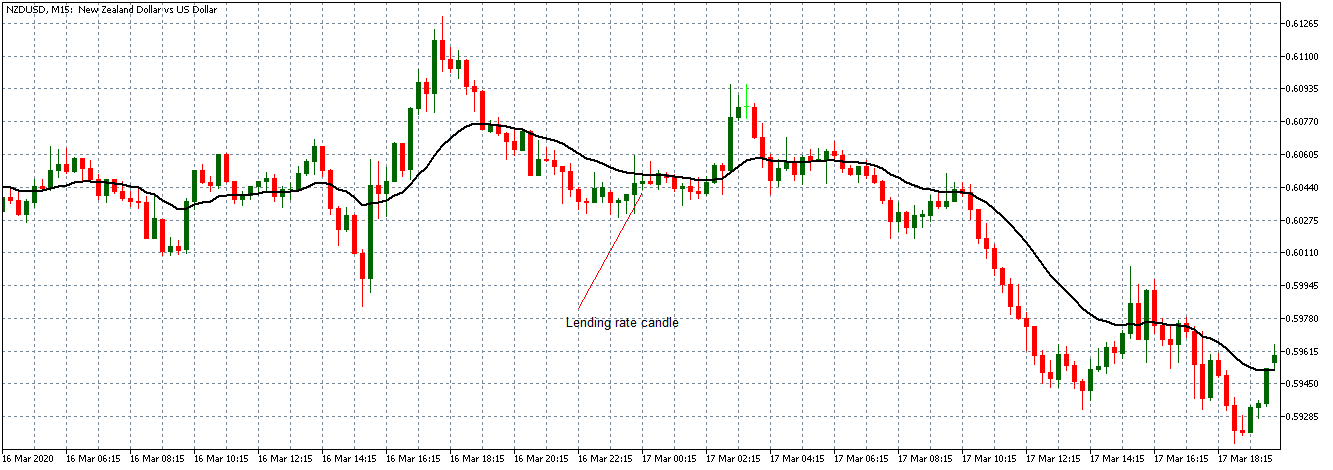
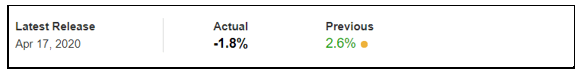
An economic calendar, as its very name indicates, reflects when and what economic issues will be published globally. It can be the decision of interest rates on the part of a country, indices production prices, balance of trade, economic events. In short, it shows you any event that could affect the economy and the financial markets.
- Is a Forex calendar important?
As you know, in the Forex market (as in all) price movements are impacted by the news, macroeconomic data, government decisions, and more. Therefore to follow an economic agenda allows us to know when the greatest movements in the market will take place. We can even use this to not do trading or even as some traders do, do news trading.
- When should I look at the economic agenda?
Depending on the frequency of your trading, if you do swing trading (trades that last several days) it may have little relevance in your trade and just look at it once or twice a week. If on the contrary, your operation is more aggressive, reviewing the economic calendar each day can give you an optimal point of view of the market. You know, more day trading, more focus, which is something that doesn’t sell much but that’s there.
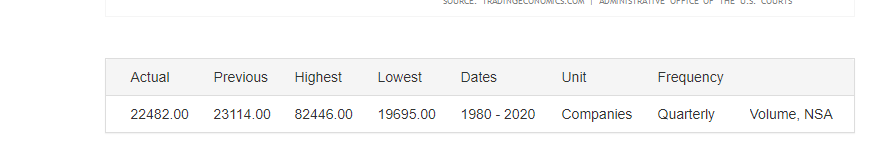
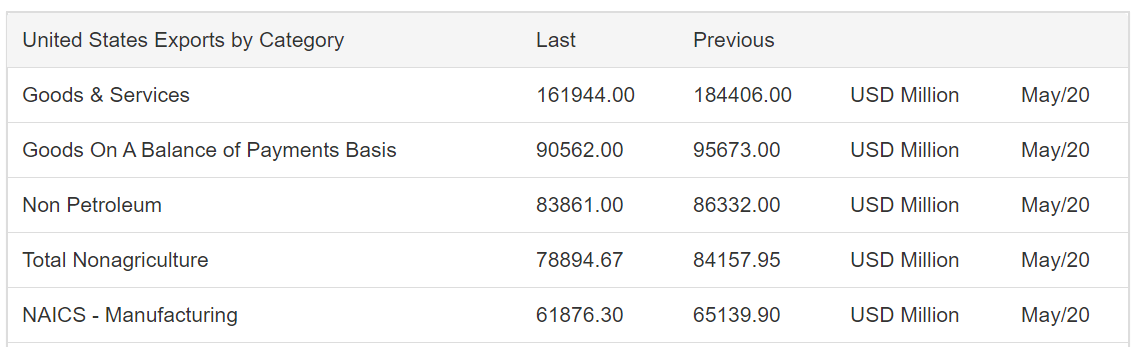
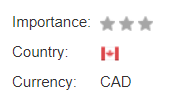
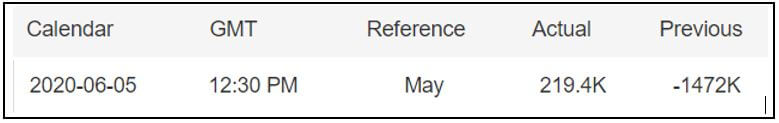
- What is important in a macroeconomic calendar?
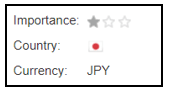
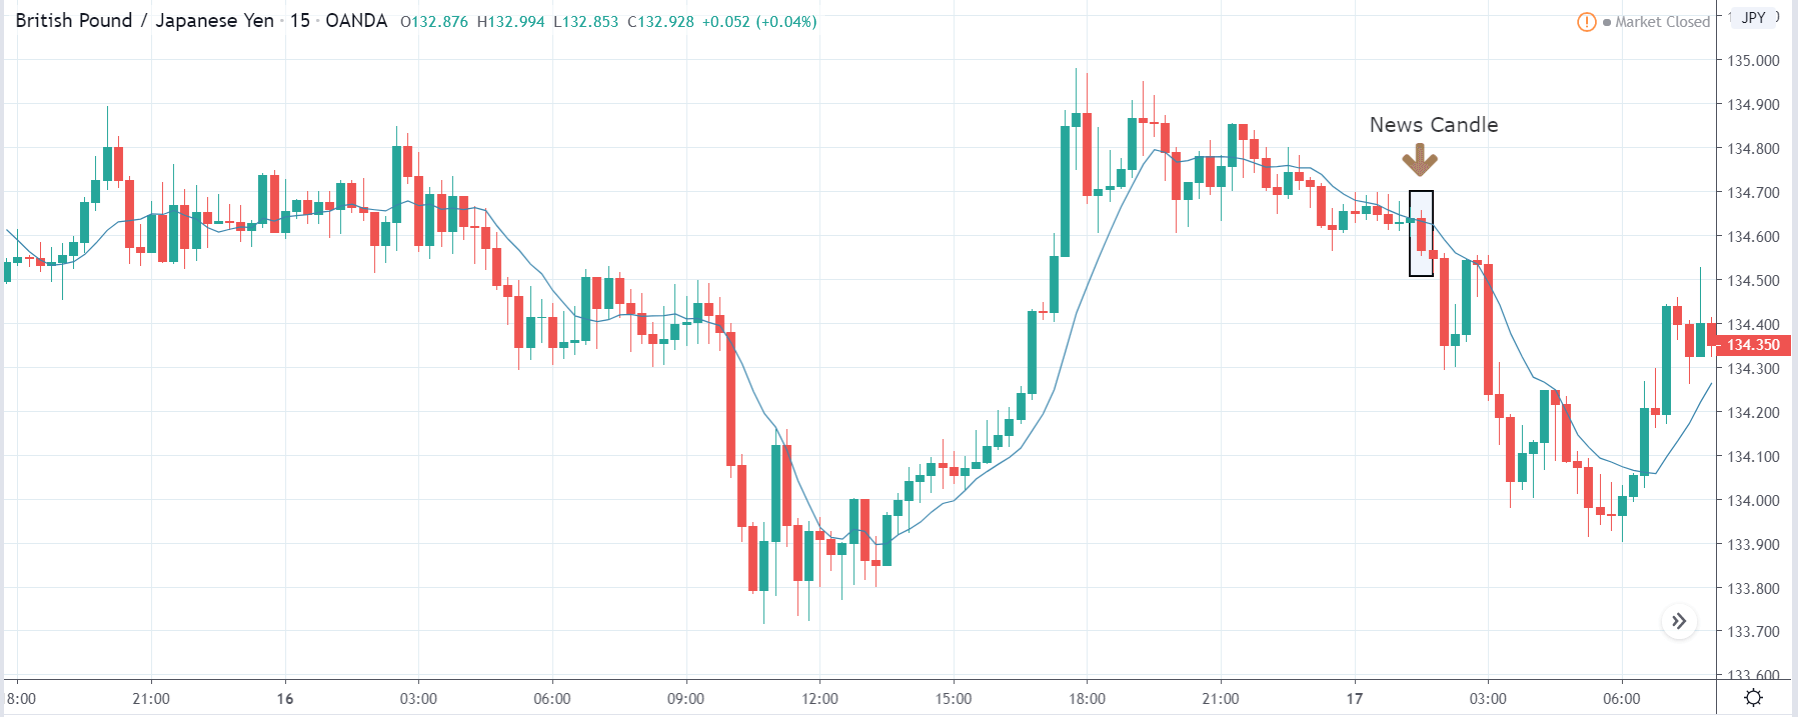
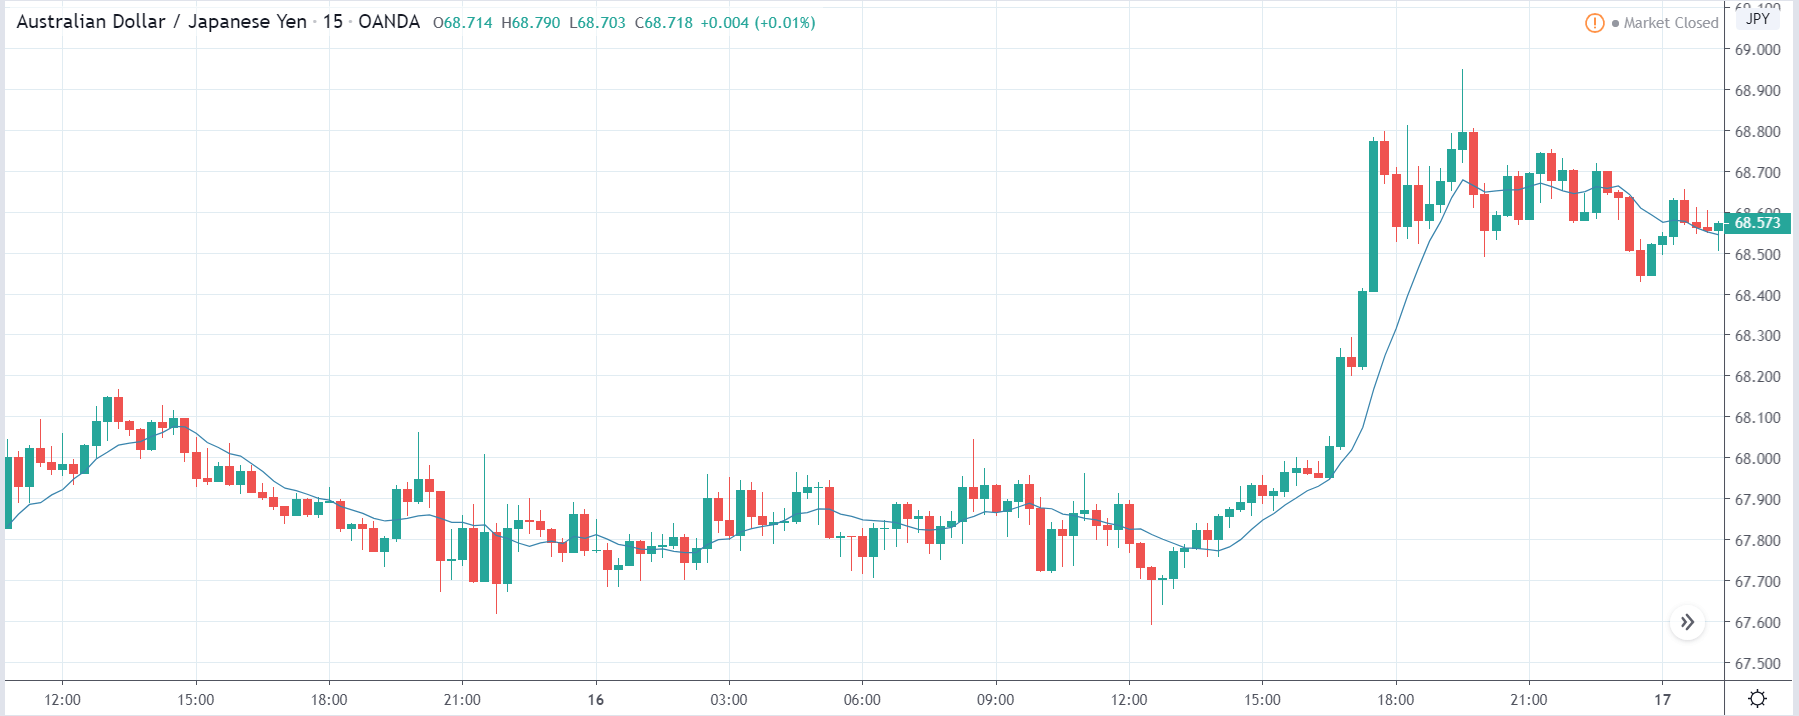
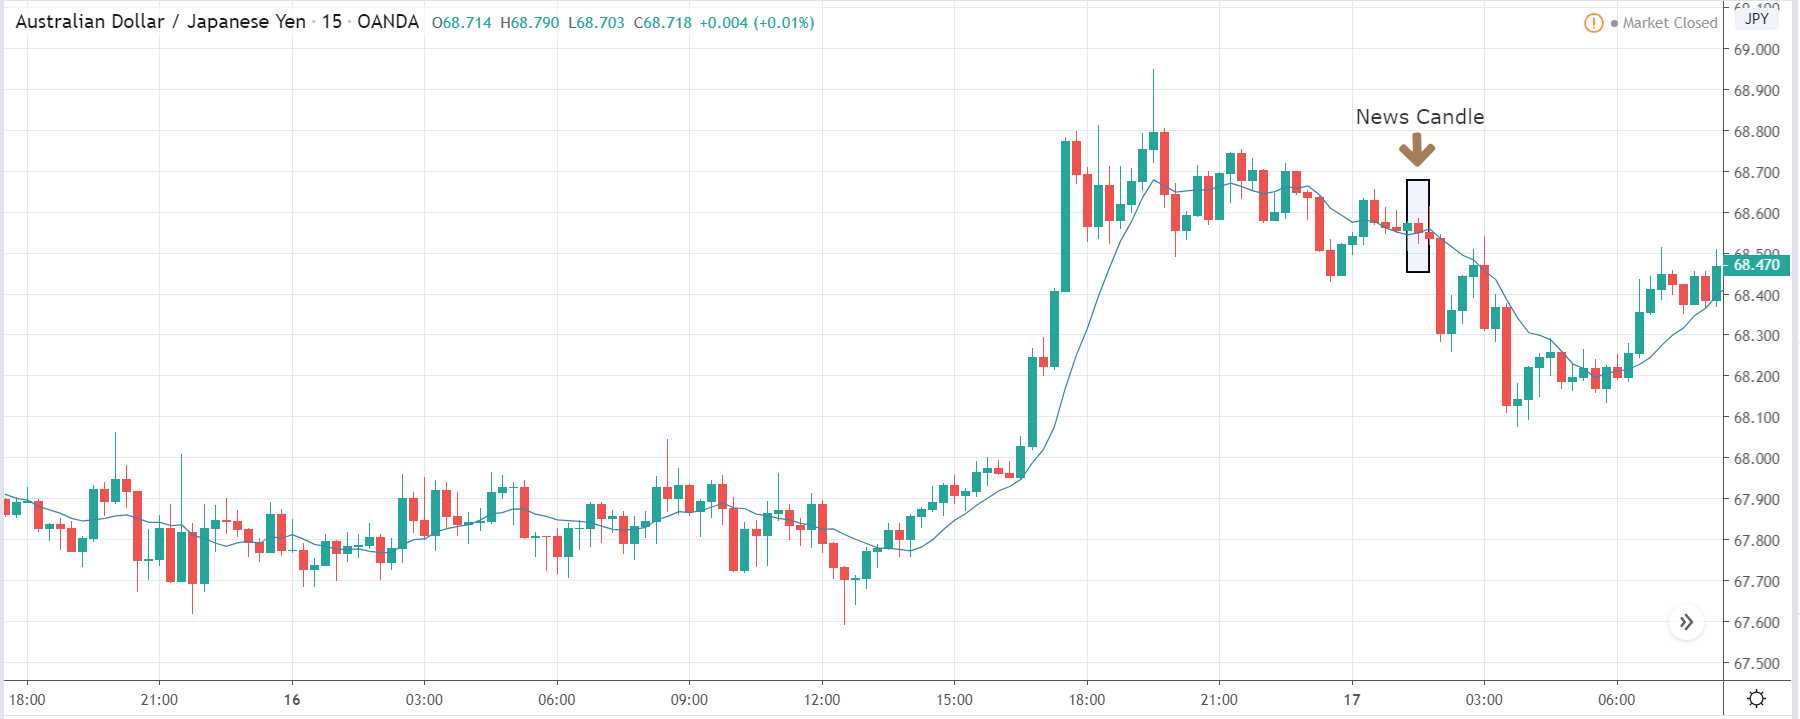
If you take a look at the agenda above you will see that many days have published enough data and many of them are not very important. This you can set to stay only with those that are really important. Even sometimes, those that are a priori important generate little movement in the market. Still, don’t trust yourself.
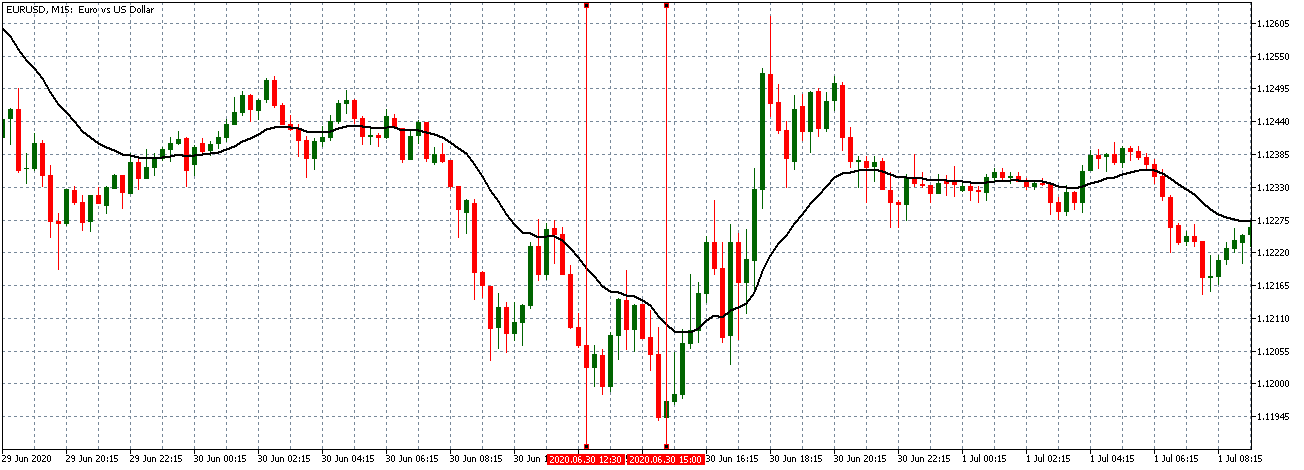
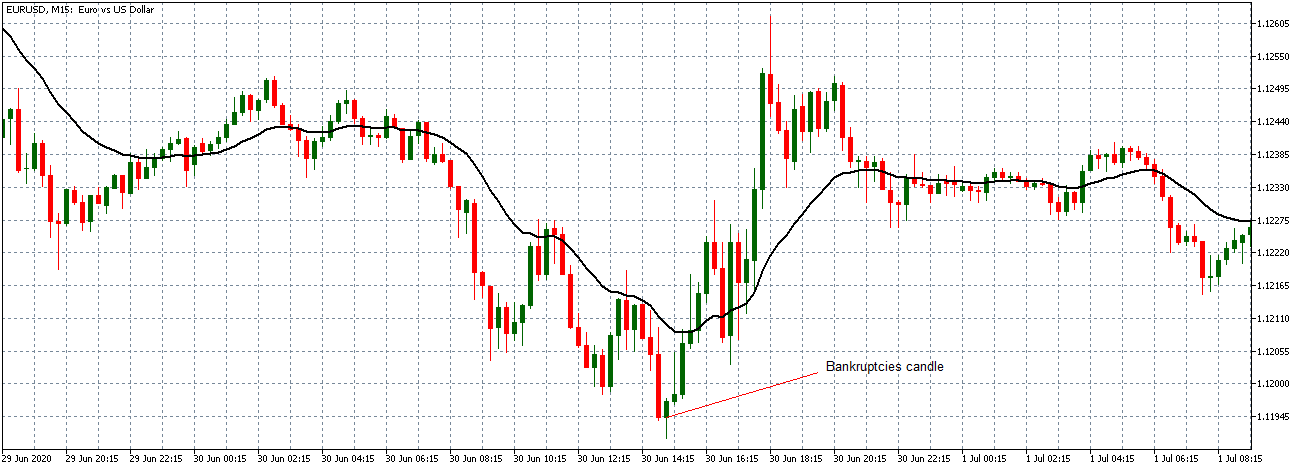
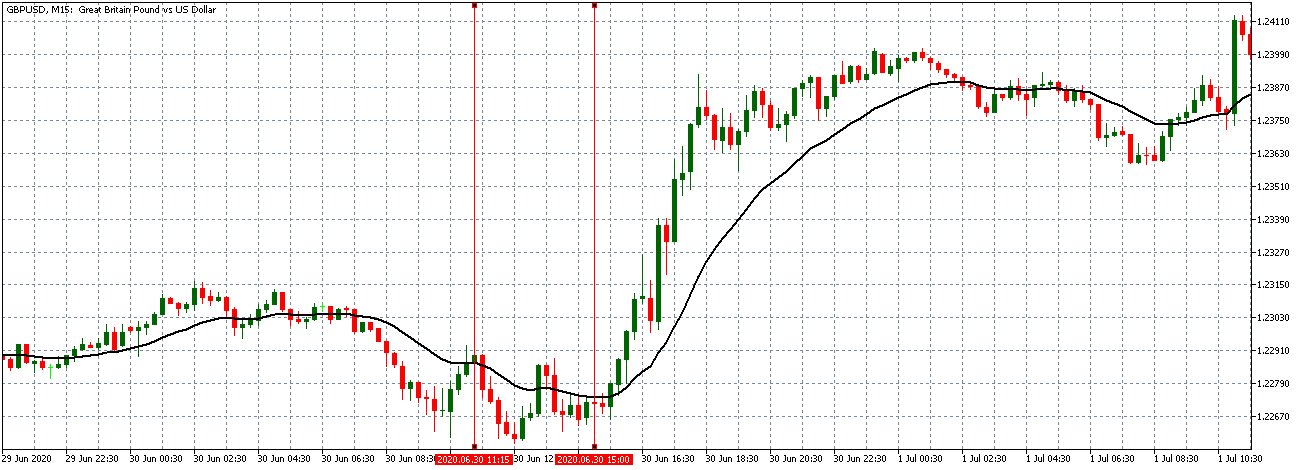
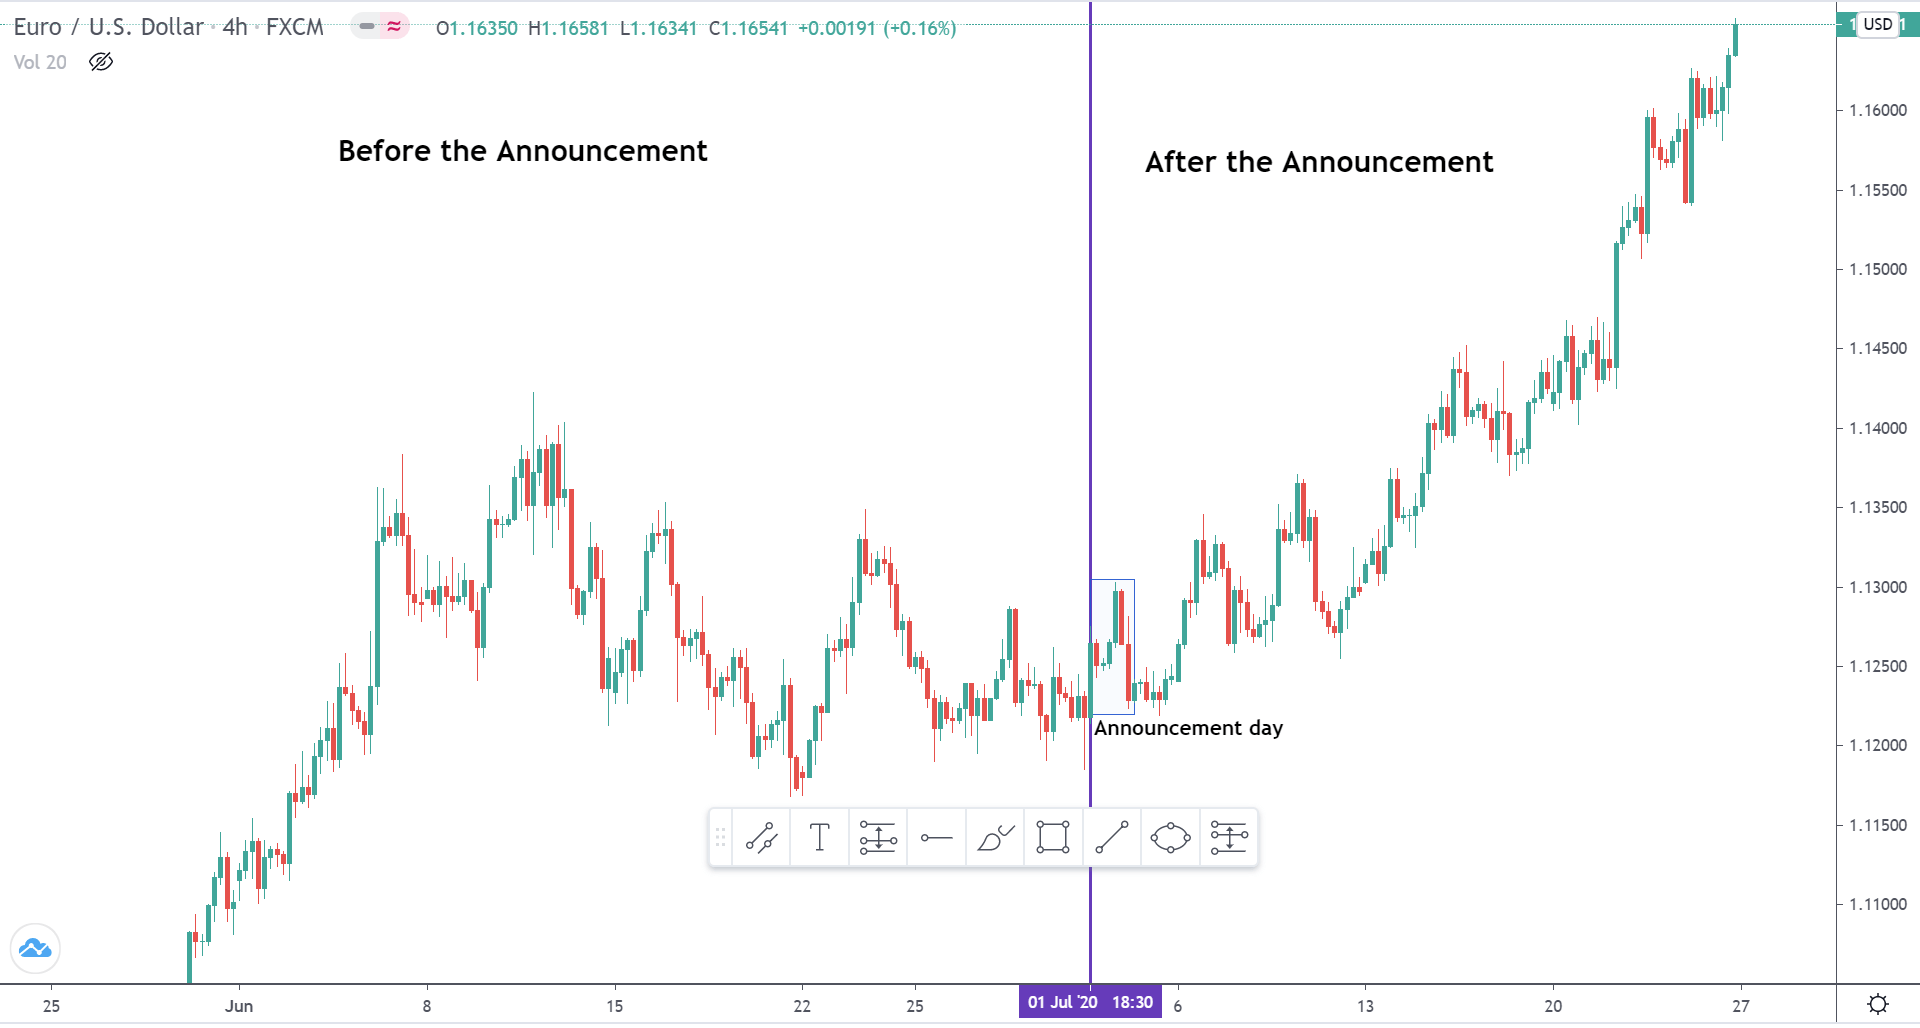
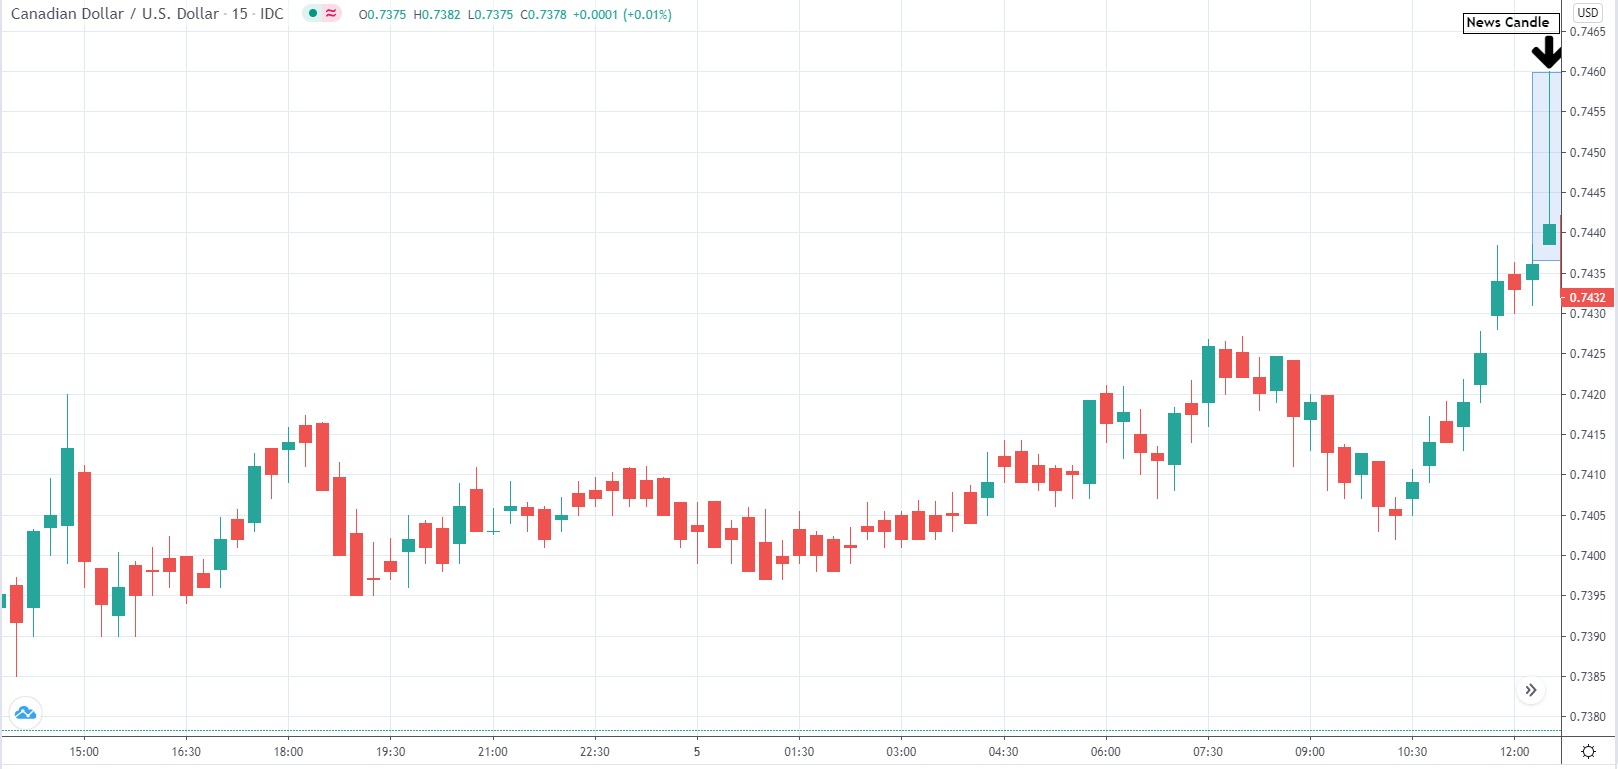
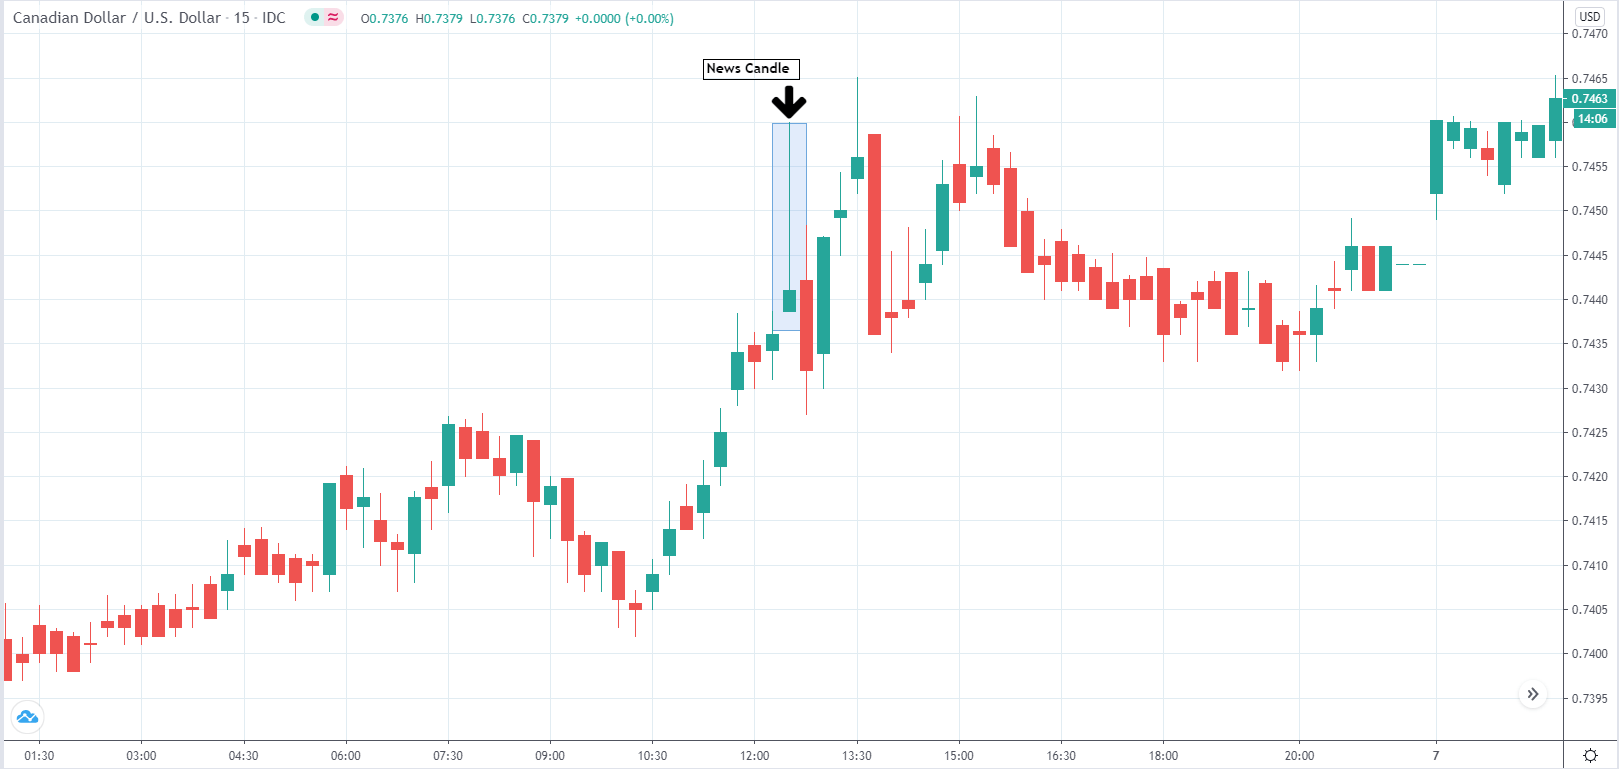
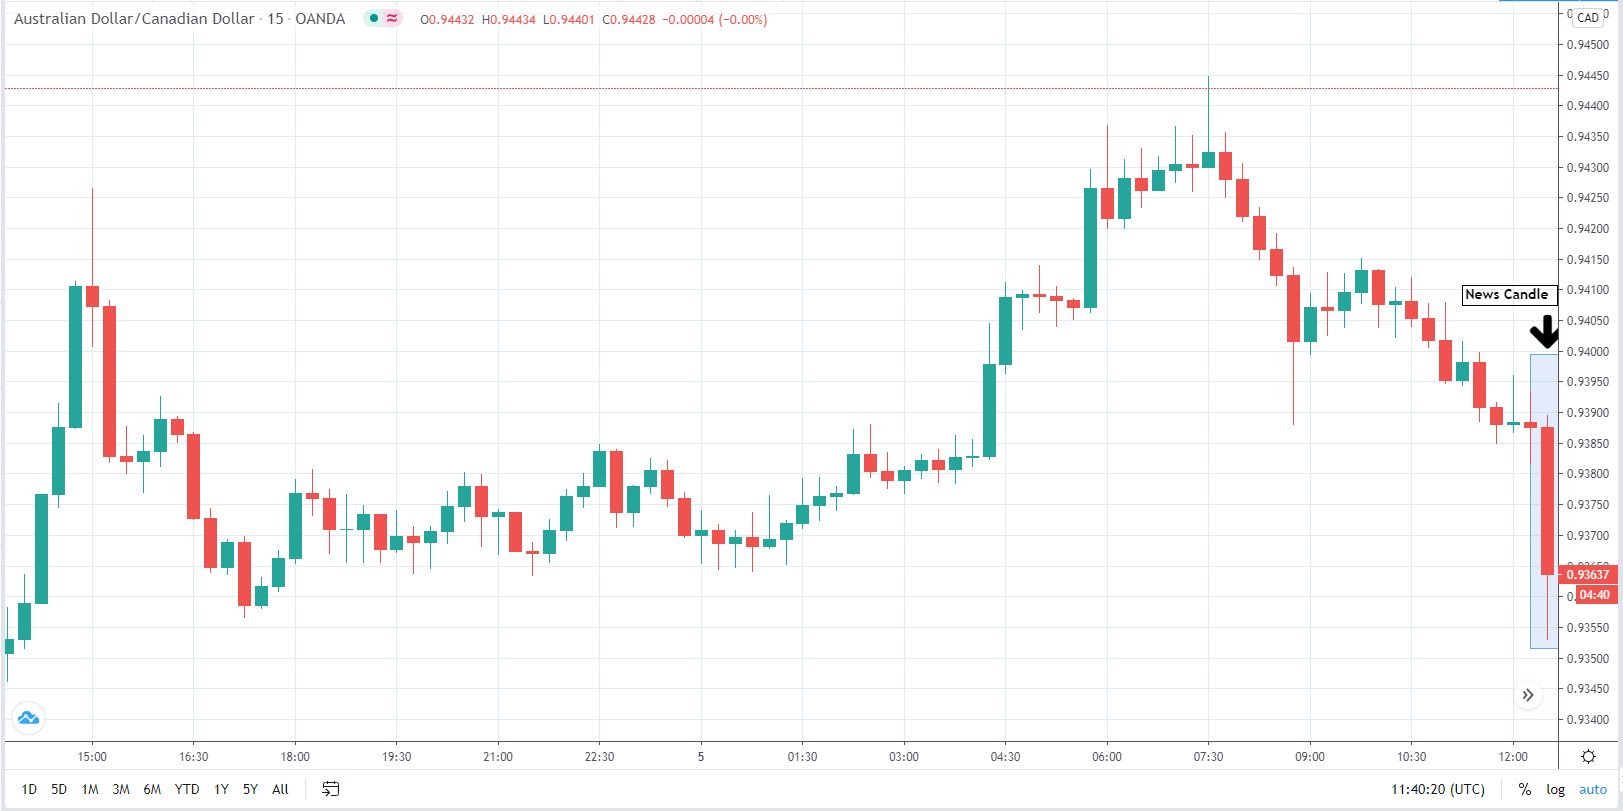
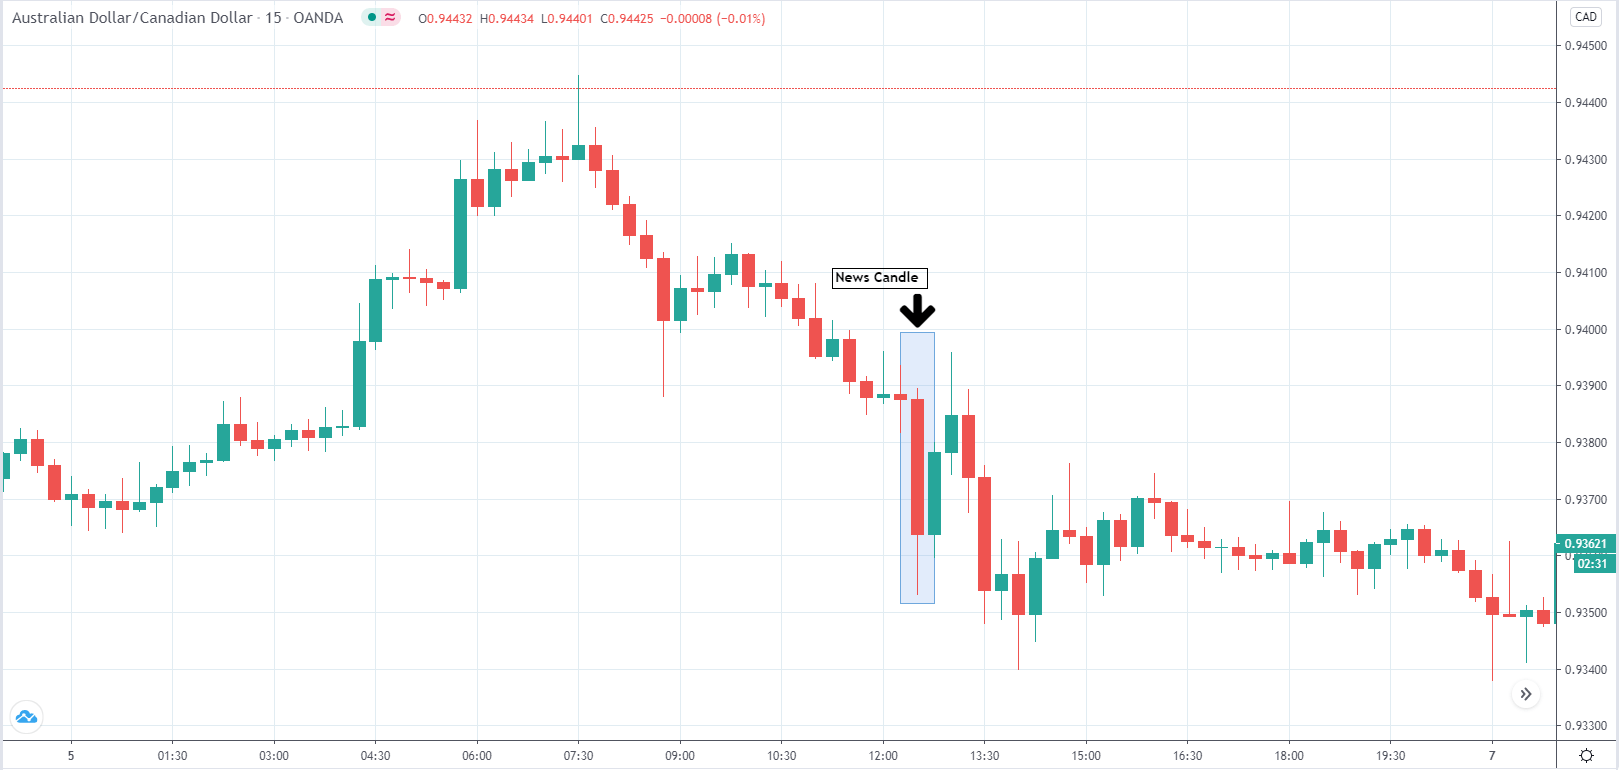
- Trading based on macroeconomic data.
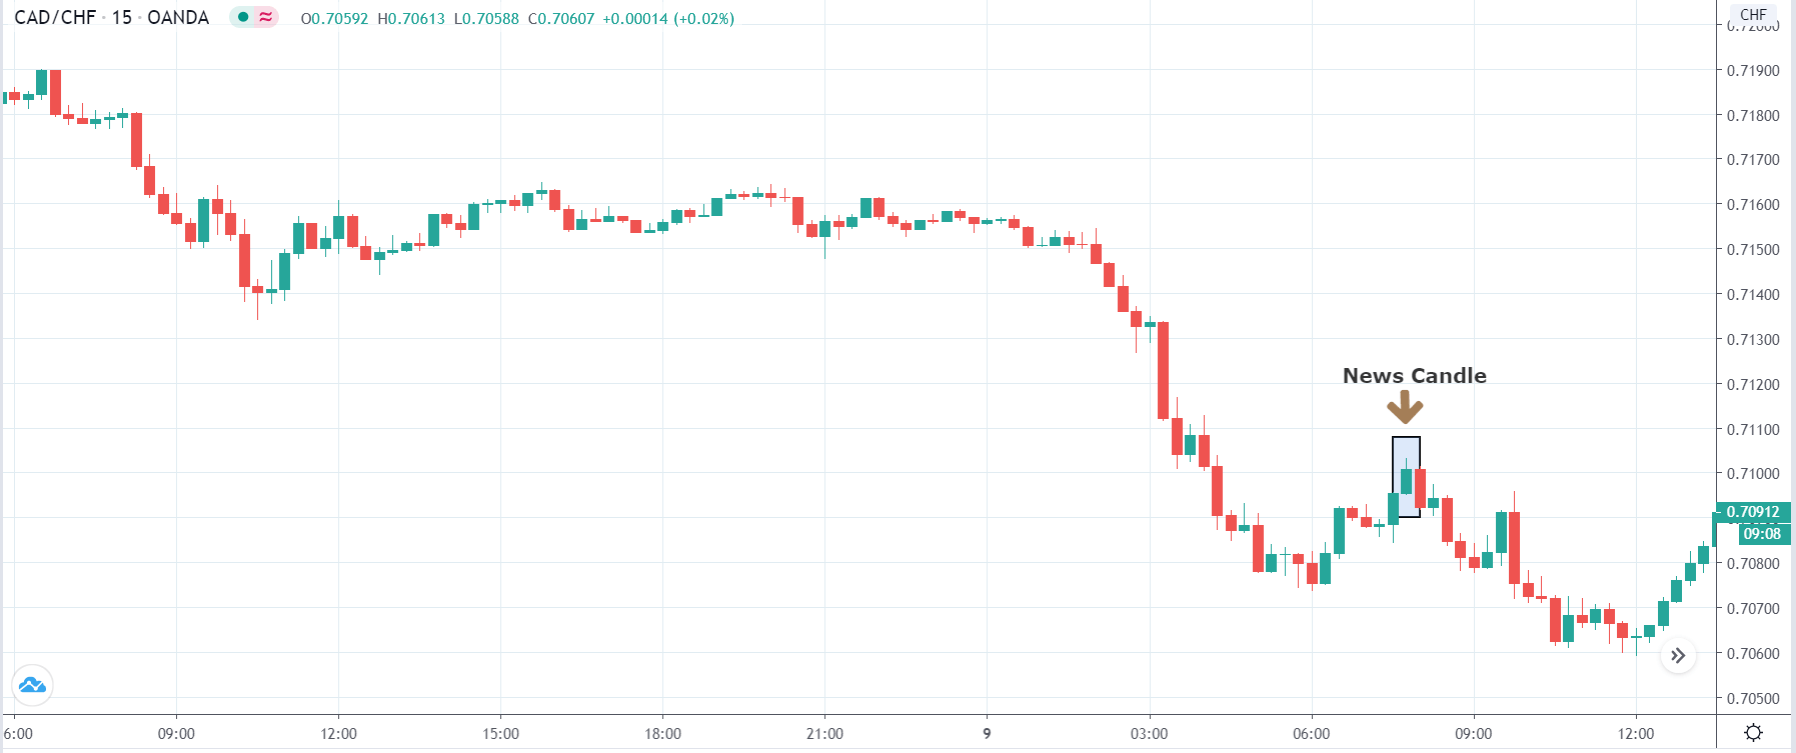
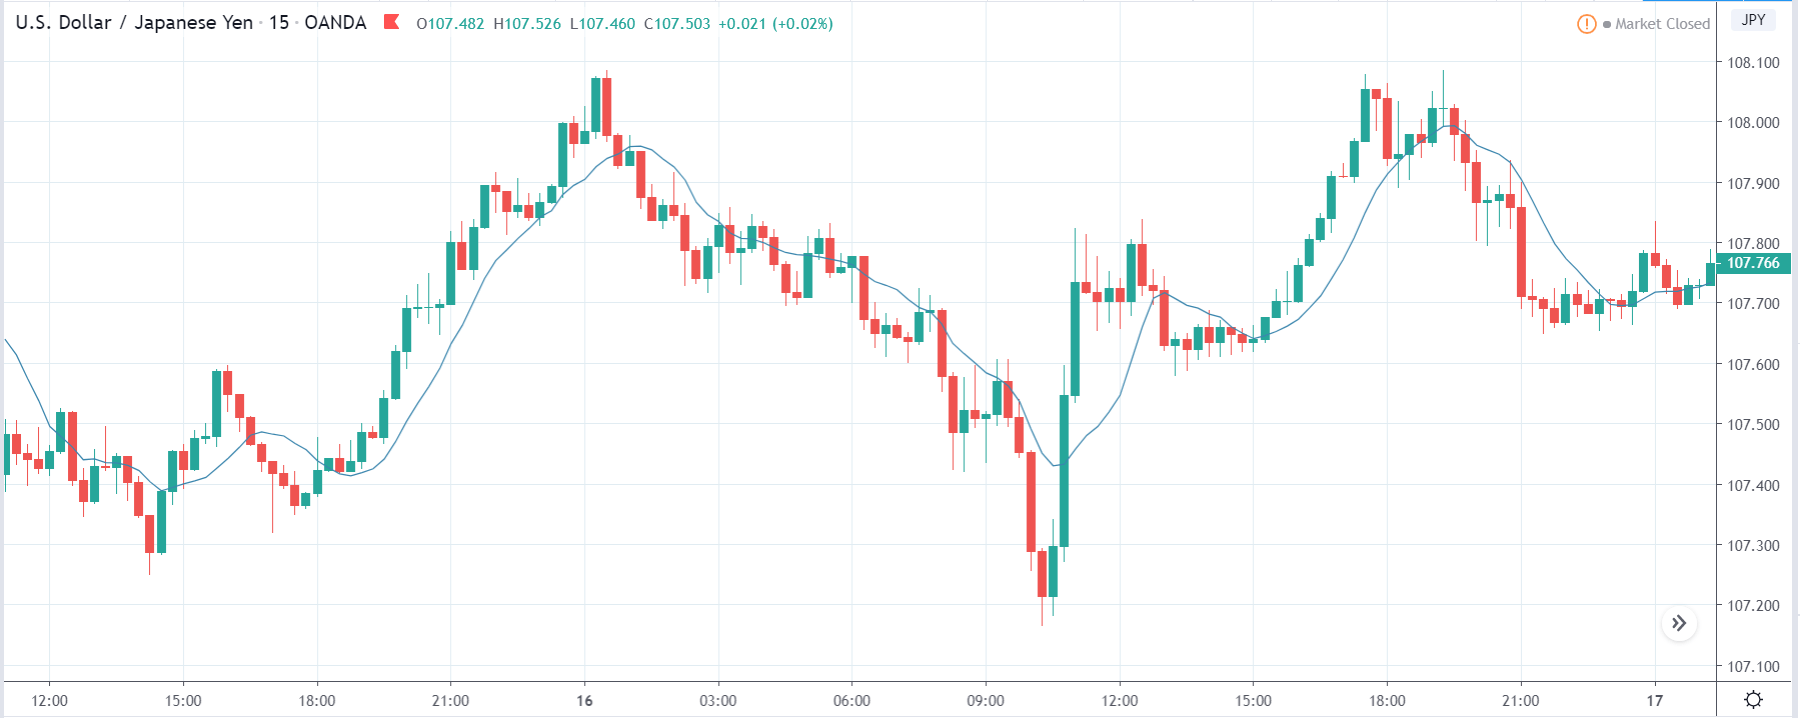
It is very popular to read or listen to some traders say they trade forex with news. What they look for with it when there is high volatility is to gain a lot in a very short time. Careful, the message sounds very nice but the reality is not so much. High risk is also something to calibrate well, in addition, to stop loss sweeps, landslides when entering the market. You must keep these issues in mind.
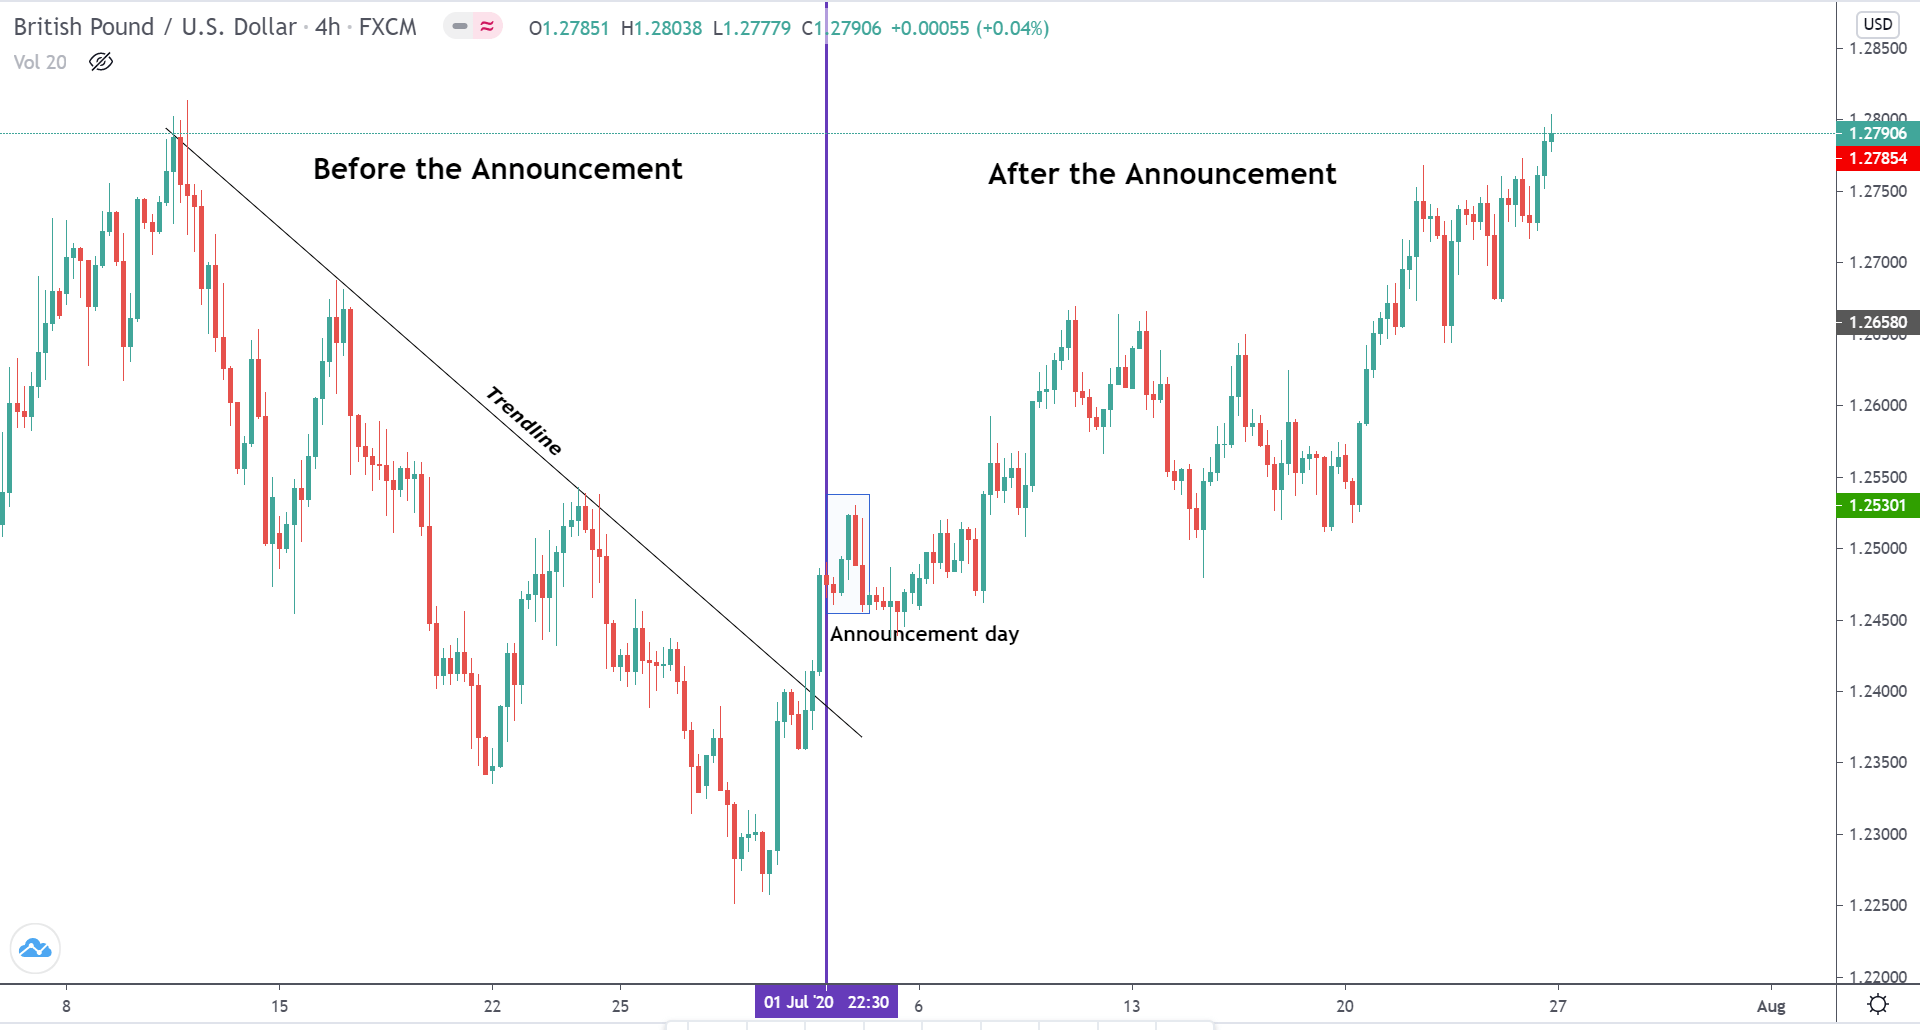
- Technical analysis, fundamental analysis, and the economic agenda.
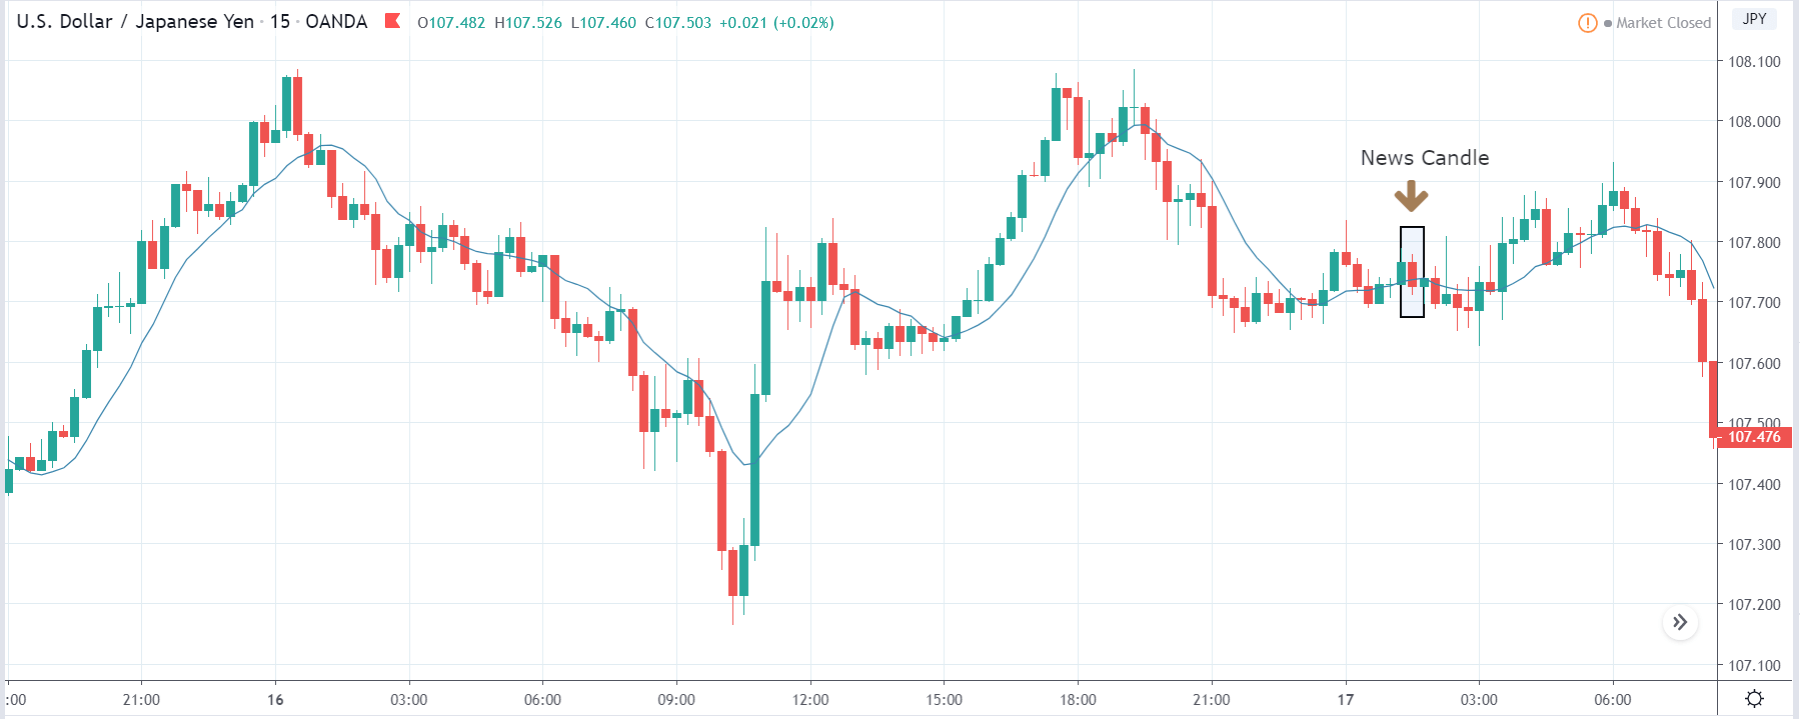
Whether you do technical analysis or fundamental analysis, the economic agenda really matters. You might think that since you do technical analysis, you don’t care about this whole macroeconomic news thing. You can really do that in part, but to follow the market keep them present or you can get some upset. If you’re in a pretty big position within the pound and there’s news about the UK Brexit referendum, this may annoy you, to put it mildly.
If you focus or are focused on fundamental analysis to make buying and selling decisions you will know the importance of following the macro calendar and will work with economic data as a source to make your decisions.
- Where to look for Forex news data
On this very page, up. In addition, there are other well-known ones such as Investing, FXstreet, and different portals where you can see these types of calendars, each with a different style. In the end, it’s a matter of taste, choose the one you like the most and where you feel comfortable. The source of the data is usually the same.
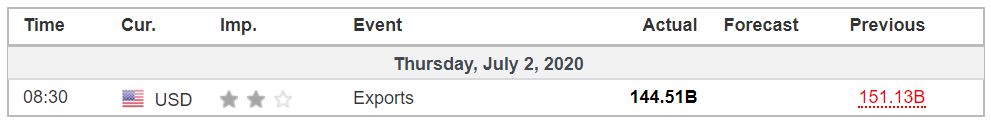
- Publication of macroeconomic data
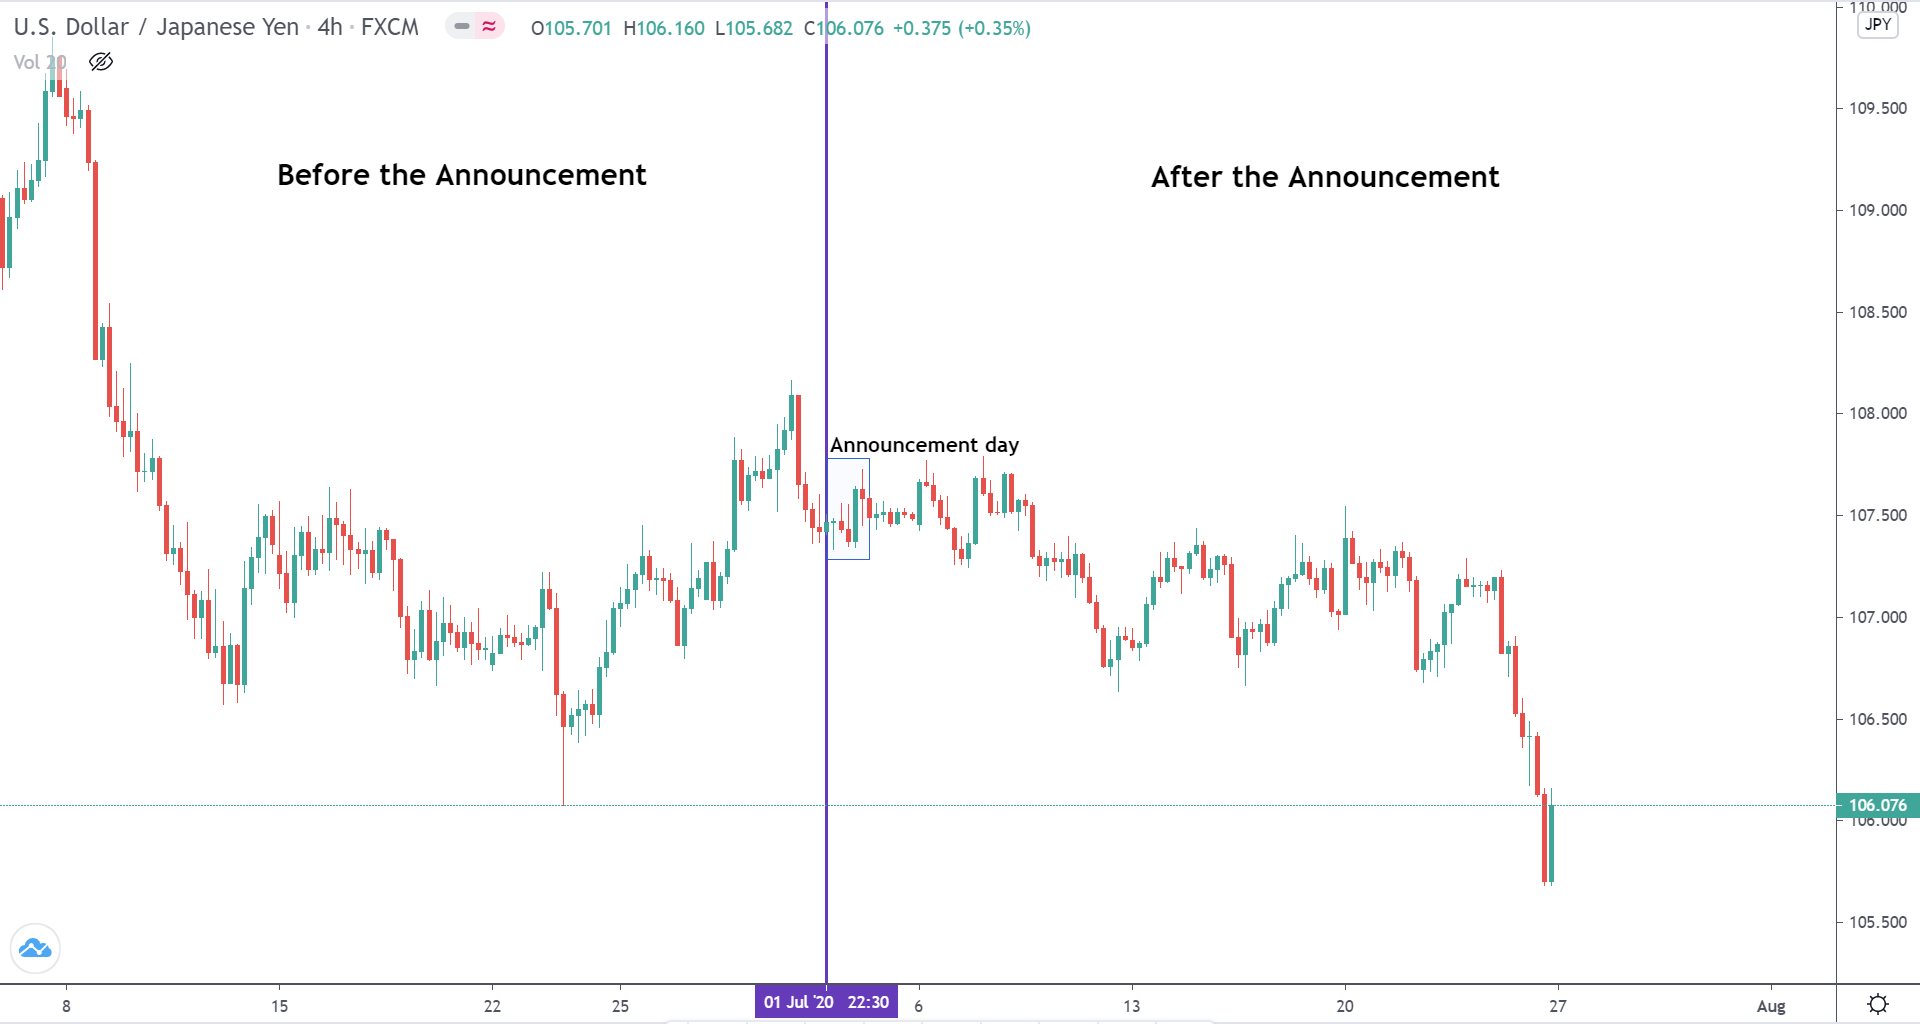
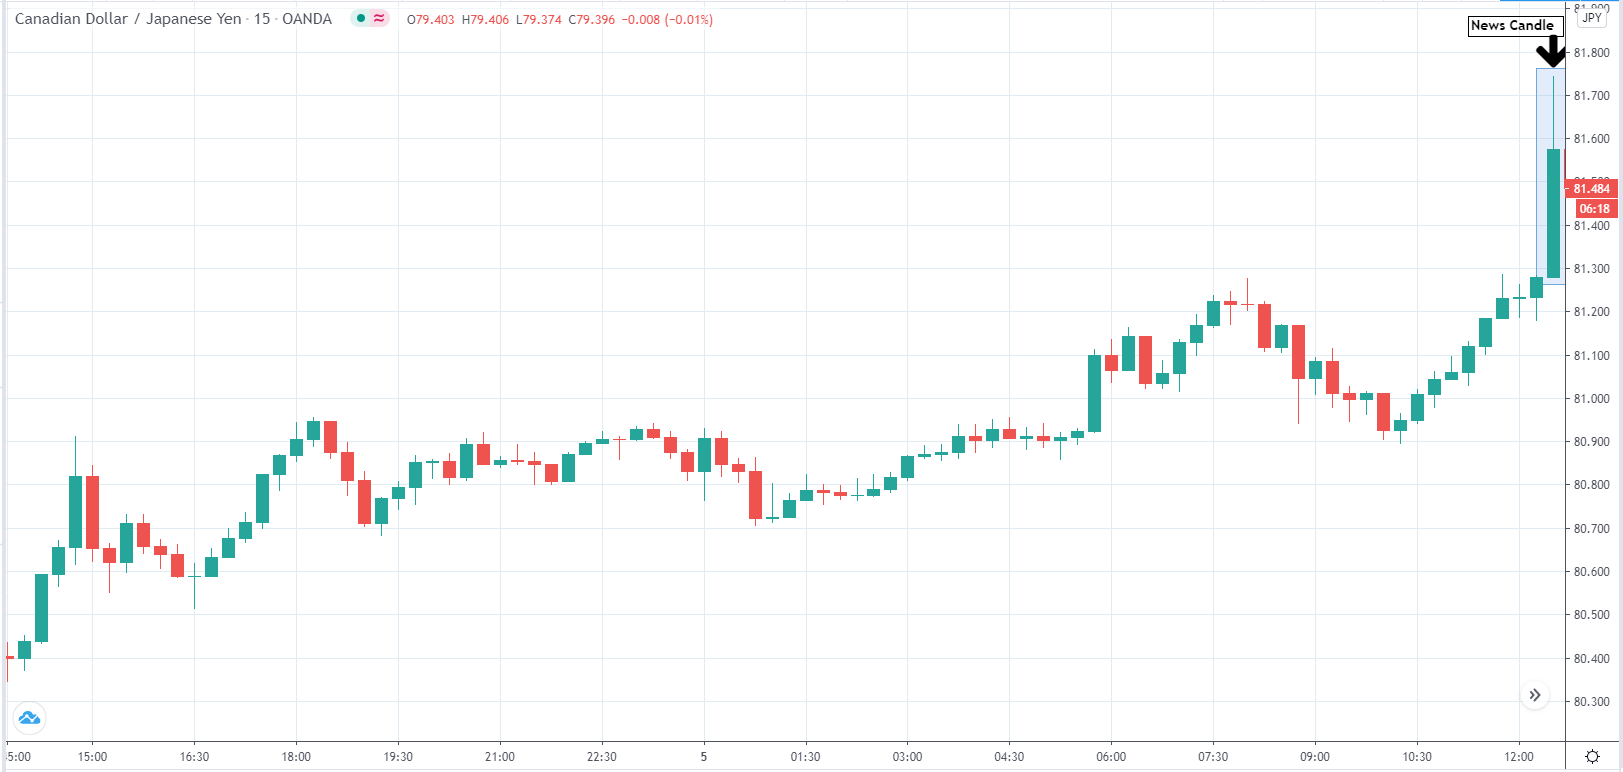
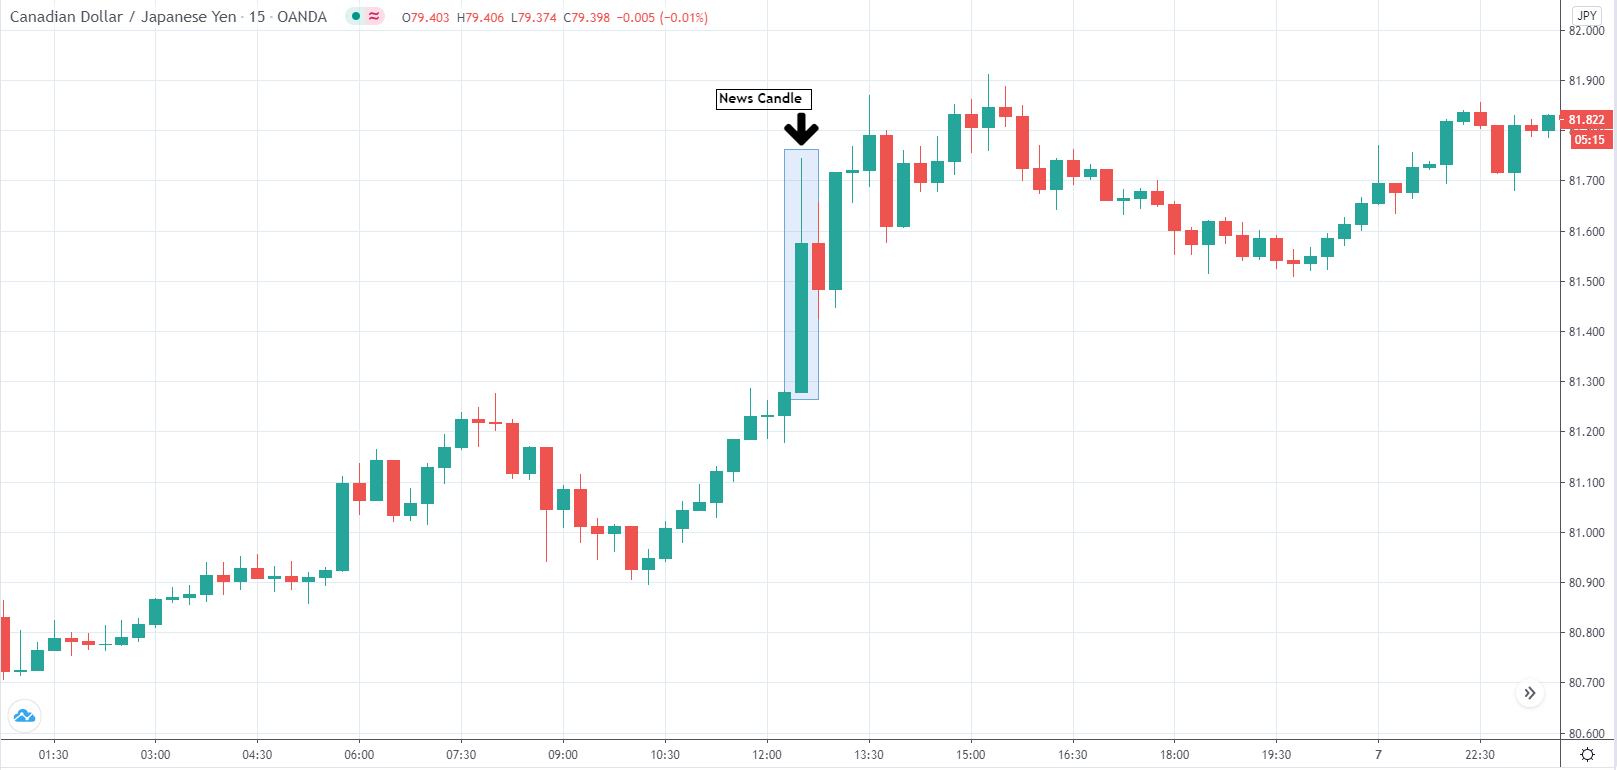
Some people are obsessed with when this data is published to buy or sell based on how good or bad this data has been. Error. Two points:
In free portals the publication of the data is done with some delay and to avoid this we should hire platforms like Bloomberg (it is a paste to keep them for the independent investor and do not make much sense). But even so, today the execution of orders mostly goes by algorithms. In the time it takes to observe the data, you open the broker and place an order, the algorithm may even have already closed the position. Focus your goal on other more profitable patterns.
Another thing, do you think that just because a piece of data is better than expected, it’s gonna benefit an asset that goes up or vice versa? The answer is no. Sometimes this is discounted on the price already or the data is good but worse than expected. If you are a retail trader, I recommend that you do not enter this war unless you are very clear about it.
- Global indices and commodities
You may wonder if this agenda is only for the Forex market or has any use in the case of trading in indices or commodities. Macro data from China without going any further are moving most of the world indices. Events in the United States cause major markets, including European indices, to be affected both positively and negatively.
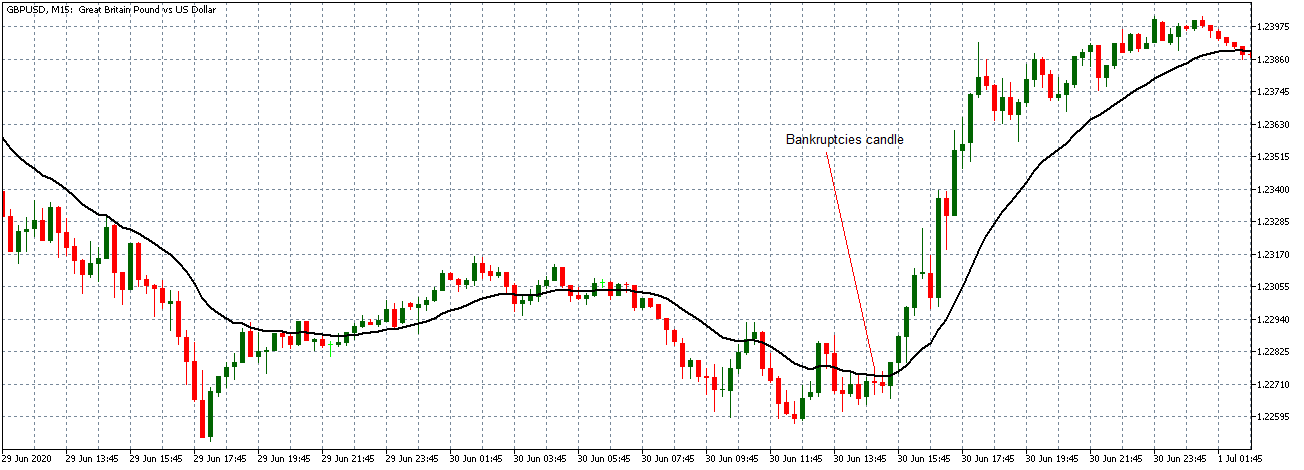
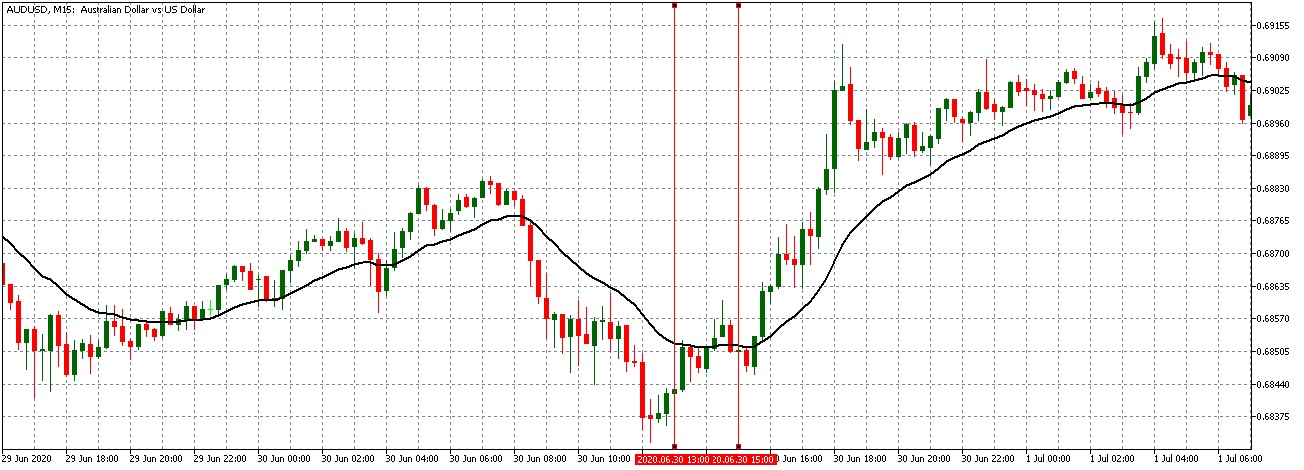
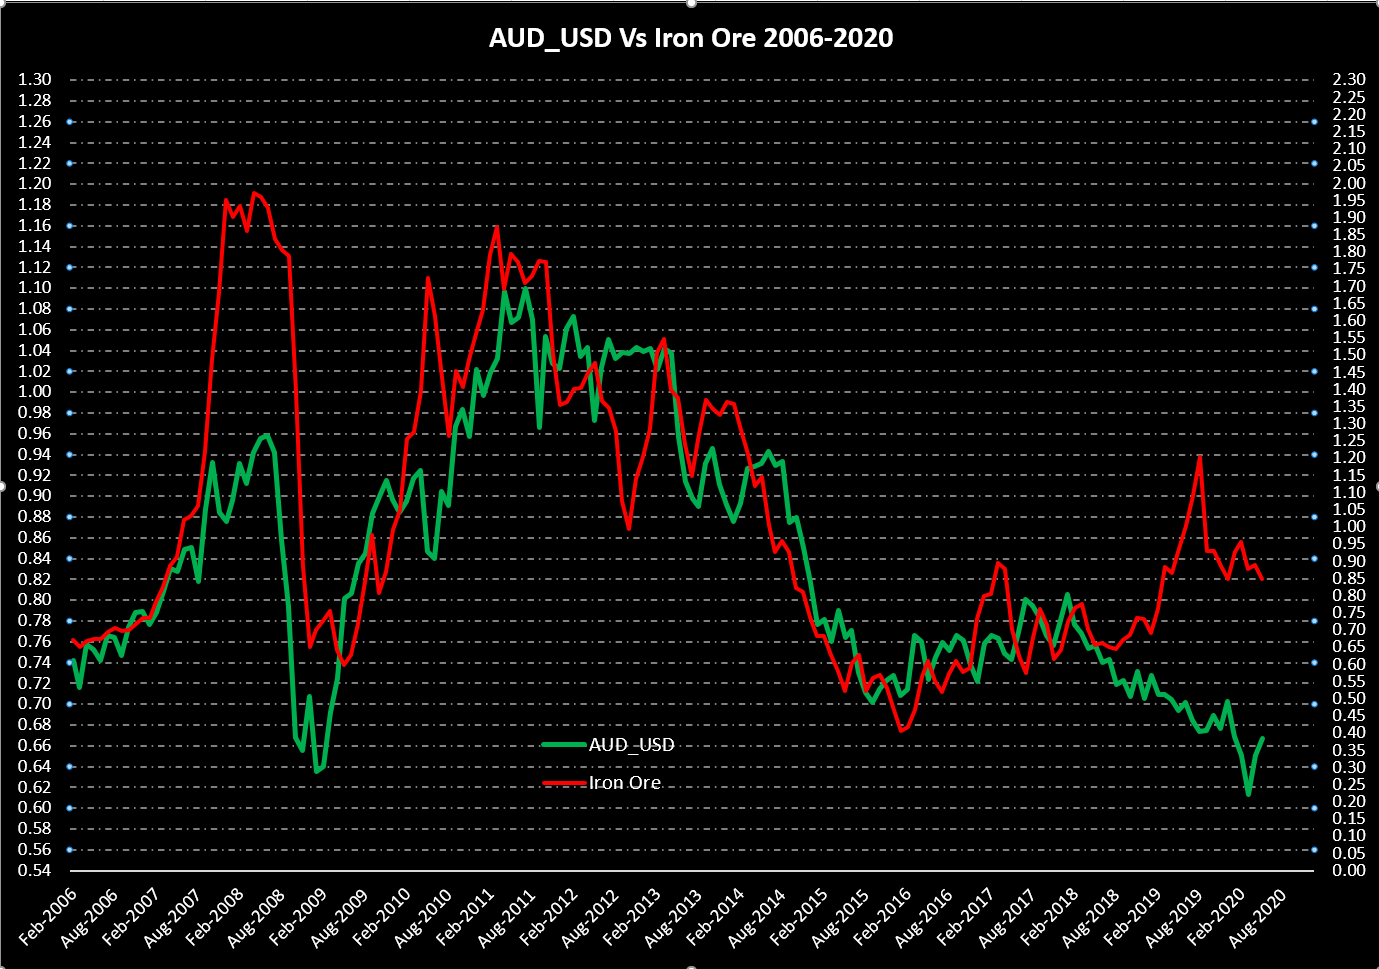
Another example is oil, which in turn has a direct relationship in some currency pairs due to the countries where it is traded and where there are large reserves. The publication of oil inventories is very important data that is taken into account by investors and traders. In the end, they affect the asset or country in question, either directly or indirectly, and it is important to have control of its publication so that you do not get caught out of play.
- How do I use the economic calendar?
I’ll tell you how I use the economic calendar and how you can use it yourself. If you do algorithmic trading as is my case, that is, you have automated in and out of market operations, you can carry out different actions:
-Create strategies that avoid operating at times where high-impact news is published for markets (for example, on Fridays at midday).
-Adjust systems to market volatility. We can calibrate the amount and distance to stop loss based on price variability. If it is high, it is advisable to leave more distant stops so that you do not jump at the first change with strong movements. Indicators like the ATR (Average True Range) for example can help you in this.
-Disconnect systems when there are Brexit events or important government decisions at any given time.
Beyond that you can design them yourself according to your preferences, here are some ideas. In a habitual way, apart from this type of facts, I use the economic agenda like this: the weekend where I usually look at what publications there will be in the next days and every morning when I wake up where I review only the data and the next hours (of that day).
Don’t worry if you can’t stay on the screen because you work or are busy. In addition to the Internet browser you normally use, there are mobile apps that allow you to view them. In fact, you can already do it from your smartwatch. It’s not that you’re obsessed with constantly refreshing the page or app to see what’s going on, just remember that it’s all about having control.