Categories
Forex Indicators

Everything About ‘Treasury Bill Auction’ Macro Economic Indicator

Introduction

One of the primary ways any government funds its budget is through debt – borrowing. When borrowing, a government can do this from the international markets or locally, from its citizens and businesses. When taking debt locally, a government uses treasury bills and bonds. As is with any form of debt, borrowing using treasury bills, the government is obligated to pay interest upon the maturity date.

The interest rate that the government offers for its treasury bills gives an invaluable insight into the confidence investors have in the economy. Therefore, to understand the borrowing patterns of the government, the interest rates it is obligated to pay, we need to understand treasury bill auctions.

Understanding Treasury Bill Auction

To better understand how the treasury bid auction works, we first need to understand a few terms.

Treasury bill is a short-term debt instrument used by governments to borrow money over a short period – usually less than one year. Because the central banks back the treasury bill, they are considered to be of lower risk and secure form of investment.

Treasury bill auction is a weekly public offering of treasury bills by the central government with maturities ranging from one month to one year. The auction is the official avenue through which central banks issue their treasury bills.

Maturity is the maximum time that a treasury bill holder can hold it before they are eligible for redemption. Treasury bills have maturities ranging from days up to one year. Note that the longer the maturity period of a treasury bill, the higher the interest rate will be.

Discount is the difference between the price at which the treasury bills are issued and the face value of the treasury bills. It is customary for the treasury bills to be issued at a discount and be redeemed at face value upon maturity.

During the auctions, participants are generally divided into two categories – competitive and non-competitive bidders. Before the auctioning process begins, the central banks make public the following information about the treasury bills: the date of the auction; the day of the treasury bill issue; eligibility of auction participants; the amount of the bills being auctioned; and the time when the bidding ends.

When the auction begins, the competitive bids are accepted first to determine the discount rate for the treasury bills. These competitive bills are submitted on a pro-rata share of every Treasury bill auction. It is worth noting that the winning bid determines the interest rate that will be paid out on each issue of a treasury bill. Furthermore, the demand for treasury bills is determined by the prevailing market and economic conditions and sentiment. It is this demand and the interest rate that will be of importance in our subsequent analyses.

Since the pricing of the treasury bills is done through a bidding process, the winning bid is usually one that has the lowest discount rate. Such bids are preferred to ensure that the interest rate the government pays investors is kept as low as possible.

After investors have purchased the treasury bills, they are then free to sell, trade them, or hold until maturity.

How can treasury bills auction be used for analysis?

Using the auction of the treasury bills in the analysis is relatively straightforward. The biggest draw of the treasury bills is because of the presumed zero risks of default since the government backs them. As we mentioned earlier, the primary determinant of the discount rate at the treasury bill auction is the demand. This demand is driven by factors such as macroeconomics, market risks, and monetary policies.

When other markets such as equity markets appear to be less risky or offer better returns, investors in the treasury bills will demand higher discounts. The higher discount translates to a higher interest rate attached to the treasury bills. Furthermore, when the rate of inflation is rising, investors will demand a higher discount rate for the treasury bills to offset the effects of inflation.

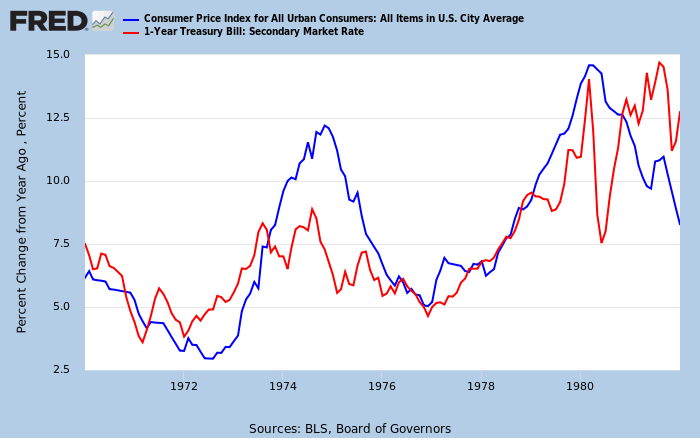
Source: St. Louis FRED

When there is rapid economic growth, investors have several options that could earn them higher returns. Therefore, they will demand a higher discount from the government, which results in a higher rate. Similarly, when the economy is heading towards a recession, investors deem treasury bills as safe-haven investments. The resulting excess demand for the treasury bills leads to lower discounts received by the investors.

Thus, the change in the yield attached to the treasury bills gives us significant insight into the state of the economy.

Impact on currency

We have seen that the rate of the treasury bills being auctioned is a reflection of the prevailing market conditions or anticipated economic performance.

When the rate received at auction is higher, it signals that the economy is performing well. Furthermore, higher rates for the treasury bills imply that there will be increased interest in investment opportunities in the country, which results in increased demand for the local currency. Higher rates could also translate to the increasing rate of inflation, which forestalls contractionary monetary and fiscal policies. For the forex market, this translates to a well-performing economy hence the appreciation of the currency relative to other currencies.

Conversely, when the rate of treasury bills at auction are falling, it implies that the economic fundamentals are performing poorly. There will be a net outflow of capital and investment. Furthermore, the forex market would anticipate expansionary monetary policies, which result in the depreciation of the currency relative to others.

Sources of Data

In the U.S., the treasury bills are auctioned by the U.S. Department of Treasury. You can access the latest data on the auction of treasury bills here. The data on the upcoming auction of the U.S. treasury bills can be accessed from TreasuryDirect, which allows you to buy and redeem securities directly from the U.S. Department of the Treasury in paperless electronic form. You can access the in-depth review of the current and historical data on the U.S. treasury bills from St. Louis FRED. You can access the global data on Treasury bills from Trading Economics.

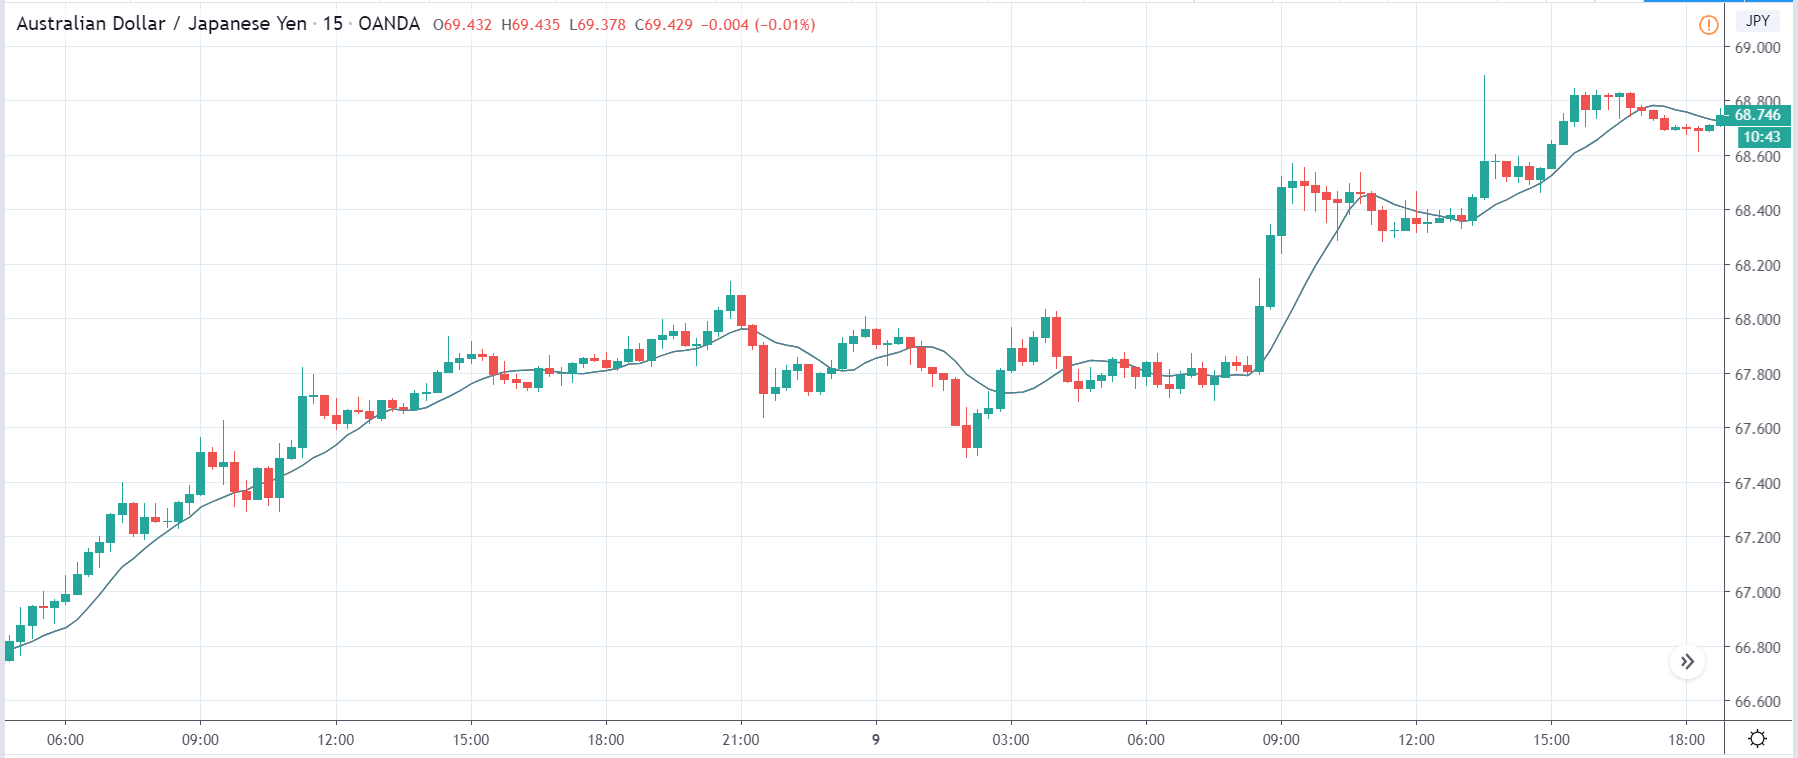
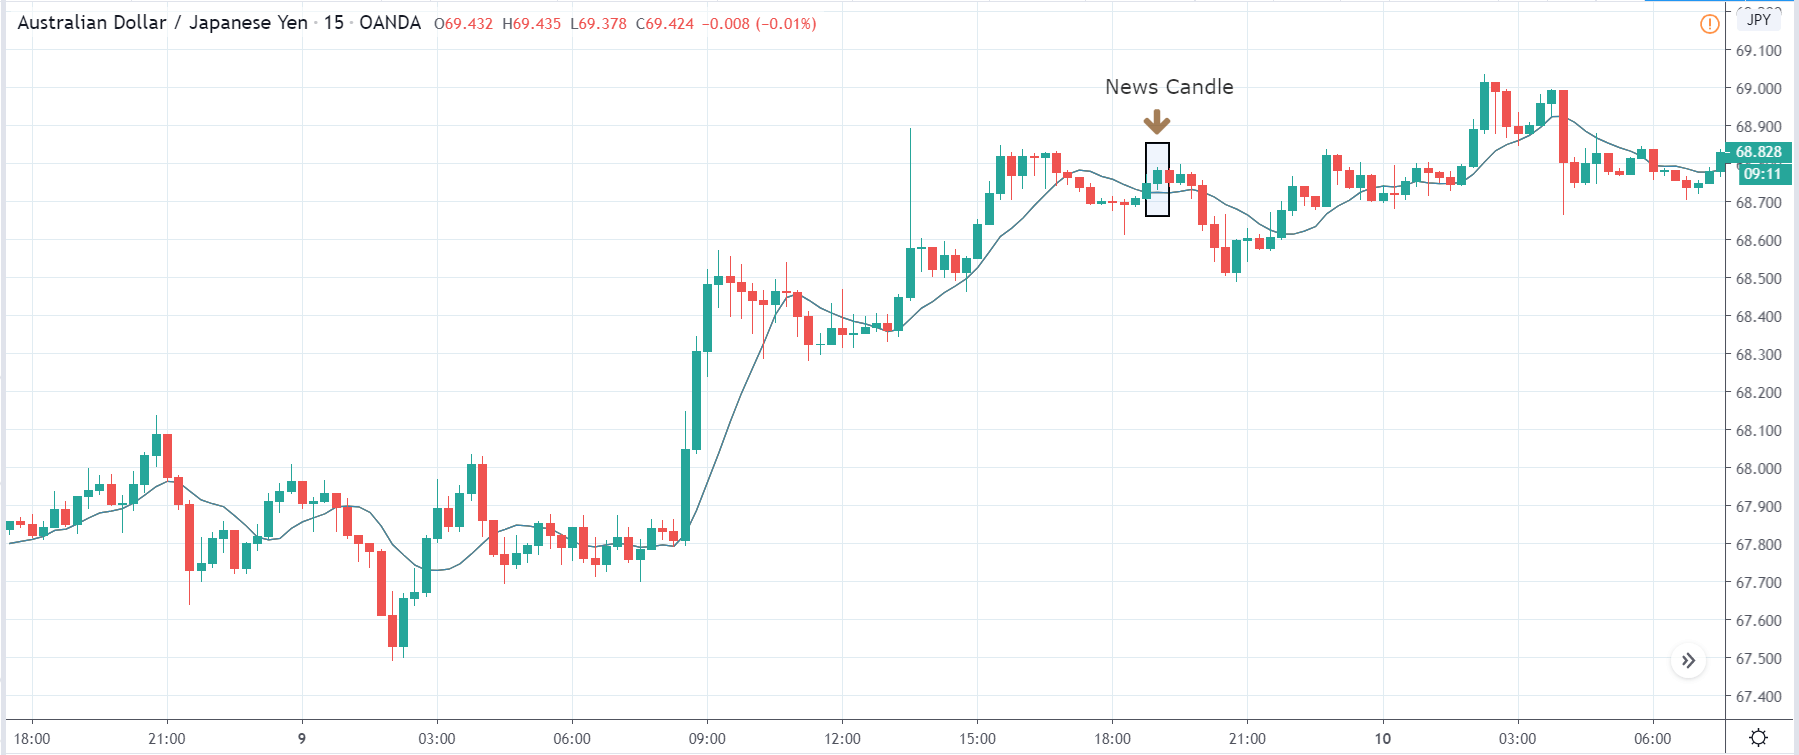
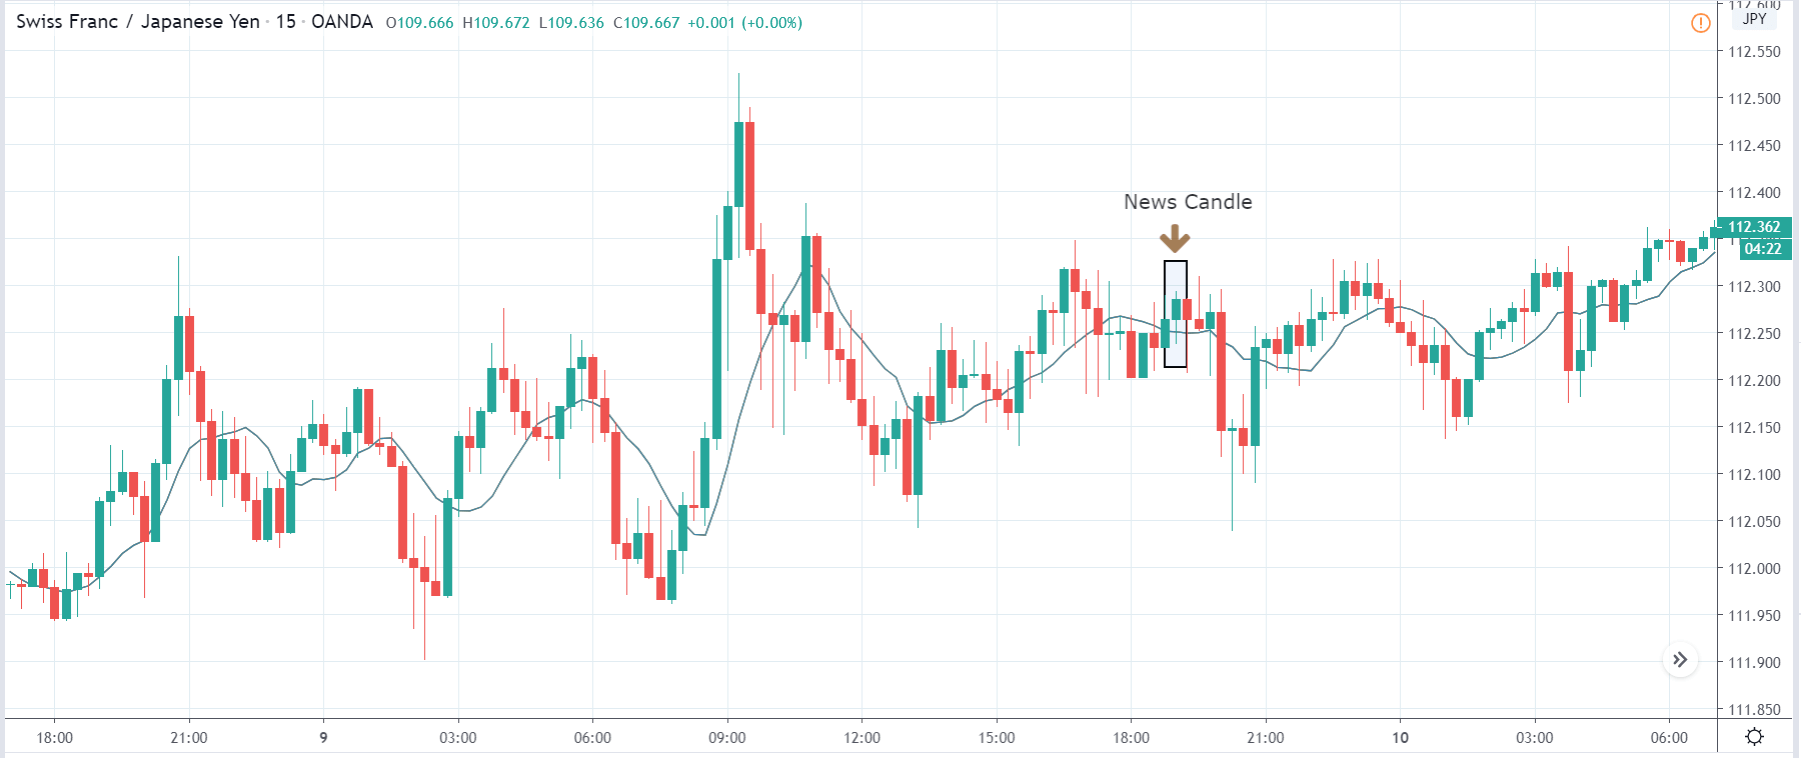
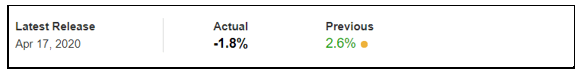
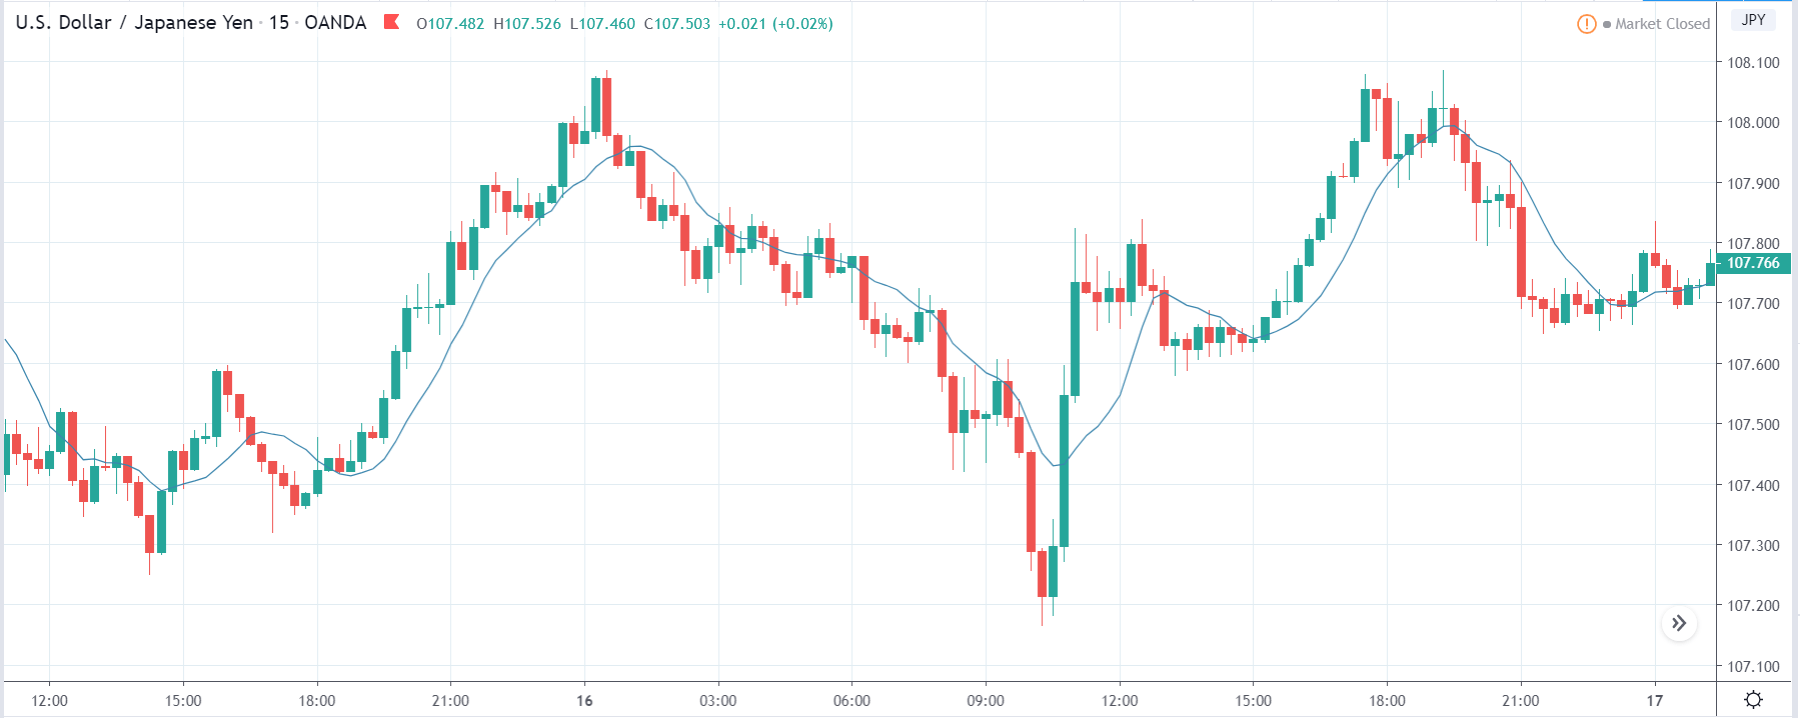
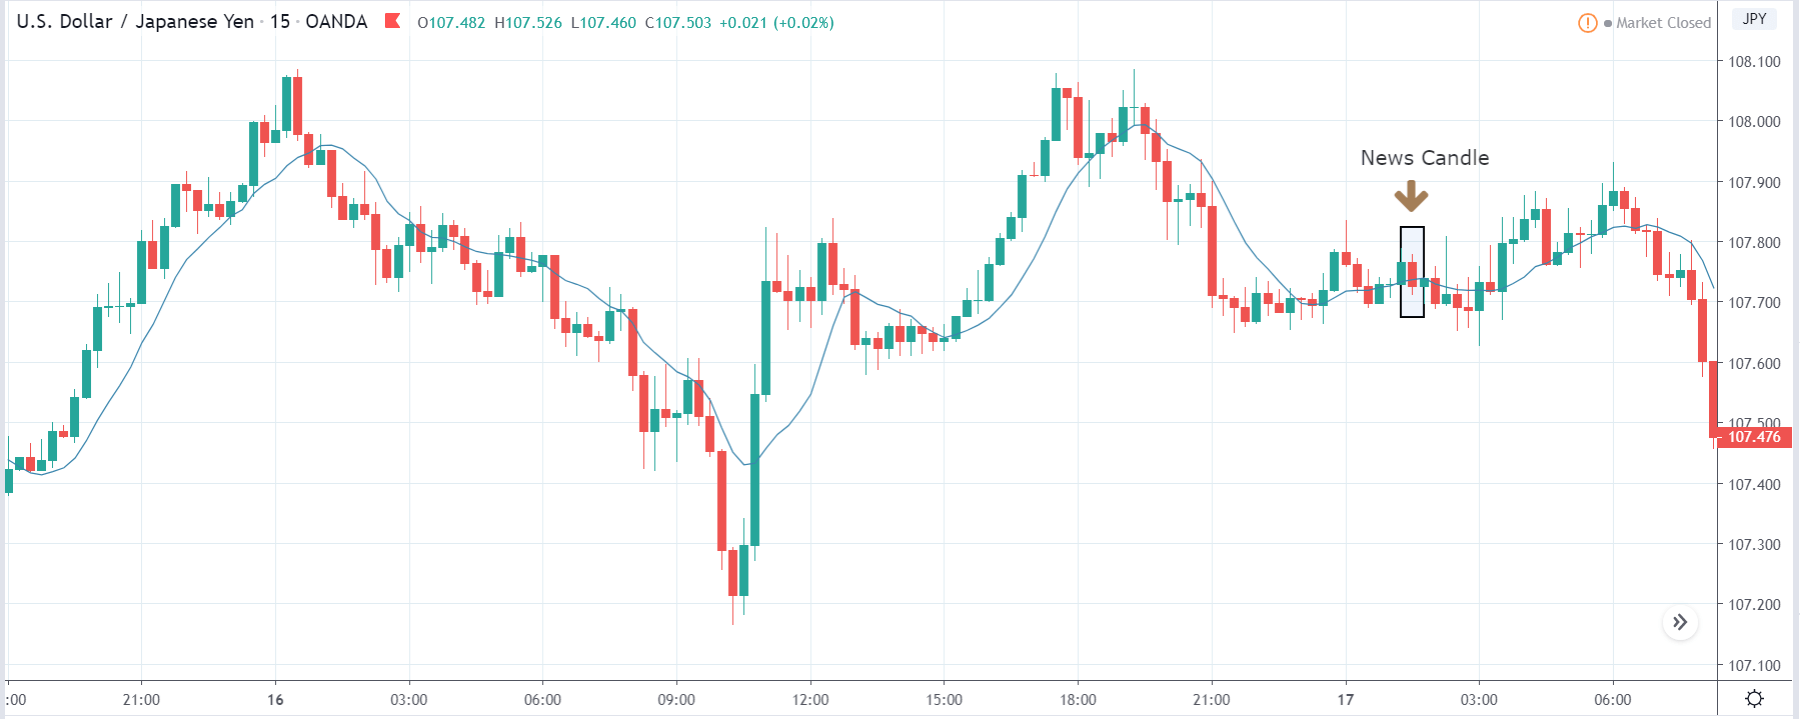
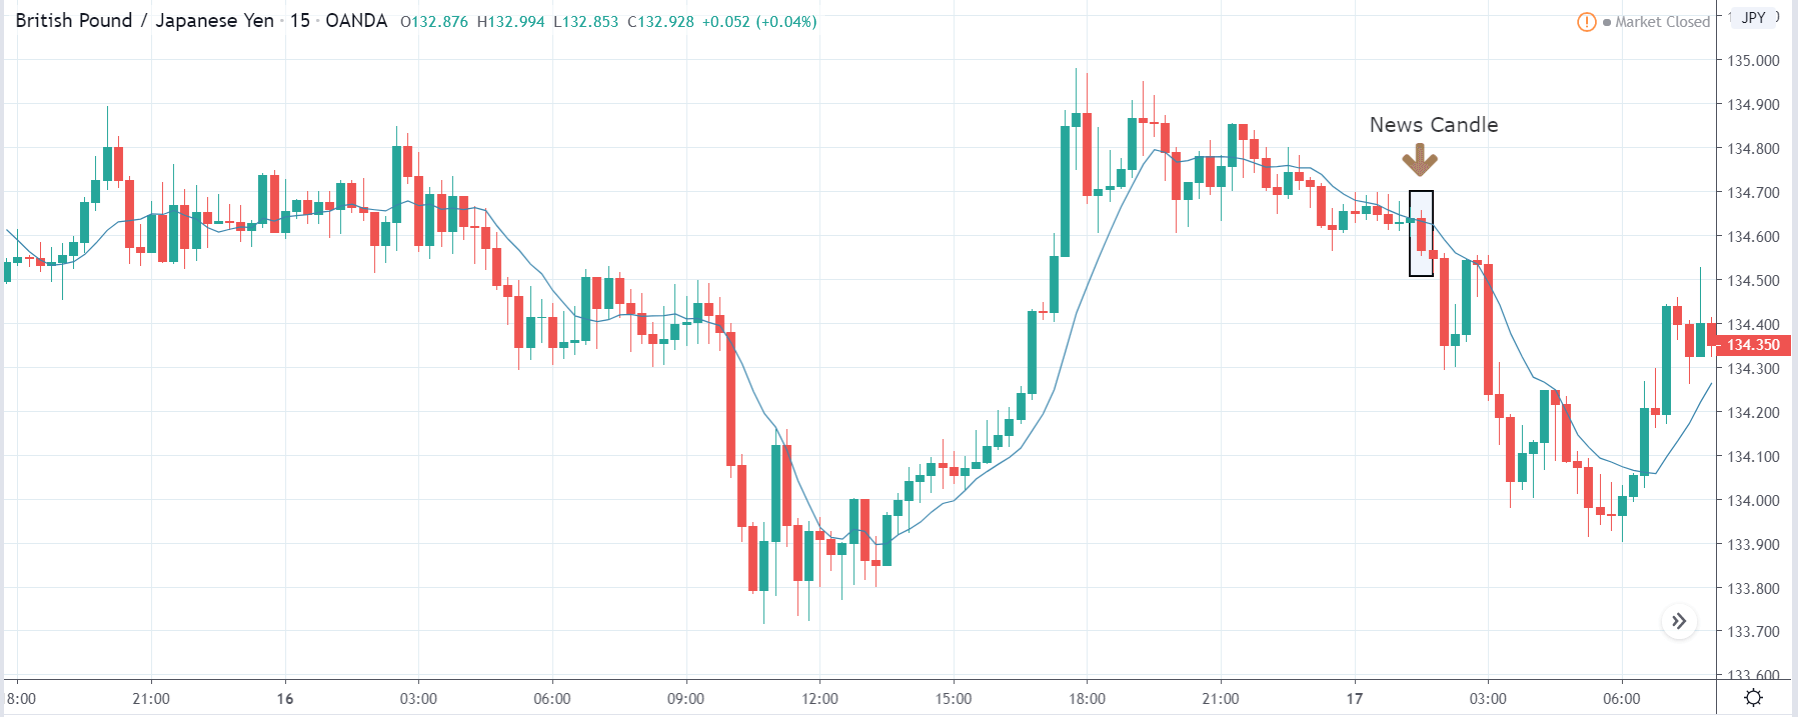
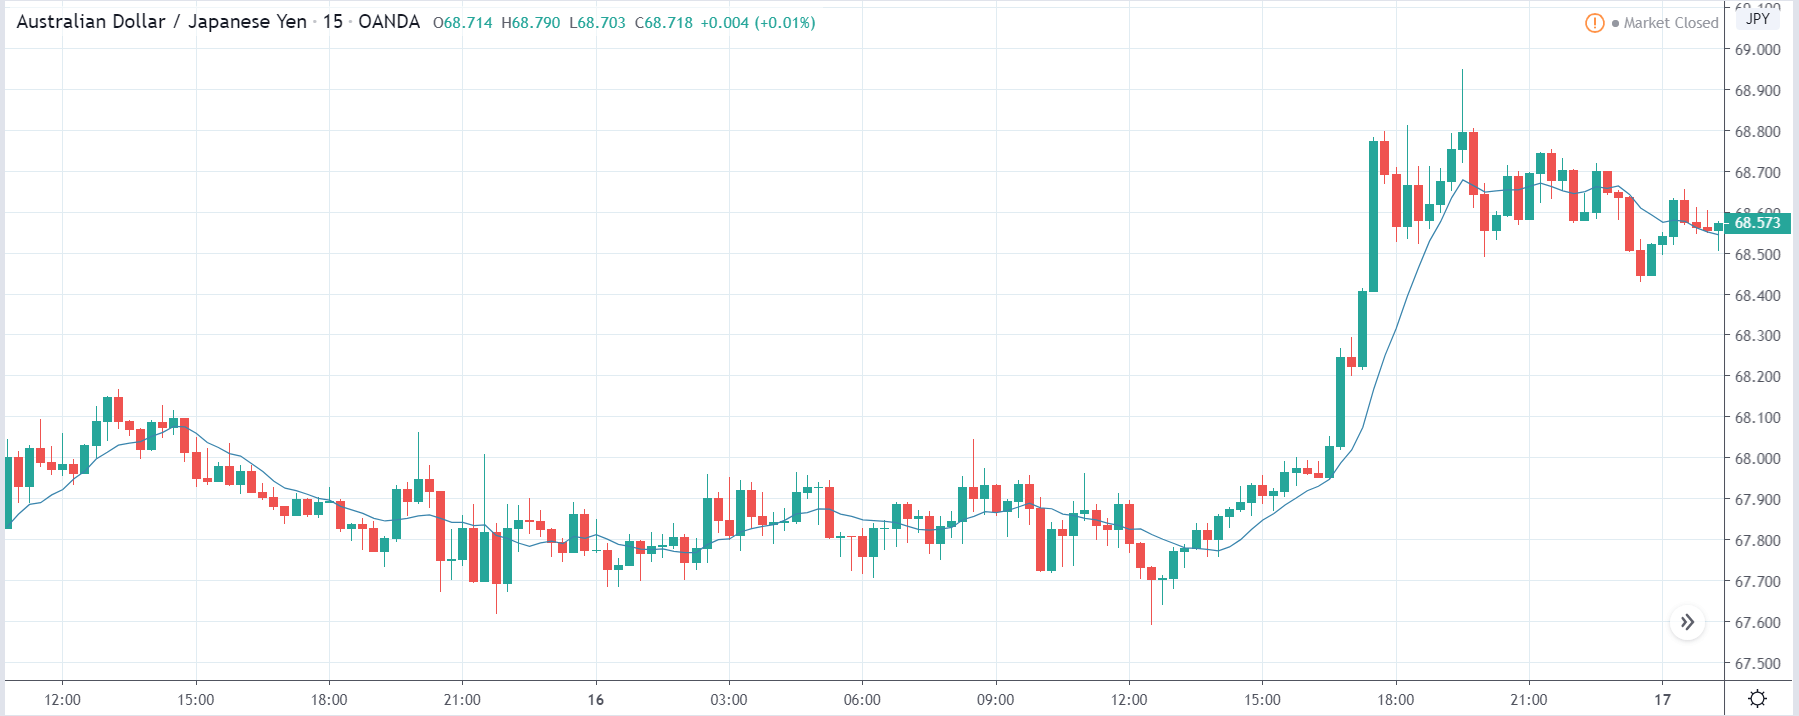
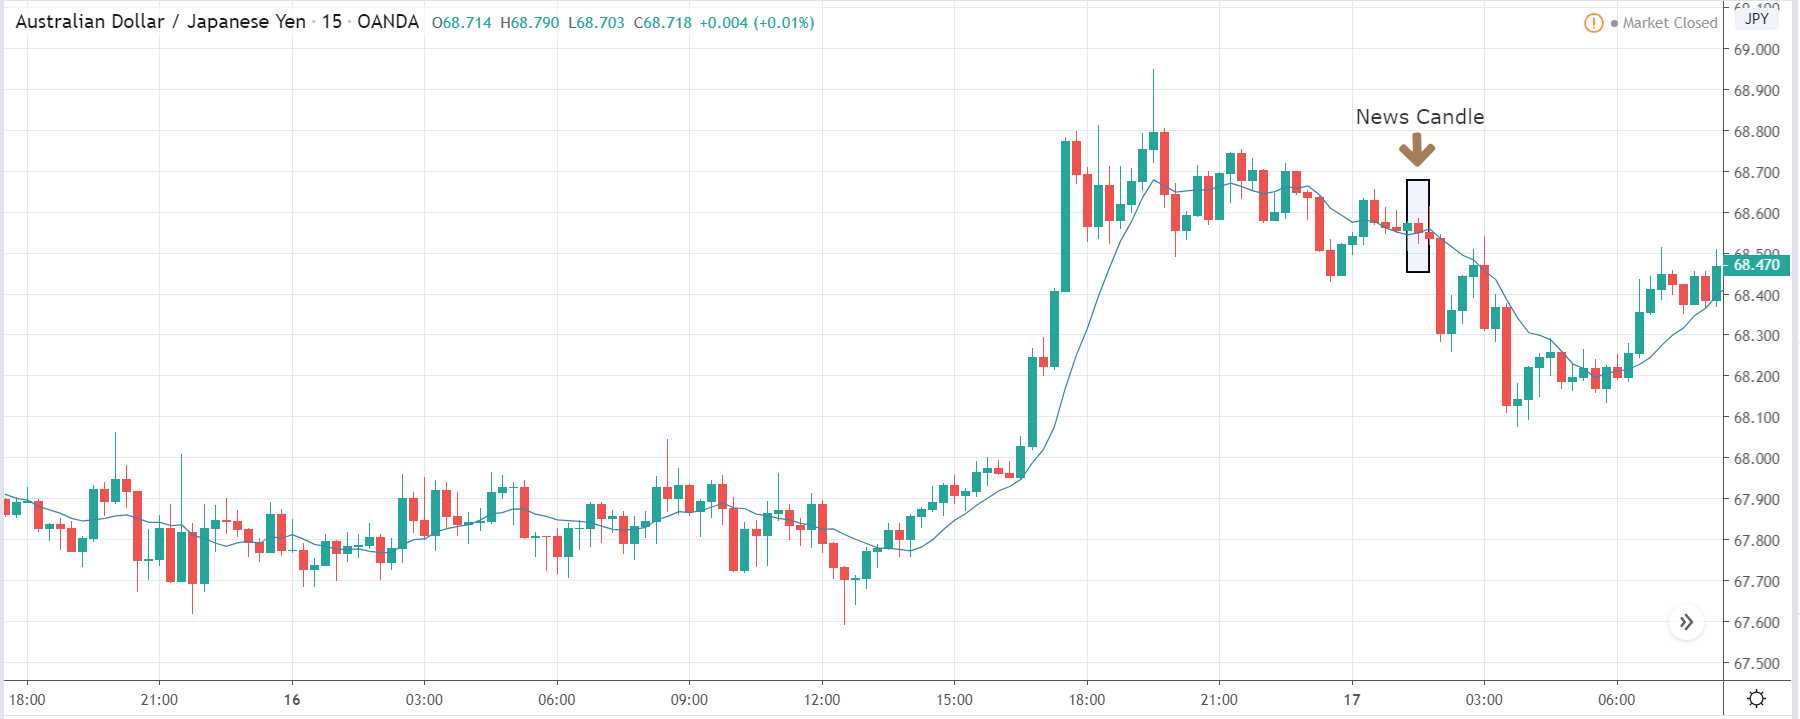
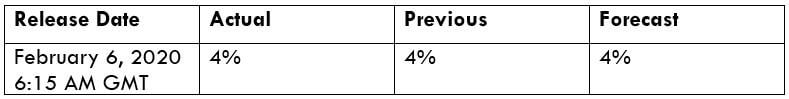
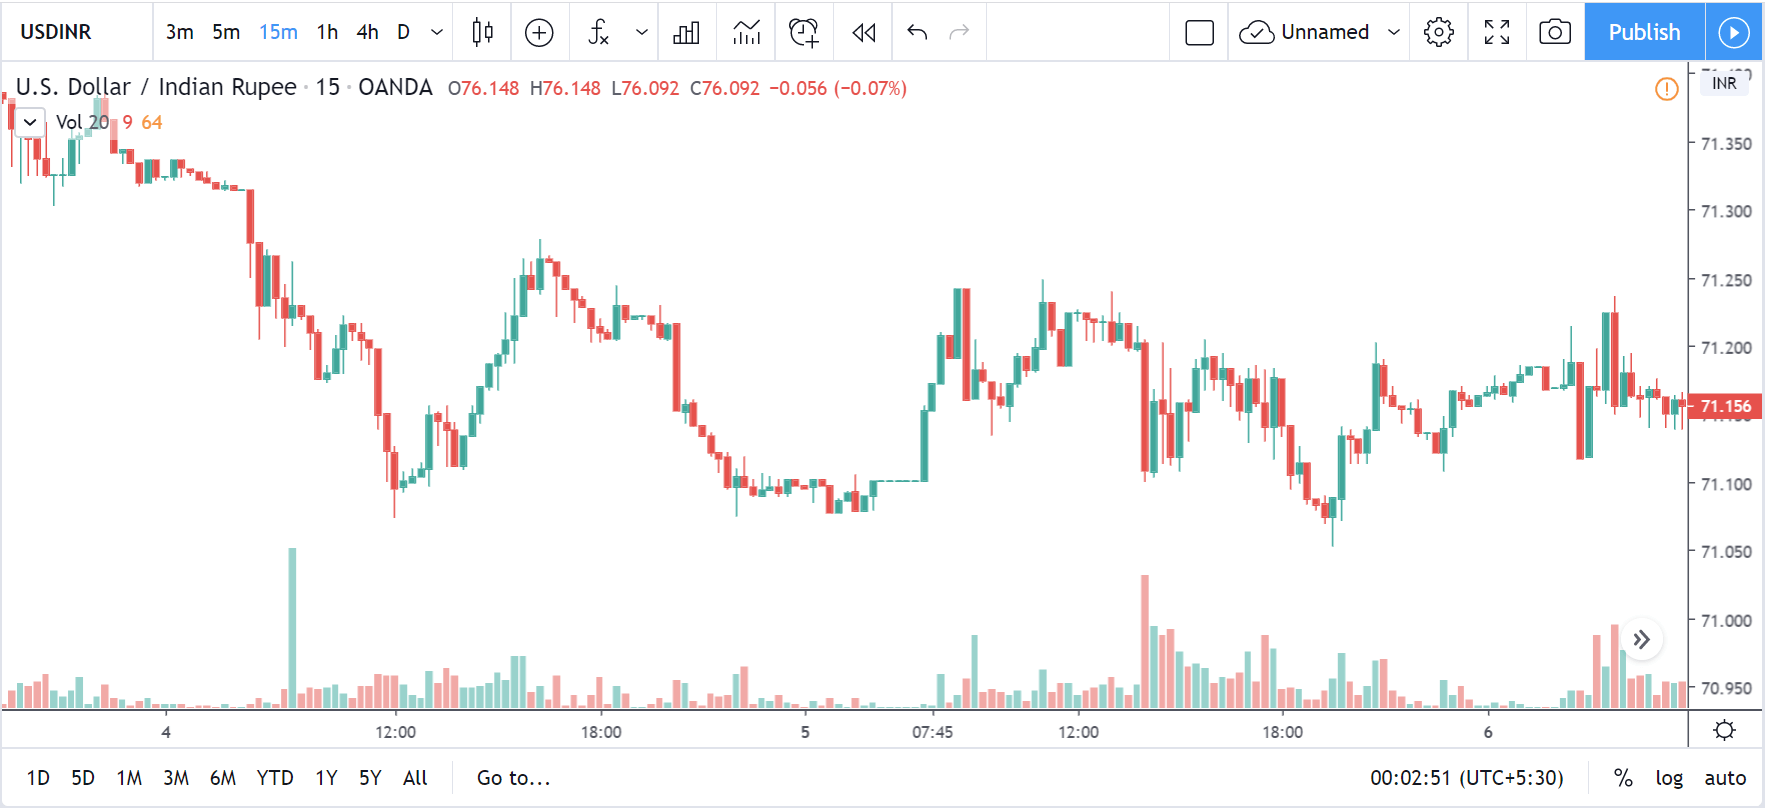
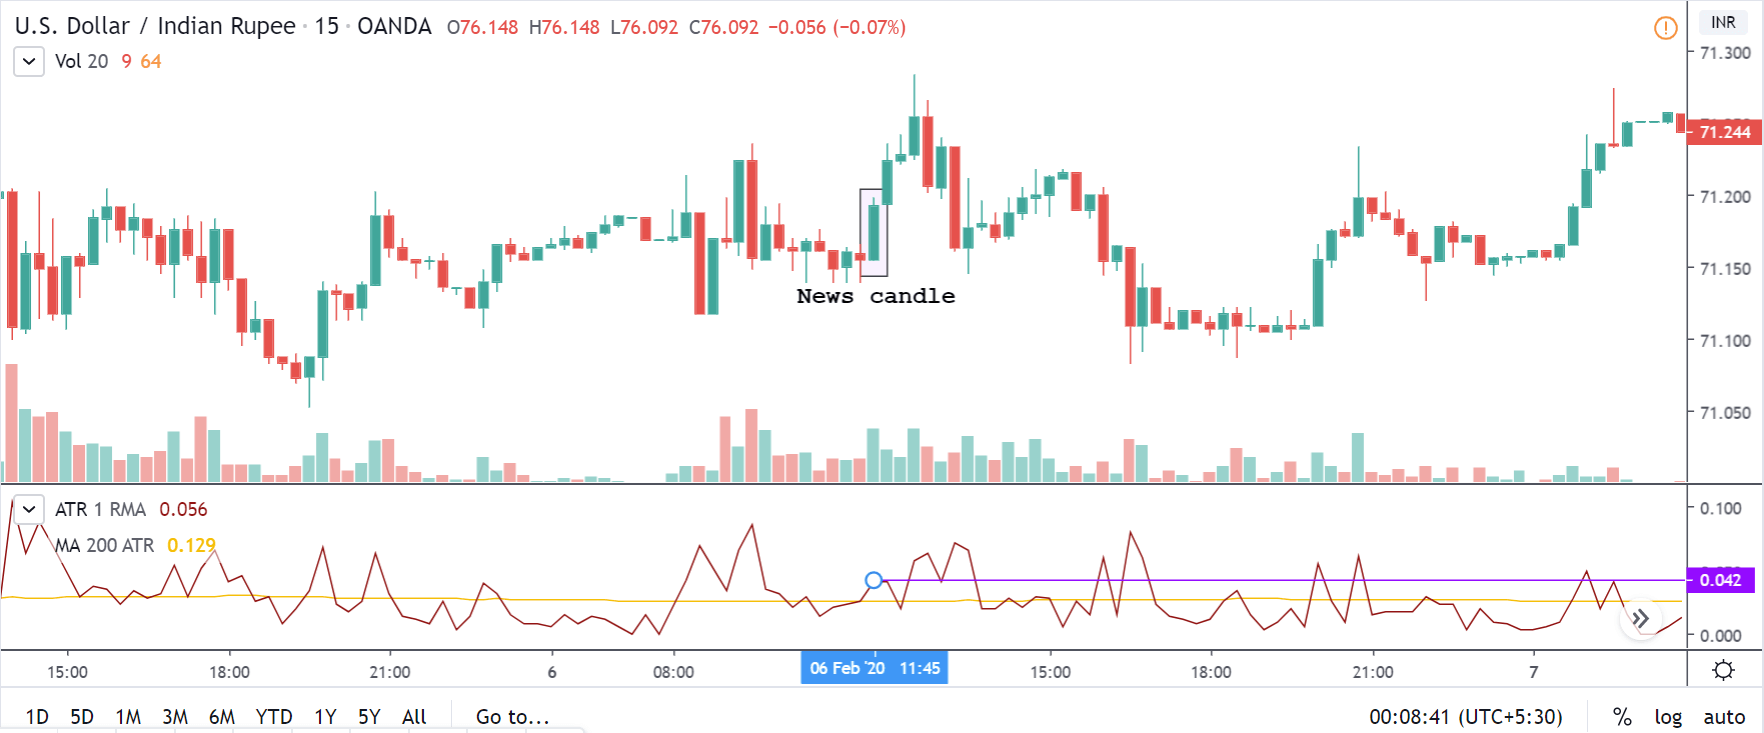
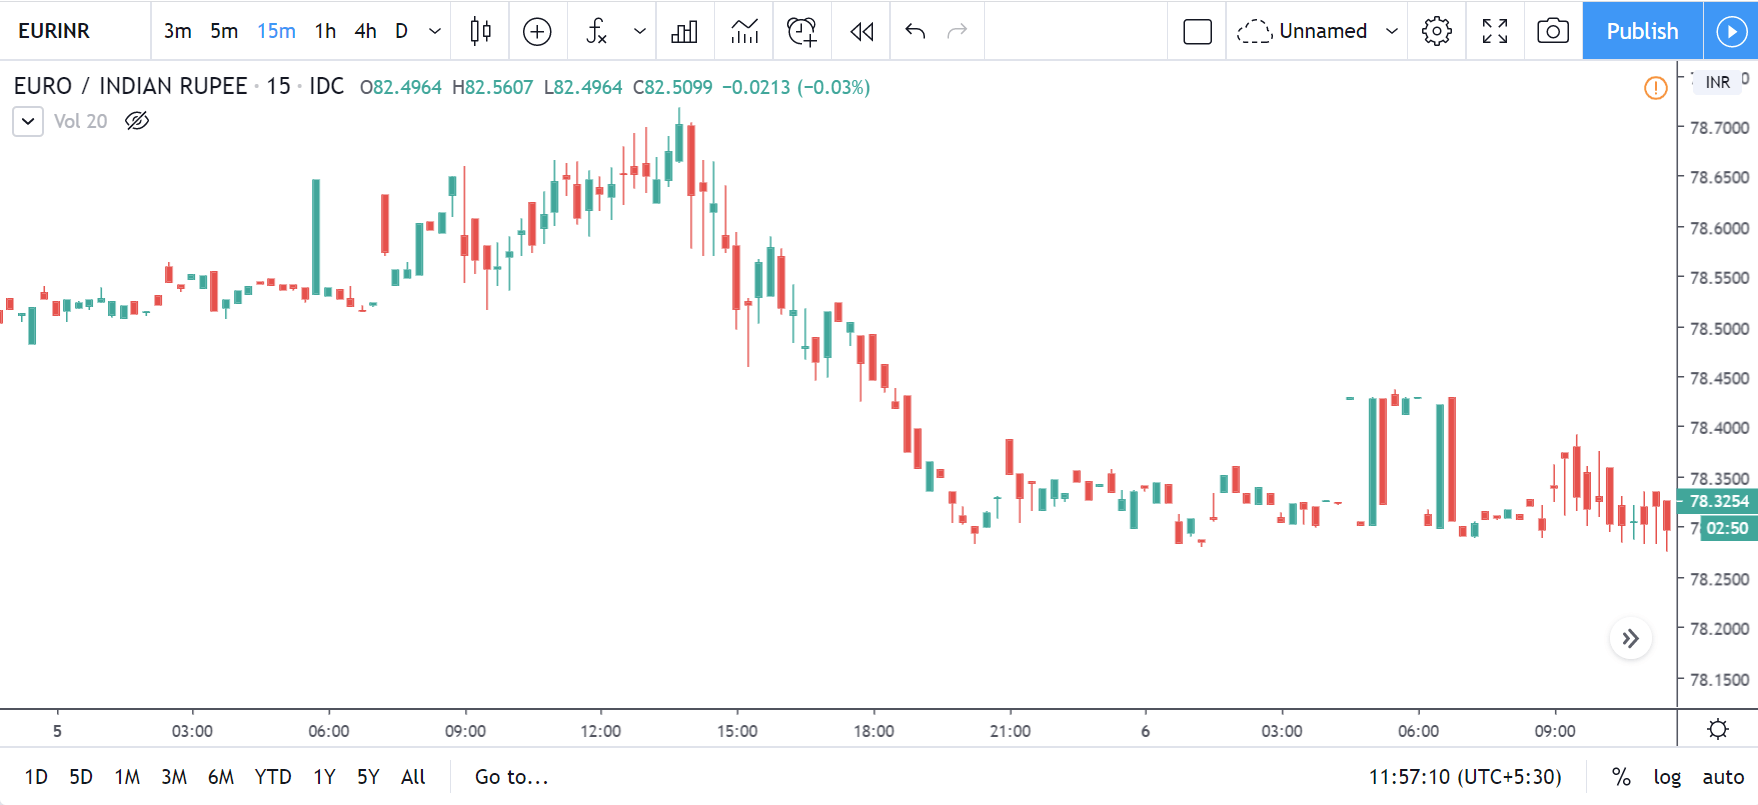
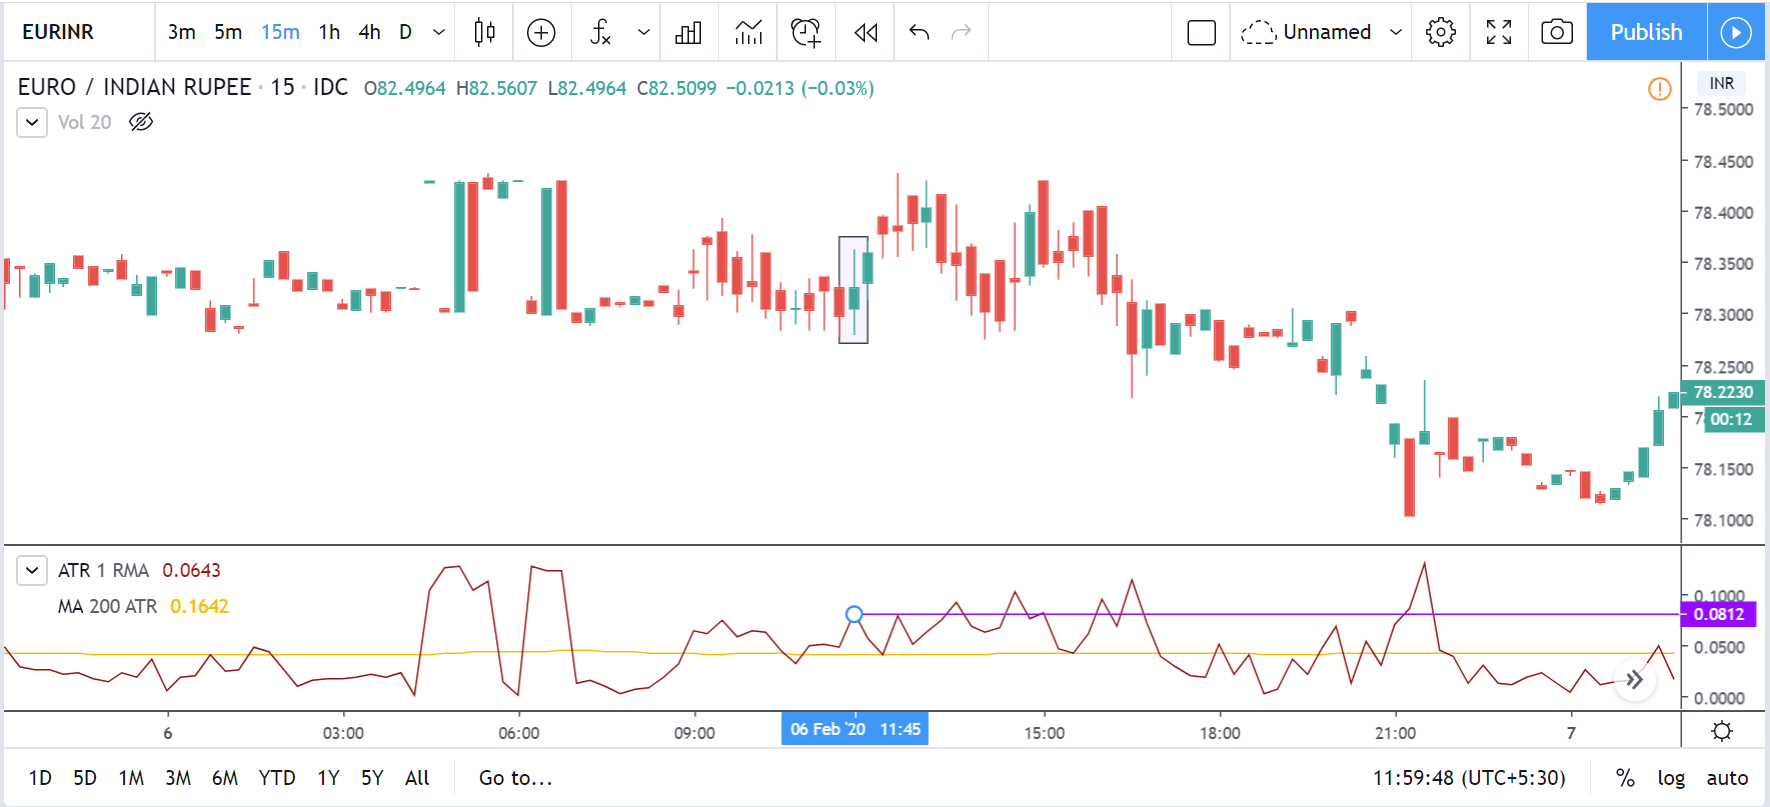
That’s about Treasury Bill Auction and the respective details related to this fundamental indicator. We did not see any reaction at all on the Forex price charts related to this indicator, but as explained above, we know the relative impact. We hope you have found this article informative. Cheers!

Categories
Forex Fundamental Analysis

Bank Lending Rate – How Important Is It To Know This Fundamental Driver?

Introduction

Bank Lending Rate serves as a useful metric to assess the liquidity of the banking sector and the overall economy. Bank Lending Rate helps us to understand the ‘cost of money’ or how expensive the money is in the economy.

The Lending environment within the economy determines whether the consumer and business sentiment is bearish (save more spend less) or bullish (spend more save less), which will have a multitude of impacts in various sectors. Investors, Traders, Economists use these rates to assess the current ease of flow of money within the economy and its corresponding consequences.

What is Bank Lending Rate?

Bank Lending Rate, also called the Prime Rate, is the interest rate at which the commercial banks are willing to lend money to their most creditworthy customers. The most creditworthy customers would usually be the corporate companies that have an outstanding past credit record.

At the top of the lending, chain sits the Central Bank, which determines the rate at which banks lend each other money in the interbank market. In the United States, the Central Bank is the Federal Reserve, and it influences the interbank rate, also called the Fed Funds Rate, by purchasing or selling government securities.

When the Federal Reserve purchases bonds, it results in the injection of money into the system, thereby increasing the liquidity of the bank market, and correspondingly the overall economy. When the Banks have more money to lend, the banks will lend this newly injected money at a lower rate, as a result of competition, and excess reserves.

On the other hand, when the Federal Reserve sells the bonds, it takes money out of the system, where banks become less liquid and thereby increasing their interest rates to get the best price for their remaining funds.

Hence, the Fed Funds rate serves as the base for the Prime Rate or Bank Lending Rate. This Prime Rate serves as the basis for all other subsequent forms of loans like a personal, business, student, or even Mortgage loans. The below diagram is illustrative of the above points.

The below diagram summarizes the hierarchy of the rates. The lower cell type of interest rate derives its value from its upper cell interest rate.

How can the Bank Lending Rate numbers be used for analysis?

The Prime Rates change based on the Fed Funds Rate, which is decided by the Central Bank based on economic factors.

The remaining forms of loans are derived from the Prime Rate and a percentage spread that is charged by banks for lending the money. The spread (or profit) varies from bank to bank and also on the customer’s credit score. Hence, there is no single Prime Rate as the best customers of the banks vary, and hence, usually, the quoted Prime Rate is the rate published daily in the Wall Stree Journal.

The Prime Rate is seen as a benchmark for commercial loans. In most cases, that would be the lowest rate available to the general public and business corporations, and it is not a mandatory minimum. In the end, banks can tweak their rules in their favor. A decrease in Fed Funds rate does not necessarily guarantee that a subsequent drop in the Prime Rates, but due to competition amongst banks, the general trend is that the Prime Rate follows the Fed Funds Rate.

We must understand that a Bank’s primary motive is to make money out of money. They make their profit on the difference between the Lending Rate and the Deposit Rate, also called the Net Interest Margin. A variety of factors come into play before a loan is sanctioned. The risk associated with the borrower (credit score, income source, assets, and existing liabilities), fluctuating market and economy, general consumer and business sentiment, etc. all add to the decision-making process of setting the Prime Rate, or other loan forms derived from it.

The ease at which loans are available to the public determines the type of monetary policy. In a loose lending environment, the Bank Lending Rates are typically low, which encourages consumers to borrow more and spend more into the economy. On the contrary, when the Rates are high, it discourages consumers from borrowing and encourages saving more.

The Central Bank regulates money flow through its interbank operations to manage inflation and deflation. In developed economies, a loose lending environment promotes growth & avoids possible deflationary threats. The tight lending environment is a strategy to slow down or cool down an overinflating economy.

The affordability of loans determines how much money is in people’s hands to spend. Low Prime Rates ensure high spending environments that are good for businesses and promote growth and higher GDP prints and vice-versa.

The effectiveness of the Prime Rate changes is not immediate, as the changes in the Fed Funds Rates, Prime Rates take time to come into effect. There is generally a 4-12 months time lag before the intended changes start to play out, and yet there is no guarantee that these levers will work.

Impact on Currency

Higher Bank Lending Rates is deflationary for the economy, and currency appreciates. On the other hand, Low Bank Lending Rates are inflationary for the economy, and the currency depreciates in the short-run.

Although, the low rates are typically set to boost the economy, which will cancel out the depreciation effect on a longer time frame, the immediate effect is as stated above.

Economic Reports

For the United States, the Federal Reserve publishes daily Selected Interest Rates, which includes the Prime Rate figures also. Weekly average and monthly Prime Rate figures are also available. In general, weekly and monthly data are monitored by the market.

The data is posted from Monday to Friday at 4:15 PM every day for the Daily Selected Interest Rates.

Sources of Bank Lending Rate

Selected Interest Rates – Daily – Federal Reserve

Selected Interest Rates – Weekly Monthly – Federal Reserve

The St. Louis FRED also keeps track of Prime Rates, and it is available here

Bank Lending Rates for various countries are summarized together and available here

Impact of the ‘Bank Lending Rate’ news release on the price charts 

In the previous section of the article, we learned about the ‘Banks Lending Rate’ fundamental indicator, which talks about the change in the total value of outstanding bank loans issued to customers and businesses. A country that lends more to people and companies is said to encourage economic growth by giving more money in the hands of people. This directly stimulates consumer spending and promotes the overall development of the country. This is one of the key parameters, if not very important, which investors look at before taking a position in the currency.

In the following section of the article, we shall look at the impact of the Bank Lending Rate announcement on various currency pairs and examine the change in volatility due to the announcement. The below image shows the previous and latest data of Japan, where the rate was reduced from the previous month. Let us analyze the impact of the same on some major Japanese Yen pairs.

EUR/JPY | Before The Announcement

We shall start with the EUR/JPY currency pair for discovering the impact of the Bank Lending Rate on the currency. The above image shows the characteristics of the chart before the announcement was made, and we see that after a high volatile move, the price has developed a small ‘range.’ Currently, the price is at the ‘support’ where we can expect to pop up any time. Thus, the bias is on the ‘long’ side.

EUR/JPY | After The Announcement

After the news announcement, the price suddenly goes higher and closes as a bullish candle. The spike in volatility to the upside was a result of the negative Bank Lending Rate, which was slightly reduced as compared to the previous month. As the rate was not increased, traders bought the currency and sold the Japanese Yen. But since the data was largely poor, the ‘news candle’ was immediately retraced fully, and volatility increased on the downside. Thus, we need to wait for the volatility to subside in order to make a trade.

AUD/JPY | Before The Announcement


AUD/JPY | After The Announcement

The above images are that of the AUD/JPY currency pair, where we see that before the news announcement, the pair in a strong uptrend with nearly no retracement of any sort. This means the Japnese Yen is extremely weak, and irrespective of the news data, a ‘short’ trade is not recommended whatsoever.

After the news announcement, the price initially moves higher, but later volatility increases to the downside and goes below the moving average. This shows that the Bank Lending Rate news was not bad for the Japanese Yen, which is why traders bought the currency later on. We need to be careful by not taking a ‘short’ trade as the overall trend is up and that the impact is not long-lasting.

CHF/JPY | Before The Announcement

CHF/JPY | After The Announcement

The above images represent the CHF/JPY currency pair, where we see in the first image that the market is clearly ‘range’ bound and is not trending in any direction. Just before the announcement, the price is near the top of ‘range,’ which means we can expect sellers to get active any moment from now. We shall wait and see what the news release does to the currency pair and then take a suitable position in the market based on the data.

After the news announcement, the price moves higher, similarly as in the above currency pairs, but gets instantly retraced. The currency pair forms a ‘Rail-Road Track’ candlestick pattern, which indicates that the pair is going to continue its downward move. Hence traders can take ‘short’ after noticing such a pattern after a news announcement. Technically also the place is supportive of a ‘sell.’

That’s about ‘Bank Lending Rate’ and its impact on the Forex market after its news release. If you have any questions, please let us know in the comments below. Good luck!

Categories
Forex Fundamental Analysis

The Impact Of ‘Capacity Utilization’ On The Forex Price Charts

Introduction

Capacity Utilization is a straightforward and crude way of finding out whether a business or an economy is operating at its peak potential. Investors would always prefer to direct their capital, where their returns are maximized to the optimal levels. In this sense, Capacity Utilization can tell us which sectors, or companies, or even economies would attract capital, which would further fuel growth and prosperity. Hence, understanding Capacity Utilization figures will prove advantageous for our fundamental analysis.

What is Capacity Utilization?

Capacity Utilization refers to the proportion of the real potential economic output that is realized at a given point in time. It tells us at what level of maximum capacity is an industry operating at. It is expressed in percentage and is given by the below equation:

For example, a firm that can produce 10,000 phones a day, if it is producing 6,000 phones only, then the company is said to have a Capacity Utilization of 60%.

In the simplest sense, Capacity Utilization is like a report card of an industry or an economy. It tells the current score (or marks) out of the maximum possible marks.

How can the Capacity Utilization numbers be used for analysis?

Capacity Utilization Rate is an essential operational parameter for businesses, especially those manufacturing physical goods, as it is easier to quantify the output.

A company operating at less than 100% implies that the firm can increase its production, and consequently, its profit margin without incurring additional costs of installing new equipment to increase production. Likewise, economies with scores of less than 100% can afford to increase production capacity when demanded.

For the companies, it serves as a metric for determining operating efficiency. Capacity Utilization is susceptible to the following factors:

  • Business Cycles: Businesses are often seasonal, seeing an increase in business during specific periods of the years, although some companies may have consistent business activity throughout the year. It depends on the nature of business and the products being manufactured.
  • Management: Lack of proper management can also lead to wastage of resources; therefore, undermining the efficiency of the company itself. It is not often the common cause but is also one factor that investors must look into to make sure proper management is there to handle the business to utilize the available resources in terms of workforce and equipment to optimize revenue for the firm.
  • Economy’s Health: Economic conditions drive consumer sentiment and affect the spending patterns of people. During fluctuating inflation rates and unstable market economic conditions, people tend to save more and spend less, which can effectively reduce the demand for goods and services. In this case, the company may need to adjust their production to demand.
  • Competition: In an open market environment, competition always takes away a portion of our business, as companies battle for a bigger portion of the market, the best companies with excellent quality goods, and reputation tend to take a higher proportion of market revenue. At the same time, the laggards end up with lower demands for their product.

In general, competition and management factors are a minor component that applies to novice companies that are in the early stages of development. In most cases, the industries are well established in their field and have consistent performance and are indeed susceptible to Economic health and business cycles.

Low Capacity Utilization figures are not desirable. Fiscal and Monetary Policymakers ( Government and Central Banks) monitor the Capacity Utilization figures and intervene using fiscal or monetary levers to stimulate business and economy. Governments can decrease the tax burden on specific sectors to encourage them to invest capital in their growth. At the same time, Central Banks can reduce interest rates to encourage business owners to borrow money and increase business activity through expansion or investment opportunities.

 High Capacity Utilization figures are always preferable, as it indicates that the companies are running at their maximum capacity, and earning maximum achievable profit through their current business setup. When Capacity Utilization is close to 100%, the economy is performing at its peak, and it is ideal an ideal environment for investors to invest in industries. It implies that economic health is stable and growing.

Sector-wise Capacity Utilization rates difference can tell us what amount of slacks each industry is carrying and can direct investment capital into the growing industries than the slowing sectors. By comparing historical highs and lows, we can get a reference, on an industry’s current performance with regards to its peak high and low performances, to understand how it is faring right now.

Impact on Currency

Capacity Utilization is a coincident indicator that is reflective of the market environment and the corresponding policy levers executed to counter the market conditions by the Fiscal and Monetary policymakers. Hence, it gives us a current economic picture as it is a function of the market environment and policy levers.

It is a proportional indicator, where high Capacity Utilization Rates indicate healthy revenue-generating activity, which is suitable for the economy, higher GDP prints, and currency appreciates accordingly. On the other hand, decreasing Capacity Utilization Rates indicate a stagnating or deteriorating business activity, which poses a deflationary threat to the economy, or extreme cases recession, which is depreciating for the currency.

It is a low impact indicator, as the corresponding impacts would have been already priced into the market. We are saying this because policy maker’s decisions come out in the form of interest rates, tax exemptions or reductions, and through survey indicators like business and consumer surveys.

Economic Reports

The “Industrial Production and Capacity Utilization – G17” reports are published every month by the Federal Reserve in the United States on its official website. The reports are published in the formats of estimates and revised estimates.

The first estimate is released around the 15th of every month at 9:15 A.M. for the previous month. It factors in about 75% of the data. The second estimate accounts for 85%, the third estimate 94%, the fourth estimate 95%, and 96% in the fifth and sixth estimates as more of the source data becomes available after each passing month.

Sources of Capacity Utilization

The monthly Capacity Utilization statistics are available on the official website of the Federal Reserve for the United States. The St. Louis FRED website provides a comprehensive list of Industry Production, and Capacity Utilization reports on its website with multiple graphical plots. We can also find global Manufacturing Production figures for various countries in statistical formats here.

Impact of the ‘Capacity Utilization’ news release on the price charts

In the previous section of the article, we understood the meaning and significance of Capacity Utilization, which essentially talks about the manufacturing and production capabilities that are being utilized by a nation at any given point of time. If demand increases, Capacity Utilization increases, but if demand decreases, the rate will fall. Policymakers use this data for fixing interest rates and while calculating inflation in the economy. Thus, investors give a reasonable amount of importance to the data and take a stance in the currency based on the Capacity Utilization rate.

The below image shows the latest and previous Capacity Utilization rate of Japan. We see there was a decrease in Capacity Utilization in March, which means the country underutilized its resources. A higher than expected number should be taken as positive for the Japanese Yen, while a lower than expected number as negative. Let us discover the impact of the data on different currency pairs.

USD/JPY | Before the announcement:

We shall begin with the USD/JPY currency pair to analyze the change in volatility before and after the news announcement. The above image shows the state of the currency pair before the news announcement, where the price moving within a range broadly and currently is in the middle of the range. As there is no clarity with respect to the direction of the market, we shall be trading based on the outcome of the news.

USD/JPY | After the announcement:

After the news announcement, the price falls below the moving average, and volatility increases to the downside. Even though the Capacity Utilization data was not very good for the economy, traders considered the data to be mildly positive for the economy in this case and bought the Japanese Yen. After the market has shown signs of weakness, we are now certain that the volatility will expand on the downside, and thus, we can take a ‘short’ position with a stop loss above the ‘resistance’ of the range.

GBP/JPY | Before the announcement:

GBP/JPY | After the announcement:

The above images represent the GBP/JPY currency pair, where we see that before the announcement, the price has started to move in a ‘range’ after a large move on the upside. This also a place from where the market had reversed earlier, thus we need to trade with caution, as we are not sure where the market will head now.

After the news announcement, the price crashes and sharply moves lower. The Capacity Utilization data proved to be positive for the Japanese Yen, and traders went ‘short’ in the currency pair, thereby strengthening the currency furthermore. This is our final confirmation for taking a ‘short’ trade and taking entry as the volatility increases to the downside.

AUD/JPY | Before the announcement:

AUD/JPY | After the announcement:

The above images are that of the AUD/JPY currency pair, where in the first image, we see that the market is in a strong uptrend indicating a great amount of weakness in the Japanese Yen. Technically, we should be looking for buying the currency pair after a suitable price retracement to the ‘support’ area, but a news release can change the entire plan. Thus, we need to wait and see what the news outcome does to the currency pair.

After the news announcement, volatility slightly increases to the downside, and the ‘news candle’ barely closes in red. This means the impact of Capacity Utilization was least on this currency pair that did not result in huge volatility in the pair. As the overall trend is up, a ‘short’ trade can be very risky as the risk to reward ratio is not in our favor.

That’s about ‘Capacity Utilization’ and its impact on the Forex market after its news release. If you have any questions, please let us know in the comments below. Good luck!

Categories
Forex Fundamental Analysis

The Impact Of ‘Cash Reserve Ratio’ On A Country’s Currency

Introduction to Cash Reserve Ratio

The cash reserve ratio (CRR), also called the reserve ratio, is the minimum amount of deposits of the clients that are to be held by the commercial banks as cash or deposits with the central bank of the country. It is expressed in terms of a percentage. However, the rest can be used for investment and lending purposes. This is primarily done for two reasons; one, to maintain liquidity in the banks, and two, to not let the banks go bankrupt when they need to pay their depositors when demanded.

The amount deposited by the commercial bank into the central bank is unlike depositing into debt and equity funds. That is, the central banks will not pay any interest to the commercial banks for it.

How is the Cash Reserve Ratio Calculated?

The Reserve Requirement times the Bank Deposits yields the Cash Reserve Ratio.

Cash Reserve Ratio = Reserve Requirement Bank Deposits

Where,

Reserve Requirement is a percentage value determined the central banks by considering factors such as supply and demand, inflation rate, spending rate, trade deficits, etc.

Bank Deposits is the Net Demand and Time Liabilities (NDTL), which is the deposits made by the customers into commercial banks.

To understand this clearly, let’s take an example. Let’s say a depositor deposits the US $5000 into his bank account. This amount is referred to as Net demand and Time Liability (Bank Deposits). Also, consider the reserve ratio (reserve requirement) to be 6%. Now, the bank will have to hold 6% of the depositor’s amount (the US $5000) as reserves; that is, US $300 is given to the central bank as cash reserves. The leftover amount (US $4700) can be used for investment as well as for lending loans. If we were to assume that the lost out of $4700, then the bank will have will still $300 safe with the central bank.

The Measure and Impacts of Cash Reserve Ratio 

The Cash Reserve Ratio is an important tool in the monetary policy. As its primary use, the reserve ratio is used to control the money supply of an economy. It also regulates inflation rates and keeps in the liquidity flowing in the markets.

The Reserve Ratio typically measures the change in the interest rates and inflation in an economy. Now, let’s vary the CRR and check on the changes in the inflation rates, interest rates, and the money supply.

Case 1: Decrease in the Cash Reserve Ratio

The CRR is the part of deposits of the customers that are held by the central banks. Now, if there is a decrease in the CRR, the amount held by the central banks is lesser, which implies that the commercial banks will have more amount in their hands. In such scenarios, the banks typically reduce the interest rates on loans they provide. Also, the decrease in the reserve ratio increases the money supply in an economy, and this, in turn, increases the inflation rate.

Case 2: Increase in the Cash Reserve Ratio

The implication when the CRR increases is the opposite of the above case. An increase in the CRR means that the amount held by the central banks is higher, which reduces the amount held by the commercial banks. Now since they have less money in hand, they compensate it by increasing the interest rates on the loans they provide. The money supply, in this case, decrease, which drops the inflation rates as well.

Impact of Reserve Ratio on the Currency

The Reserve Ratio does have an impact on the currency, but indirectly. It does help in determining the demand for the currency. In the previous section, we saw that an increase or decrease in CRR affects inflation and interest rates. As a matter of fact, an increase in the interest rate increases the demand for the currency, given all other factors are kept in favor of the currency. Also, the increase in the interest rates attracts more foreign investors, which creates more demand for the currency. On the other hand, the decline in the interest rates, in general, brings down the demand for that currency. Foreign investors, too, don’t have their eyes here anymore.

Note that, Reserve Ratio or the interest rate for that matter alone does not determine the demand for that currency. There are several other considerations that must be made along with this—for instance, the relationship between interest rates and inflation. Higher interest rates with a decent and feeble increase in inflation can prove a positive effect on the currency.

Cash Reserve Ratio: The Stats

There are portals over the internet where one can find the historical data as well as the forecast data. One can also analyze them by the different types of graphical representations they provide.

India | Brazil | China | Russia

How often is the data released?

The frequency of release of the reports is the same for most of the countries. In countries such as China, Malaysia, Russia, Brazil, etc. the data released every month, while it is released daily in India.

Effect of Cash Reserve Ratio on the Price Charts

Now that we’ve fairly got an idea about the reserve ratio, let’s see how the prices are affected after these reports are out. Precisely, we will see how the volatility of the market has changed as well as the effect in volume.

For our example, we will be taking the Indian Rupee into account to analyze the charts. The frequency of release of data of Reserve Ratio in India is daily. The reports are published by the Reserve Bank of India.

Note that the Cash Reserve Raito data has a feeble impact on the currencies. Since the CRR is indirectly impacted on the currency, the level of impact is pretty low compared to other fundamental indicators such as interest rates, GDP, inflation, etc.

Consider the below announcement made by the Reserve Bank of India. We can that the announcement was made on February 6th at 6:15 AM GMT, and the value reported was 4%, which was the same as the previous month as well as forecasted value.

Now, since the actual values are the same as the previous and the forecasted value, we cannot expect any high volatility or a shoot up in volume as such. However, let’s analyze a few charts and see its impact.

USD/INR | Before the Announcement – (February 6, 2020)

Below is a chart of USD/INR on the 15min timeframe just before the news was released.

USD/INR | After the Announcement – (February 6, 2020)

Consider the chart of USD/INR on the 15min timeframe after the release of the news. The news candle is represented as well. We can see that the news favored the US dollar but not the Indian Rupee. However, the movement wasn’t as gigantic as such. The volatility was above the average, and the volume was quite low. From this, we can conclude that the reports didn’t have any massive impact on the USD/INR.

EUR/INR | Before the Announcement – (February 6, 2020)

EUR/INR | After the Announcement – (February 6, 2020)

Below is the chart of EUR/INR in the 15min timeframe. The news candle has been marked in the box, as shown. We can clearly infer that the news candle barely made a drastic move in the market. Nonetheless, the volatility was above the average mark. So, news traders cannot expect any high volatility during the release of the news. And traders who stay away from the markets during the news can now trade fearlessly as the news doesn’t have a major impact on the currency.

GBP/INR | Before the Announcement – (February 6, 2020)

GBP/INR | After the Announcement – (February 6, 2020)

Below is the chart GBP/INR on the 15min timeframe after the release of the news. The news candle is illustrated in the box, as shown. Similar to the USD/INR and the EUR/INR, this pair, too, has not shown any rise in the volatility as such. In fact, the volatility of this pair is at the average line. So, with this, we can conclude that the Cash Reserve Ratio barely has an impact on the currency.

Conclusion

The Cash Reserve Ratio is the amount of money that is deposited by the commercial banks into the central banks. This is primarily done to maintain the volatility in the banks. The reserve ratio is an important monetary policy tool. Moreover, it determines and maintains the interest rates, inflation, as well as the money supply of an economy. A rise or fall in the CRR brings a change in the previously mentioned indicators. Hence, this is a vital and very helpful fundamental indicator for both economists and investors. But comparatively, it is less helpful for the day traders, as the impact is feeble.