Categories
Forex Fundamental Analysis

The Importance of ‘Loan Growth’ as a Forex Macro Economic Indicator

Introduction

Loan Growth is a suitable parameter for us to check whether the monetary strategies implemented by the Central Authorities are coming into play yet or not. Loan Growth also helps us to gauge the health of the economy in terms of liquidity. Loan Growth percentage serves as a litmus test, especially in a capitalist economy, where credit and inflation primarily drive the economy forward.

What is Loan Growth?

Loan: It is a debt incurred by an individual or entity. The lender is generally a bank, financial institution, or the Government. The lender credits the borrower a sum of money. The borrower agrees to specific terms and conditions that can include finance charges, interest payments, due dates, and other conditions.

Loans can be secured or unsecured. In secured loans, the loan is given out against collateral with a financial value like a property, mortgages, or securities, etc.

Loan Growth: Loan Growth refers to the percentage increase in the number of loans issued overall by banks in a particular region over a particular time frame. The time frame can be monthly, semi-annual, or annual.

Most modern economies today we see are capitalist economies, i.e., they grow through capitalism. A capitalist economy requires money to expand and grow. Hence, credit is an inevitable fuel required for economic growth.

How can the Loan Growth numbers be used for analysis?

A healthy increase in the percentage of Loans is suitable for a stable and healthy economy. But as with any case, there is no perfect economy, and there are two sides of analysis to Loan Growth.

First Scenario

A healthy economy means it is growing at a stable rate year over year with mild inflation each year. Credit fuels economic growth in this type of economy. In this type of economy, an increase in the number of loans taken can be considered a positive sign for the economy.

Businesses can grow beyond just cash in hand. Householders can purchase homes without saving the entire cost before purchase. Governments can meet their spending needs without relying solely on tax revenues. Be it a business, householder, or a Government can smoothen out their economic activities in terms of money. They will take credit when in deficit and payback when in surplus.

An increase in Loan Growth can imply that more people are creditworthy, and more businesses are taking credit to expand and grow. Both of these scenarios are good for the GDP and is a good sign for the economy.

Second Scenario

The first scenario takes into the assumption that the economy is strong and stable. In reality, currently, most of the developed nations are struggling to maintain their economic growth. For example, the United States debt to GDP ratio is above 100%, which indicates that even if the entire GDP were given out to repay the debt, it would still be in some debt. Most of the developed nations have taken substantial credits to keep the economy from ticking over.

Keeping economic growth and global competency in mind, most countries have invested heavily in overgrowing in the short-term. By taking on more and more debts, countries may have achieved the necessary growth and needs now but have pushed their problems to the future.

Economists argue that eventually, there would be a time when countries cannot afford any more debt and would be backed into a corner. The only way out then would be at a considerable cost of losing out more than what they had made. Studies also show that rapid loan growth than the long term average also has seen an increase in underperforming or bad loans.

It is also essential to know that increase in Loan Growth should be accompanied by the fact that no bad loans are given out. Giving loans to people and businesses who do not have the eligibility but just because money is lying around is also a problem.

In the United States itself, the Government has been injecting money into the economy since the financial crisis in the form of Money Supply and Quantitative Easing programs to inflate their way out of depression or recession. Until now, the Government has not been able to reduce debt and is only taking on more debt to sustain the current growth.

An increase in loans is good or bad for the economy remains debatable for many. Without credit, sector growth is almost unimaginable in present times. For our analysis, we can use the Loan Growth rate as a litmus test to see whether the injected money from the Central Authorities has started reaching the public and businesses.

When the Central Authorities want to inflate the economy, they reduce interest rates by injecting money into the interbank market. The injected money takes time to get into the economy, and loans are one form in which this money gets circulated.

Overall, for our analysis, once Loan Growth shows increasing numbers, we can assume that the injected money is reaching the intended sectors, and consequent effects could be predicted on businesses and consumers. Loan Growth is indicative of a growing economy in general and is more prominent in developing countries.

Impact on Currency

Loan Growth is a by-product of a reduction in interest rates from the Central Banks of the country and an increase in employment and business growth. An increase in Loans indicates that money is “cheaper” to borrow. It is inflationary for the economy and is given out to induce growth (which may or may not happen).

An increase in Loan Growth depreciates currency as more money is competing against the same set of goods and services. A decrease in Loan growth appreciates the currency as the reduced liquidity forces goods and services to come at reduced prices.

Overall, Loan Growth is a low-impact indicator, as the Central Bank’s interest rates are the leading indicators, and the desired effect from increased loans can be traced from other leading indicators like Consumer and Business surveys.

Economic Reports

Since Loan Growth is not a significant economic indicator, official publications for significant countries are not explicitly published but can be obtained through reports analysis. For our reference, the Trading Economics website consolidates the Credit Growth in different sectors for data available countries on its official website. Since it is a consolidation, frequency and time of publication vary from country to country.

Sources of Loan Growth

Loan Growth consolidated available data for different countries are available here.

“The impact of bank lending on Palestine economic growth: an econometric analysis of time series data” has been referenced for this article.

How Loan Growth Affects The Price Charts

Loan growth is not a statistic. Most forex traders keep an eye when making their trades. The lack of interest is because it is considered a their-tier leading indicator. It is, however, essential to know how the release of this fundamental economic indicator affects the forex price charts.

In the EU, loan growth data is released monthly by the European Central Bank about 28 days after the month ends. It represents the change in the total value of new loans issued to consumers and businesses in the private sector. The most recent release was on July 27, 2020, 8.00 AM GMT can be accessed here. A more in-depth review of the economic news release can be accessed at the ECB website.

Below is a screengrab of the Forex Factory website. On the right, we can see a legend that indicates the level of impact the Fundamental Indicator has on the EUR.

As can be seen, low impact is expected on the EUR.

The screengrab below is of the most recent change in the loan growth in the EU. In June 2020, private loans grew by 3% as compared to the same period in 2019. This change represented a flat growth from the previous release. Based on our fundamental analysis, this should be positive for the EUR.

Now, let’s see how this positive news release made an impact on the Forex price charts.

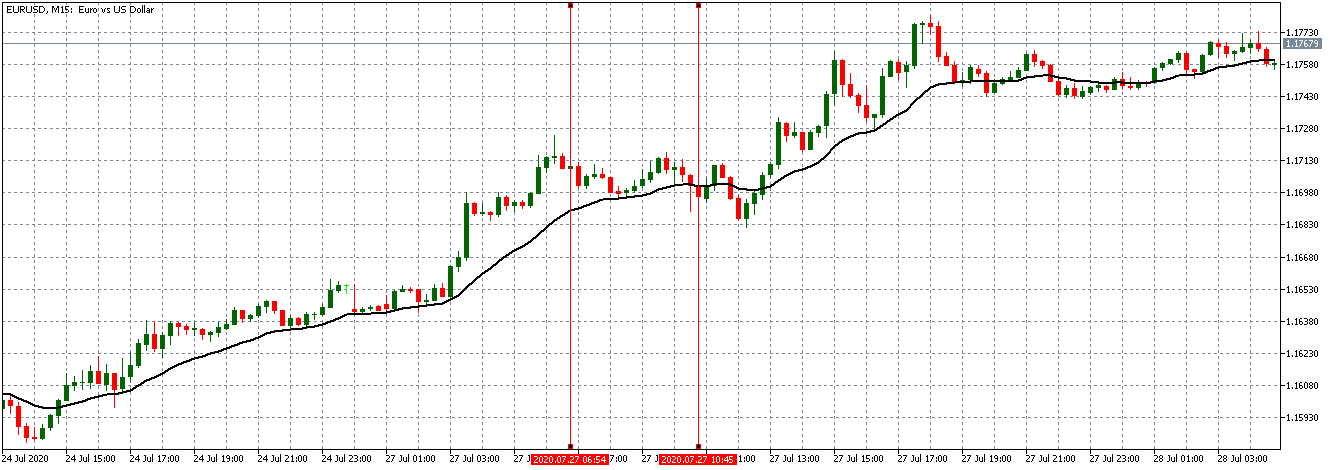
EUR/USD: Before Loan Growth release on July 27, 2020, 
Just Before 8.00 AM GMT

From the above chart, the EUR/USD pair is trading on a neutral trend before the data release. The candles are forming around the flattening 20-period Moving Average. This trend is an indication of relative market inactivity.

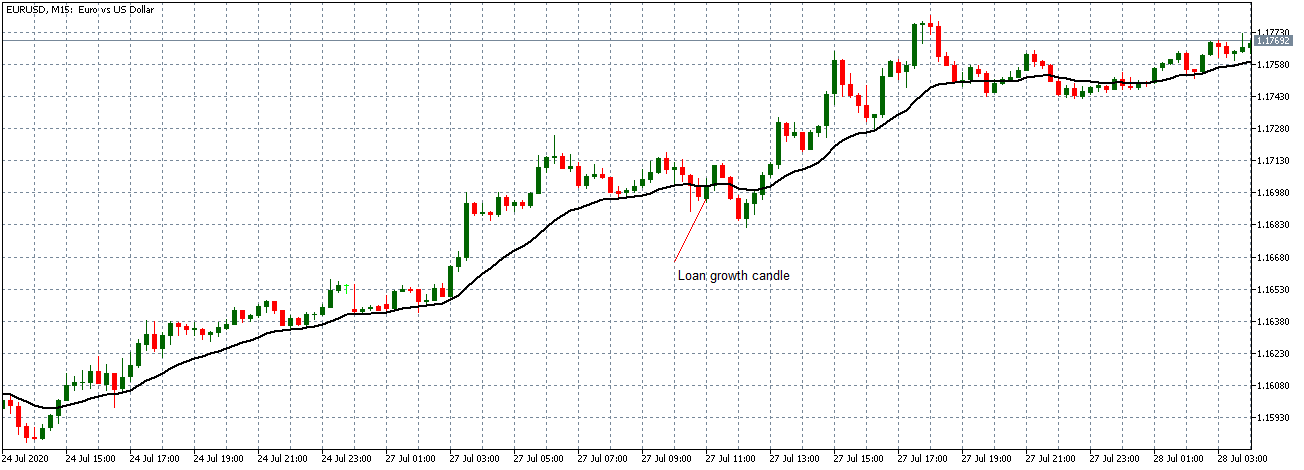
EUR/USD: After Loan Growth release on July 27, 
2020, 8.00 AM GMT

After the news release, the pair forms a 15-minute bullish candle as EUR becomes stronger as expected. However, the news release was not strong enough to cause a shift in the pair’s trend since the pair continued to trade in the previously observed neutral trend.

Now let’s see how this news release impacted other major currency pairs.

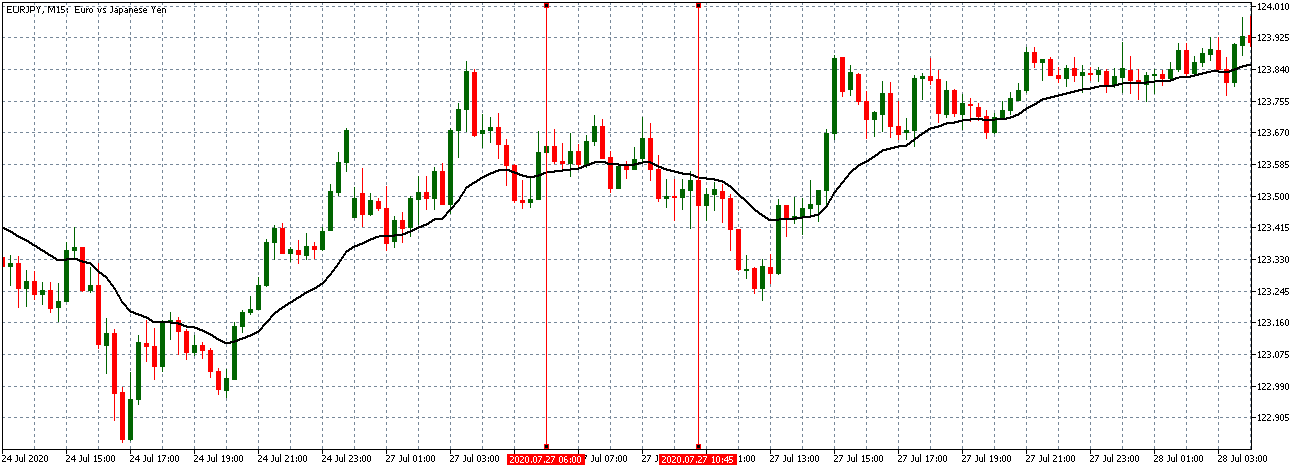
EUR/JPY: Before Loan Growth release on July 27, 2020, 
Just Before 8.00 AM GMT

Before the news release, EUR/JPY traded in a similar neutral trend as observed with the EUR/USD with the candles forming around a flattening 20-period Moving Average.

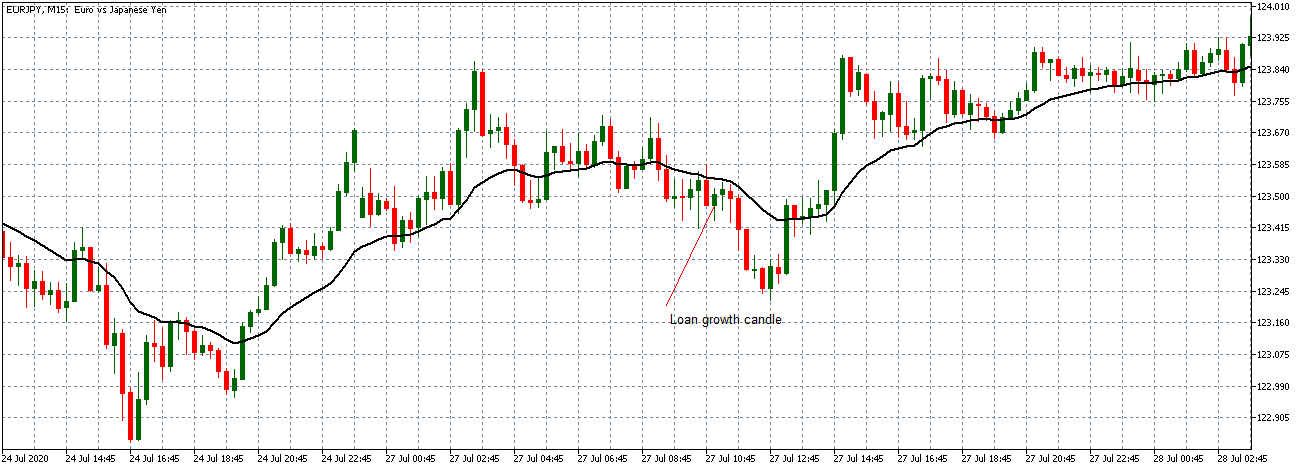
EUR/JPY: After Loan Growth release on July 27, 
2020, 8.00 AM GMT

As observed with the EUR/USD pair, EUR/JPY formed a 15-minute bullish candle after the news release as expected. The subsequent trend does now significantly shift.

EUR/CAD: Before Loan Growth release on July 27, 2020, 
Just Before 8.00 AM GMT

EUR/CAD: After Loan Growth release on July 27, 2020, 
8.00 AM GMT

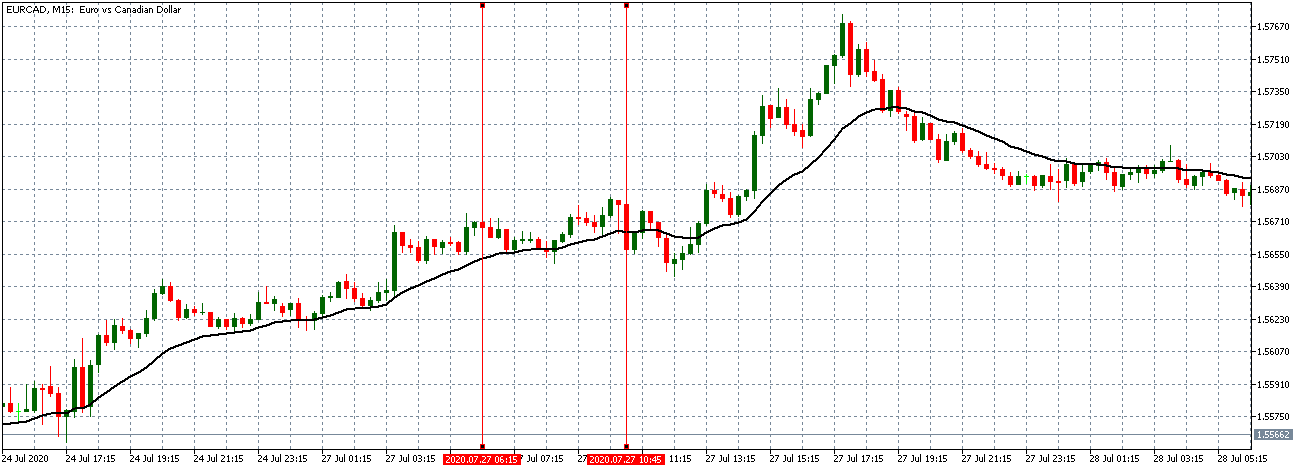
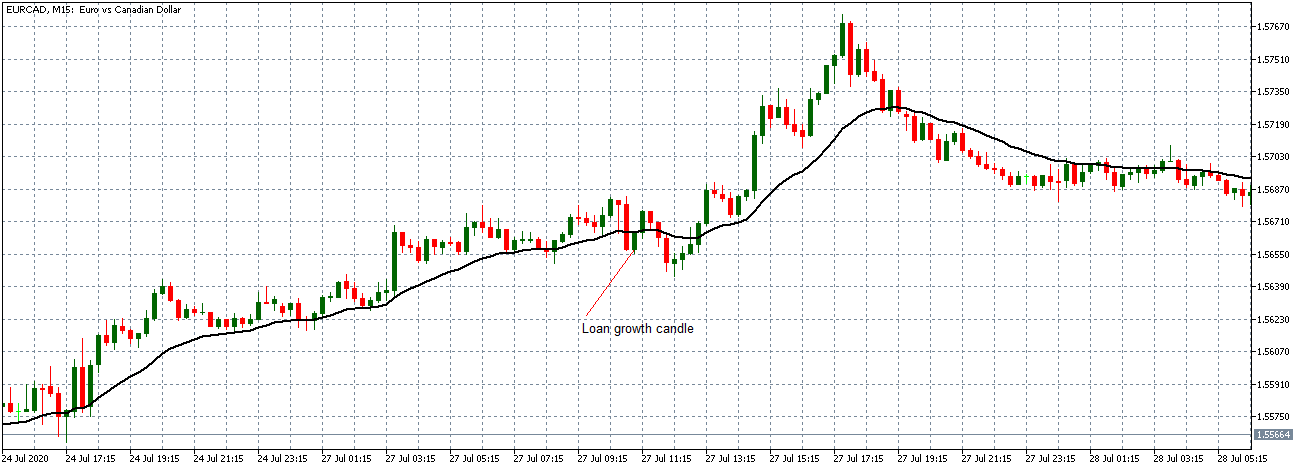
The EUR/CAD pair shows a similar neutral trading pattern as the EUR/USD and EUR/JPY pair before the news release. After the news release, the pair forms a 15-minute bullish candle but later continued trading in the earlier observed neutral trend as the 20-period Moving Average flattens.

The release of the loan growth data has an instant short-term effect on the EUR. The data is, however, not significant enough to cause any relevant shift in the prevailing market trend.

Categories
Forex Fundamental Analysis

Importance of ‘Lending Rate’ News Announcement on the Forex market

Introduction

The ease with which money can be obtained within a country primarily drives the business sector and consumer spending. Consumer Spending and Businesses mostly make up the GDP of a country. Hence, understanding Lending Rates and its impact on the economy can help us build our fundamental analysis better.

What is Lending Rate?

Lending Rate: The rate at which a bank or a financial institution charges its customers for lending money. It is the fee that is to be paid by the customer for the borrowed money. Bank Lending Rate, in general, is the Bank Prime Rate.

Bank Prime Rate: It is the rate of interest that banks charge their most creditworthy customers. It is the lowest interest rate at which banks generally gives out loans. On the receiving end usually are large corporations with a good track record with the concerned bank. Generally, the loans taken are also huge.

Other forms of loans like house mortgage, vehicle loans, or personal loans, are all either partly or wholly based on the prime rate. It is also important to note that the Central Bank’s interest rates set the bank lending rate. For the United States, the Federal Reserve’s, the Federal Open Market Committee (FOMC) determines the target fed funds rate.  Fed funds rate will ultimately influence all the Bank lending rates on account of competition.

How can the Lending Rate numbers be used for analysis?

Banks and financial institutions are the primary source of money for businesses and consumers across the country. Hence, Bank Lending Rates can mainly drive business direction and influence consumer spending.

The Central Banks will influence the interest rates through their open-market operations in the inter-bank market by purchasing or selling bonds. When Central Banks buy bonds, they inject money into the economy, thereby effectively inducing inflation. It is popularly referred to as the “Dovish” approach. When the Central Bank sells bonds, it is effectively withdrawing money from the economy, making money scarce and costly to borrow. It is popularly referred to as the “Hawkish” approach.

When the Central Bank wants to deflate the economy, they will sell bonds, and when they decide to inflate, they will effectively buy bonds. In the private sector, Consumer Spending makes up about two-thirds of the United States’ GDP, and the rest is mostly by the business sector. The ease with which money is made available to people and business organisations affects the economy in a big way.

When lending rates are low, businesses can procure loans easily; they can run, maintain, and expand their current businesses. On the other hand, when the lending rates are high, only the high-end companies can procure loans. Meanwhile the rest of the business struggle to stay afloat in the deflationary environment. Businesses would be forced to keep their expansionary plans on halt when loan rates are high.

Consumers are also encouraged to take on loans when the rates are low. It promotes consumer spending, which, in turn, boosts local business. On the other hand, when interest rates are high, consumers would tend to save more spend less. When spending is less, businesses also slow down, especially sectors that do business with non-essentials like entertainment, luxury, or recreation.

On the international scale, the lending rates and deposit rates of banks from different countries also drive the flow of speculative money from international investors. When the lending rate in one country’s bank is lower than the deposit rate in another country’s bank, investors can generate revenue through a “carry.” Investors will borrow from the low-yielding currency bank and deposit in the high-yielding currency bank. The difference between these two rates is the margin they make.

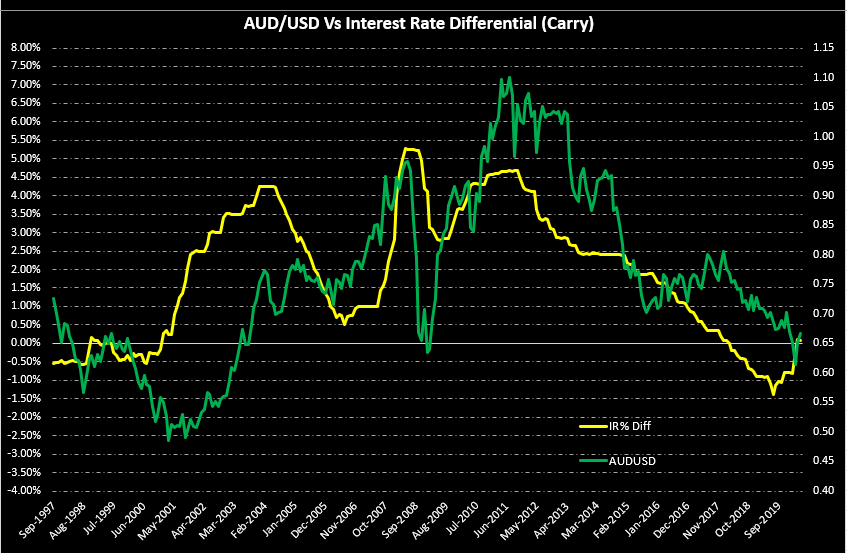
The above plot shows the actual plot between the interest rates differential (AUS IR – USA IR) and the AUD USD exchange rate. As we can see, whenever the difference between the interest rates rises in favour of AUD, the exchange rate tends to follow. There is a strong correlation between both in the long run.

Since the Central Bank’s interest rates primarily determine all the lending rates (all types), investors generally calculate interest rate differentials by subtracting interest rates of two countries to see potential “carry” opportunities. Hence, when low-interest rates are prevalent, currencies lose value, on account of inflation and also outflow of money into other countries where deposit rates are higher.

Overall, the lending rates and deposit rates together move the currency markets in favour of the country’s currency, having higher deposit rates.

 Impact on Currency

The underlying Central Bank interest rates influence lending rates. The market is more sensitive to Central Bank interest rate changes than the bank lending rates. The lending rates of banks are also not as immediate as the Central Bank’s interest rate changes. Hence, although lending rates impact the economy, its effects are only apparent after about 10-12 months.

Hence, Lending rates are a low-medium impact indicator in the currency markets, as the leading indicator Central Bank interest rates take precedence over bank lending and deposit rates.

Economic Reports

The lending rates of banks can be found from the respective banks from which we would want to borrow money. For the United States, the Federal Reserve publishes Monday to Friday the daily Interest Rates in its H.15 report at 4:15 PM on its official website. Weekly, Monthly, Semi-annual, and Annual rates of the same are also available. The average Bank Prime Rates are also available in the same report.

Sources of Lending Rate

The United States Fed Fund Rates are available here. The prim Bank Loan Rate is available in a more consolidated and illustrative way for our analysis in the St. Louis FRED website. Consolidated Bank Lending Interest Rates of different countries are available here.

How Lending Rates Affects Price Charts

The lending rates can either create expansionary or contractionary effects within an economy.  Let’s now have a look at how it affects the price action in the forex market. In the US, lending rates entirely depend on the Federal Reserve’s Fund Rate. On March 4, 2020, the lending rates were cut from 4.75% to 4.25%. This cut coincided with the Federal Reserves’ interest rate cut from 1.75% to 1.25% on March 3.

On March 16, 2020, the lending rates were reduced from 4.25% to 3.25%. This cut coincided with the Federal Reserves’ interest rate cut from 1.25% to 0.25% on March 15.

For this reason, the lending rates rarely affect the price action in the forex markets.

In the US, the Bank Prime rate is published every weekday at 4.15 PM ET. Below is a screengrab from the US Federal Reserve showing the latest bank prime rates.

As can be seen, the rate has remained at 3.25% from March 16, 2020. For this analysis, we will consider if the change on March 16, 4.15 PM ET from 4.25% to 3.25% had any effect on the price action of selected currency pairs.

EUR/USD: Before Lending Rate Change on March 16, 2020, 
Just Before 4.15 PM ET

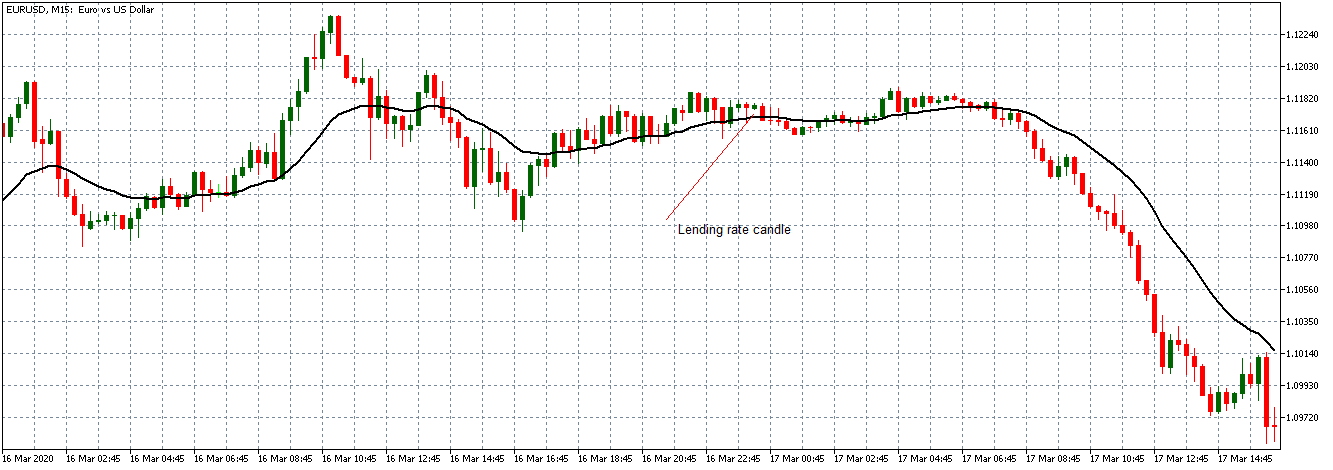
Between 10.00 AM and 4.00 PM ET, the EUR/USD pair was on a neutral trend. This neutral trend is shown on the 15-minute chart above with bullish and bearish candles forming slightly above the flattening 20-period Moving Average.

EUR/USD: After Lending Rate Change on March 16, 
2020, 4.15 PM ET

As shown by the chart above, the EUR/USD pair formed a slightly bullish 15-minute candle after the daily release of the lending rates. As earlier mentioned, the release of the lending rates is not expected to have any significant impact on the price action. This sentiment is further supported by the lack of change in the prevailing trend after the news release since the pair continued trading on a neutral stance.

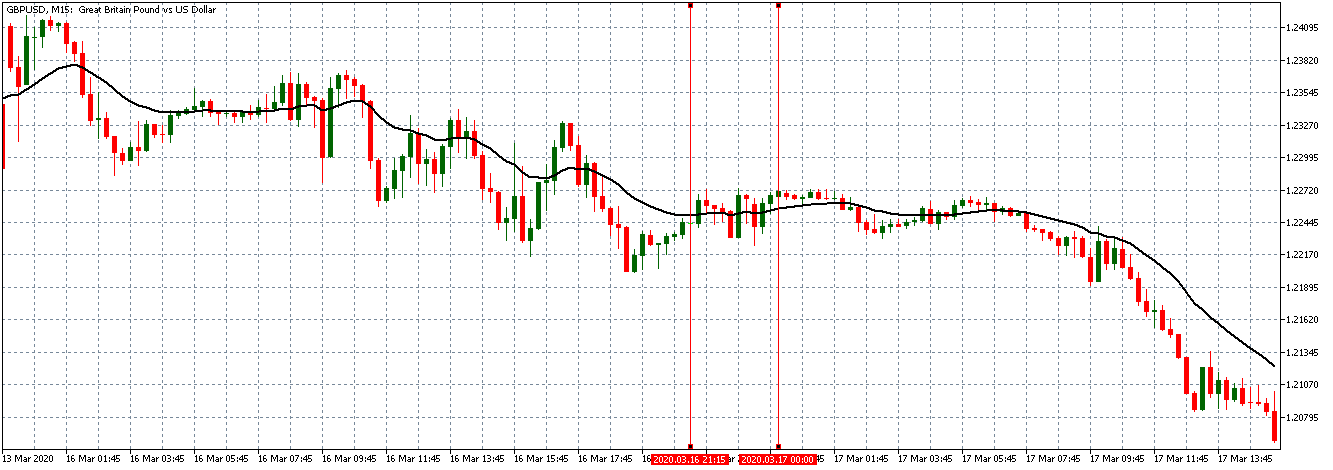
GBP/USD: Before Lending Rate Change on March 16, 2020, 
Just Before 4.15 PM ET

The GBP/USD pair showed a similar neutral trading pattern as the EUR/USD pair between 1.00 PM and 4.00 PM ET. This pattern can be seen on the above 15-minute chart with candles forming on the flat 20-period Moving Average.

GBP/USD: After Lending Rate Change on March 16, 
2020, 4.15 PM ET

After the news release, the pair formed a slightly bearish 15-minute candle but continued trading in the earlier neutral trend.

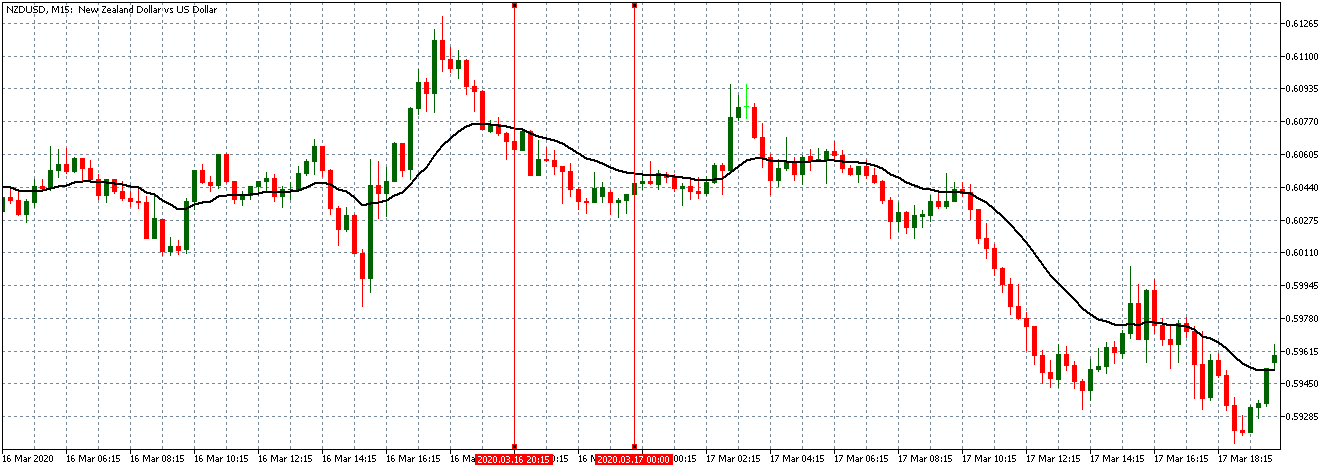
NZD/USD: Before Lending Rate Change on March 16, 2020, 
Just Before 4.15 PM ET

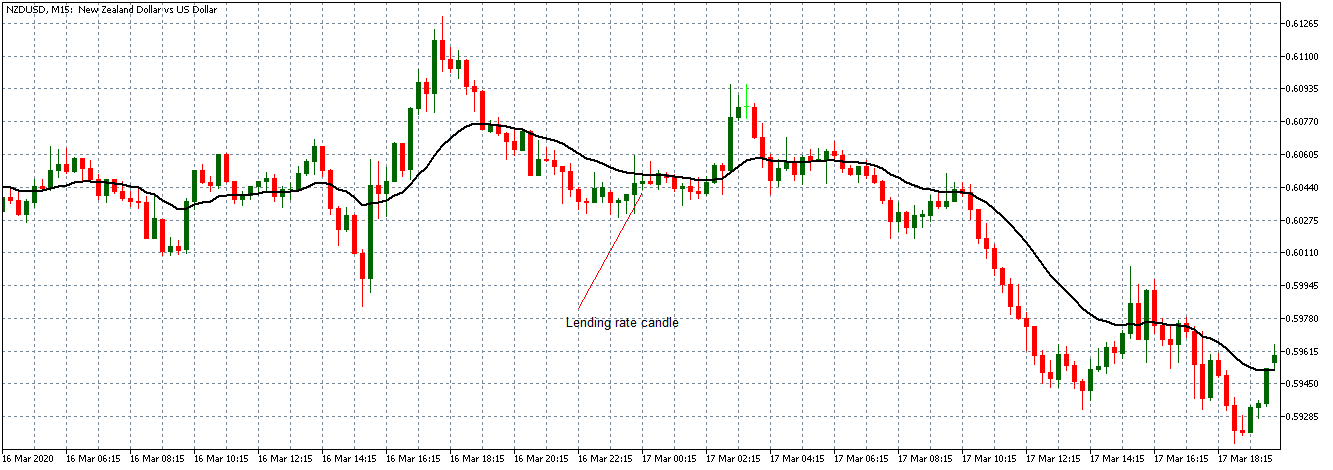
NZD/USD: After Lending Rate Change on March 16, 
2020, 4.15 PM ET

Unlike the EUR/USD and the GBP/USD pairs, the NZD/USD pair had a steady downtrend between 12.15 PM and 4.00 PM ET. After the release of the daily lending rates, the pair formed a bullish 15-minute candle, but just like the other pairs, the news was not significant enough to change the prevailing market trend.

As we noticed earlier, the lending rates move in tandem with the Federal funds rate. Since the lending rates have always remained unchanged in the market and forex traders have anticipated this, hence the lack of volatility accompanying the news release.

Categories
Forex Fundamental Analysis

What Can We Infer From A Country’s Central Bank Balance Sheet?

Introduction

Banks Balance Sheets are useful to ascertain the financial performance of the banks; this is correlated as an economic indicator when the bank in question is the Central Bank of the nation, for example, The Federal Reserve Bank of the United States. A Bank’s Balance Sheet can help us analyze its financial activities in terms of how much money has gone in and out of the banks and in what form, which can have different consequences on the economy. Hence, Analyzing a Bank’s Balance Sheet is useful for investors and also for our fundamental analysis.

What is Bank’s Balance Sheet?

A Bank’s Balance Sheet is a comprehensive summary of its total assets and liabilities. Assets here refer to financial instruments that BRING-IN revenue and liabilities refer to those for which the Banks need to pay off.  In simpler words, assets are what the bank “OWNS” and liabilities are what a company “OWES.”

Banking is a highly leveraged business. Banks make a profit solely out of the interest they receive on the lent out loans and the interest they pay out on the money deposited into their banks. Depositors would typically be general populations opening a savings account for their income and business firms having current accounts usually to maintain and run their holdings.

A Bank’s Balance Sheet has two important categories that divide the entire data, i.e., Assets and Liabilities. For the common man, liability would be a home loan which takes away a portion of his income and an asset would be the home itself on which he may or may not receive rent.

Assets | The assets of a bank can be the following
Reserves

Banks are to follow mandates as dictated by the Central Banks to maintain a certain amount of their total deposits as reserves, which cannot be used to lend out loans in order to maintain solvency during critical times. This mandate also makes sure banks maintain enough cash to meet the withdrawal demands daily at all times.

Loans

For the common man, a loan would be a liability, but for a bank, it is an asset as it brings in revenue in the form of interest. Banks can give credit to the general public, business firms, or even government through bonds. A loan is one of the primary sources of a bank’s income, and the proportion of loans to deposits can make or break a bank when they do not balance out.

Excess loans and fewer deposits can result in insufficient funds to meet withdrawal needs, and excess deposits can eat away the profit margin as the fewer loans do not generate enough revenue to balance out deposit rate amounts.

Cash

The liquid money that the banks maintain to run everyday operations and to show healthy solvency is the most precious of all assets as they can be traded without any loss of value directly without any lag.

Securities

Banks often purchase securities like the Treasury Bonds for which they receive interests regularly, which adds to their total assets.

Fixed Assets

Banks of decent size and scale often diversify their assets by purchasing fixed assets like real estate or gold deposits, which appreciate over time and match up with inflation and act as alternate forms of their other assets.

Balances at Central Banks

Banks are also required to maintain a certain proportion of balances in Central Banks.

Liabilities | The liabilities of a bank could be the following
Deposits

Money deposited by customers who can be people or business organizations.

Money owed to Other Banks

Banks lend each other money in the interbank market when they are either excess or short of their reserves.

Money owed to Bondholders

People owning bonds of banks receive money from the bank, and this generally includes shares and dividends that banks need to pay out as per bond agreement.

Owner’s Equity

Money that belongs to people who invested during the start of the company and helped it run.

Why Bank’s Balance Sheet?

In our context, we need to see the Central Bank’s Balance Sheet, which tells us what open market operations are being conducted by them, which can give us clues about the money circulation conditions in the economy. Since Money Supply metrics like M0, M1, M2 all originate at the Central Bank of a country, their actions and mandates can have a ripple effect in the entire banking system of the nation.

Hence, Central Banks are at the very heart of the Money Supply of a country. With their operations, they can pull out money from the economy or push new money into the system to ensure a smooth run of the economy.

How can the Balance Sheet numbers be used for analysis?

Central Bank activities have a direct influence on inflation and deflation. The Federal Bank in the United States for the past few years has been an active purchaser of bonds as part of the Quantitative Easing Programme, and this has led to a low-interest-rate environment and inflationary conditions. When the Fed releases money into the system on such large scales, it allows banks to lend more money to people and thereby to stimulate the economy. Withdrawal of money by selling their bonds could result in deflationary conditions likewise.

Besides this, what bonds the Fed purchasing is also important, as they have been continuously buying the government bonds to transfer government debt onto themselves, to help the government-run and be able to pay their interest bills in this low-interest-rate environment.

Impact on Currency

The Central Bank’s Balance sheet as a percentage of GDP is just another form of Government debt to GDP ratio, with the only difference being here the debt is owed to the Central Bank. When the debt of government goes beyond 80%, here the only viable choice is to maintain this inflationary condition and low-interest-rate environment.

A decreasing percentage of balance to GDP indicates a growing economy and strengthening of the currency, and an increasing proportion of the same shows an oncoming recessionary period, which is depreciating for the economy.

Economic Reports

In the United States, the Fed’s Balance Sheets are released on Thursday at 4:30 PM every week. Their balance sheet is included in the Federal Reserve’s H.4.1 statistical release titled, “Factors Affecting Reserve Balances of Depository Institutions and Condition Statement of Federal Reserve Banks,” available on the official website.

There are also quarterly reports available for the same, measured as a percentage of GDP in the St. Louis FRED website, which is also a useful tool to monitor the bank’s activity.

Sources of Bank’s Balance Sheets

Below are the official Fed’s Balance Sheet reports – Fed Bal Sheet

Pictorial representation of the same is available in a comprehensive manner in the official website of FRED – FRED – Bal Sheet

Factors affecting Reserve Balances weekly reports can be found here – Thursday Fed Report

The news announcement of this fundamental Forex driver doesn’t have a great impact on the price charts. But we can look at the numbers of Government Debt to GDP ratio as mentioned above to trade the market. Cheers!

Categories
Crypto Guides

Implications Of Blockchain In the Global Money Transfer Industry

Introduction

Fund transfers within the country are cheap and fast. But, transferring money from one country to another is typically slow as well as expensive. Presently, most international fund transfers are made using the SWIFT (Society for Worldwide Interbank Financial Telecommunication) network.

Note that SWIFT is not the one that makes money transfers. Instead, it is a network that allows communication between financial institutions for a reliable and secure transfer. This is also the reason why several banks and financial institutions sue their services.

Traditional International Fund Transfer

A transfer via SWIFT technology usually takes several days to be completed. To understand how these transfers work, let’s consider a fund transfer from a US company to a supplier in China.

1️⃣ The US company would send an order to its associated bank to make a transfer to the Chinese company.

2️⃣ Assuming it is a local bank, it would not have access to make international financial markets. So, the local bank approaches a correspondent bank in the US that acts as an intermediary.

3️⃣ The American correspondent bank would then initiate a transaction to the bank in China. If this Chinese bank is not a correspondent bank, it will approach a correspondent bank to receive its payment.

4️⃣ Once the payment is received by the Chinese correspondent bank, it will locally transfer it to the supplier’s bank.

This completes a transaction between the two countries. It can be clearly ascertained that there are many intermediaries for a single transfer. This would eat up a lot of time. And for making the transfer, certain compensation must be paid to intermediaries.

Blockchain into International Money Transfer space

A paper relating to payments using blockchain titled ‘Leading the pack of Blockchain Banking’ points out that several international financial institutions expect blockchain to have a major impact on their businesses. This paper was carried out by the IBM Institute of Business Value and the Economist Intelligence Unit, which accounted for a survey of 200 banks in 16 countries. In the outcomes, about 70% of these banks believed that blockchain technology would reduce the expense and time of international transfers.

As an initiative, several major banks from different countries joined to design a blockchain-based digital currency. Their primary aim is to create a cryptocurrency that would ease utility settlements using blockchain. The list of banks that put forth this initiative include Barclays, HSBC, Credit Suisse, Canadian Imperial Bank of Commerce, Mitsubishi UFJ Financial Group, and State Street.

Furthermore, to speed up payments, an initiative involved a tie-up between Citi and Nasdaq. Using Citiconnect for blockchain, the users will get direct access to global payments from Nasdaq’s Linq platform. This new venture will allow cross-border multicurrency payments and real-time tracking of payment transaction activity.

(Image Credits – Irish Tech News)

Blockchain here to replace the banks?

The traditional banking is powerful in its own ways. It is quite unlikely that a blockchain-based cryptocurrency will be able to completely replace the existing banking system. However, it may not be of a surprise if digital currencies are increasingly used for back-end settlement. Cheers.

Categories
Crypto Guides

Do Cryptocurrencies Have The Potential To Be An Alternative Financial System?

Introduction

Bitcoin, the first cryptocurrency, bought a notion of decentralization in the market. Initially, it had a slow start, but later as the public began to understand the working of decentralized markets & the interest towards cryptos has increased. Its been ten years since Bitcoin’s inception, and currently, close to five thousand cryptocurrencies are existing in the market. The total market capitalization of all the cryptocurrencies combined is close to $195 Billion as of Dec 2019. The 24-hour transaction volume is around $78 Billion.

This kind of volume is enormous, but it can nowhere be compared to the gazillion amounts transaction volume that takes place in the Forex market. So it is safe to say there is a lot more that cryptos have to do to compete with the current financial system directly. But that doesn’t mean they don’t have the potential to do so. Hence, in this article, let’s discuss the pros of the decentralized financial system of cryptos and the cons of centralized current financial systems.

A bright future ahead?

Cryptocurrencies have features which prove to the extent that they do have room for being replaced with fiat currencies. The most crucial point of consideration is that cryptos cannot be quite easy as the fiat currencies, thanks to their decentralized and unregulated status. The technology that makes this possible is the blockchain network.

Moreover, cryptocurrencies could support the concept of universal basic income much better than the fiat currencies. In fact, some programs have already set an example by using cryptocurrencies as a means of distributing a universal basic income. Furthermore, cryptocurrencies could remove the existence of intermediaries in everyday transactions. This would eventually cut costs for businesses and help out the consumers.

Advantages Of Decentralized Financial Systems

✔️ Fraud prevention

Cryptocurrencies are powered by blockchain, which is an open-source ledger. Every single is recorded and recorded and verified through a consensus algorithm, so it is almost impossible to tamper with any transactions. This indeed is an enormous benefit of the decentralized financial system.

✔️ Shielded from government meddling

Decentralized financial systems, such as the cryptocurrencies, are not controlled by the government, central bank, or any other government body. This is a great advantage because when government meddles with currencies, it creates inflations or hyperinflation by devaluing, debasing, or printing too much currency in a short period of time.

✔️ Faster transactions

Decentralized-based cryptocurrency transactions are often much, much faster than the bank transactions. For bank wire transfers, the transaction time is around two days. But, in the case of cryptocurrencies transfers, it takes not more than a few minutes.

Disadvantages Of Centralized Financial System

❌ Regulations & Transaction Cost

There are limitations placed on how much of funds one can withdraw in a day & in a month. For instance, in the US, $2000 is the maximum withdrawal limit, and in some banks, it is less than $500. But when it comes to cryptos, it doesn’t matter. One can transfer any amount of funds without having to worry about the limits. Also, when it comes to the transaction cost, crypto transactions are way too cheaper than the typical bank fee.

❌ Payment Delays & Human Errors

Bank wire transfers typically take 1-5 days for the transactions to get processed. It also depends on various factors like the place from where you are sending money to. This is because each of the countries will have their own banks and hence different regulations. But cryptocurrencies do not have geographical boundaries like this. Transactions get executed almost immediately irrespective of where you live. Also, there is a possibility of the occurrence of minute errors as there is human involvement. But in the case of cryptos, users just have to copy-paste the corresponding address to perform their transactions. By doing this, there is very little chance of the occurrence of human errors.

Final Conclusion

The answer to the question ‘Do Cryptocurrencies Have The Potential To Be An Alternative Financial System?’ is NO as of today. But they do have the potential to be so. As of today, central banks are extremely powerful, and they can not be replaced with the current technology. One thing that we are sure about is that the cryptos have made an impact, and they have grabbed the attention of most of the central banks. We have also seen some of the central banks adopting blockchain technology to issue their own coins. So the most plausible prediction is that cryptocurrencies may play an active, supportive role in making the traditional banking processes extra cheaper, more transparent, and faster.

Categories
Forex Course

19. Decentralized Forex market and its hierarchy

Introduction

It is a known fact that the forex market is the market for trading currencies, and the stock market is for trading shares of a company. This being the major difference between the two, there is another significant difference you must know. The stock market is fully centralized, while the forex market is decentralized. In this lesson, let us discuss how different a decentralized market is to a centralized one. Apart from that, let us also understand the structure of the forex market.

The Centralized Market

In a centralized market (stock market), there exists an intermediary between the buyer and seller to trade in the market. There is an entity called the central exchange, which facilitates the transactions between the two parties. In the present day, ECNs on stock markets have brought this to an end as they connect both the parties directly, which ensures the bid and ask prices are unified. Also, the competition between ECNs and direct traders tighten spreads and increments the available volume, making harder the manipulation of the prices.

The Decentralized Market

In a decentralized market, there is no concept of centralized exchanges. With the absence of a central intermediary, there is direct trading between buyers and sellers among top institutions. However, by default, retail traders will have to approach a broker to facilitate their transactions. Depending on the liquidity provider, the quotes of the currencies typically vary from broker to broker. That makes accounts open on non-ECN brokers suitable for price and spread manipulation. There is a possibility that a retail trader won’t be guaranteed the real bid and ask prices in the market. However, though there is manipulation, the volume of traders in the forex market is much higher when compared to the stock market. This could be due to the fact that the leverage in the forex market is considerably higher than the stock market.

Hierarchy of the forex market

Banks and retail traders are not the only ones who contribute to the Forex Market. In fact, there is a linear organization in the contributors to the forex. The hierarchy for the same is given below based on their significance in the market.

  • Major Banks ( Central banks + Top Commercial Banks)
  • Electronic broking services (EBS) | Reuters dealing
  • Medium-sized banks and small-sized banks
  • Hedge funds and commercial companies | retail ECNs
  • Retail traders

From the above hierarchy, it is clear that the major banks are the largest contributors in the market. Major Banks consist of the largest banks around the world. The uniqueness of the major banks is that they trade directly with each other or via the EBSs or the Reuters dealing. Hence, it is also referred to as the interbank market. And this interbank market includes the medium-sized banks as well as the small-sized banks.

Next up in the line come the hedge funds, commercial companies, and retail ECNs. These sets of traders don’t make the transactions with the interbank market, but, instead, they get it done via commercial banks. Typically, the quotes offered here are much higher than that of the interbank market.

Finally, last up in the line stand the retail traders. Retail traders are the ones who place their trades via forex brokers. The number of traders in this hierarchy is extremely high. However, when it comes to the volume they trade, it is significantly lesser when compared to banks and hedge funds. Back in the day, it was not possible for small retail traders to enter the market. But, nowadays, anyone can trade the Forex market by depositing as low as $100 into their account.

Hence, this completes the lesson on the forex market hierarchy. In the following lesson, we shall take this topic forward by as we’ll be covering the different types of players in the forex market in detail.

[wp_quiz id=”47497″]
Categories
Crypto Guides

What Should You Know About Ripple? The Most Centralized Cryptocurrency!

Introduction 

In our previous articles, we have seen that Bitcoin has inspired and paved the way for a multitude of new and affordable platforms using cryptocurrencies. Ripple is one such platform developed by Ripple Lab’s incorporation, a US-based company in 2012. It is a payment platform built upon a distributed open-source protocol. This best part about this cryptocurrency is that it is backed by major Banking and financial institutions. They use Ripple for transferring money, commodities, cryptocurrencies, or any other units of value like flier miles or free mobile minutes.

Objective

The Objective of Ripple is to rule over all the international transactions worldwide. They have come up with this objective as the cost of international transactions is too high if we transact using traditional means. It also takes days to settle the transaction. The most innovative idea behind this platform is that we can use the network to transfer any currency, not only cryptocurrency, to be more specific. Thus, making the platform currency independent. Ripple Network, also knows as RippleNet, enables many banks and financial institutions to send and receive money smoothly throughout the world.

How is Ripple different from other cryptocurrencies?

In the world of blockchain, the upcoming networks or platforms are trying to eradicate the existing systems. Ripple is doing precisely the opposite. Instead of trying to remove them, this technology is trying to cooperate with them to make them better. Several products by Ripple Labs (XCurremt, XVia, and XRapid) are being used by several banks to perform transactions globally. The native cryptocurrency of the platform XRP plays an essential role in the system.

Let us see how the transactions are performed globally using Ripple technology. The currency which is being transacted is converted into XRP before the transaction. As the recipient receives the money, the user will have an option to convert the XRP into his/her desired currency. Thus, XRP plays a bridge between two different currencies in this case. The transaction fees for this transaction is as less as $0.00001. This transaction fee disappears from the network after the transaction is processed.

Market Capitalization 

Ripple’s XRP is in third place in terms of market capitalization amongst Cryptocurrencies. Currently, this crypto is trading at $0.295, while the total market cap is around 12 billion dollars. The 24-hour trading volume is $1,729,560,739. The maximum number of coins the XRP ever can have is 100,000,000,000, while 43,242,653,330 out of them are already in circulation (43.2%).

Pros and Cons of Ripple

We have already seen that many banks have trust in Ripple technology and started using this network. By using this technology, some world-renowned banks claim that they are potentially saving 70% of the transaction costs annually. Since all the coins are minted already, inflation i.e., the value of Ripple, remains stable over the period.

Ripple is highly centralized, unlike other cryptocurrencies. 61% of the coins minted are in control of the founders of the Ripple Labs. They decide when and how much of the coins are released. Hence centralization is the major con. In May 2018, Ripple was accused of alleged cheating through its ICO.

Conclusion

Since 2013, many traditional platforms that serve international transactions have adopted Ripple as an alternative remittance option to its customers. By December 2014, Ripple combined its services with Earhports payments systems, making it the first-ever partnership of Ripple with a giant payments network. Western Union, American Express, and Unicredit are some of the largest customers of this technology, making the technology achieve its goal closer every passing day.