Traders hoping to become successful at forex constantly strive to improve their trading skills and, even more so, the variety of indicators that they use in trading. While the list of indicators is difficult to number precisely, forex enthusiasts often look for indicators in the hope of acquiring specific information. Volume, one of such important aspects of the forex trading experience, does not only pose as a relevant but also necessary item of information that gives traders a green light to enter a trade. Although volume indicators are many and are generally assumed to be a crucial part of each trader’s algorithm, this variety leaves much room for equally varying degrees of success. Naturally, in connection with this topic, the question of whether we can use indicators such as the Depth of Market or the DOM indicator to obtain more information about the overall market activity and be ahead of the big banks comes along.
DOM Indicator
DOM is popularly described as a very potent indicator that has been promised to provide traders with the potential to stay on top of the competition, which explains the high search frequency for this topic on Google. While still part of the MT4, this tool is located outside the common list of indicators and can be accessed by pressing ALT+B or clicking right and scrolling down. With regard to its performance, simply put, this indicator gives traders insight into the price levels with the heaviest volume. All the information DOM presents traders with stems from the brokers’ data that understand exactly where the clients’ orders are at any given moment. However, while sharing this information with others, the question of whether this allows us to trade like the big banks, or in other words have equal power, still remains unanswered.

Any trader interested in accessing the information discussed above can easily discover a price level with an abnormal amount of volume with the help of DOM, which can indeed seem quite appealing to anyone aspiring to become a successful and affluent trader in the forex market. Nonetheless, issues arise once we become aware of the fact that any dealing desk broker’s information is limited to levels and does not stand for the overall volume. Therefore, if a trader is interested in gaining an understanding of the volume and how the market is going to respond to any strange concentration at any point in time, this indicator already seems to be falling behind its promised ability.
Whereas many traders use DOM to enter trades, as a simplified version of such tools, this indicator also fails to do everything else a trader should expect from a fully functioning indicator. If we take into consideration the facts that traders need indicators for three purposes – to tell them whether they should go long or short, to help them with money management, and to assess if there is sufficient volume, to begin with, it becomes apparent that DOM is far behind satisfying all criteria that any trader should hold on to while using indicators. What this further entails is that not only the indicator in question cannot perform well but that volume alone makes only one of many relevant data that makes us feel assured that we can proceed with the trade.
Trade Volume
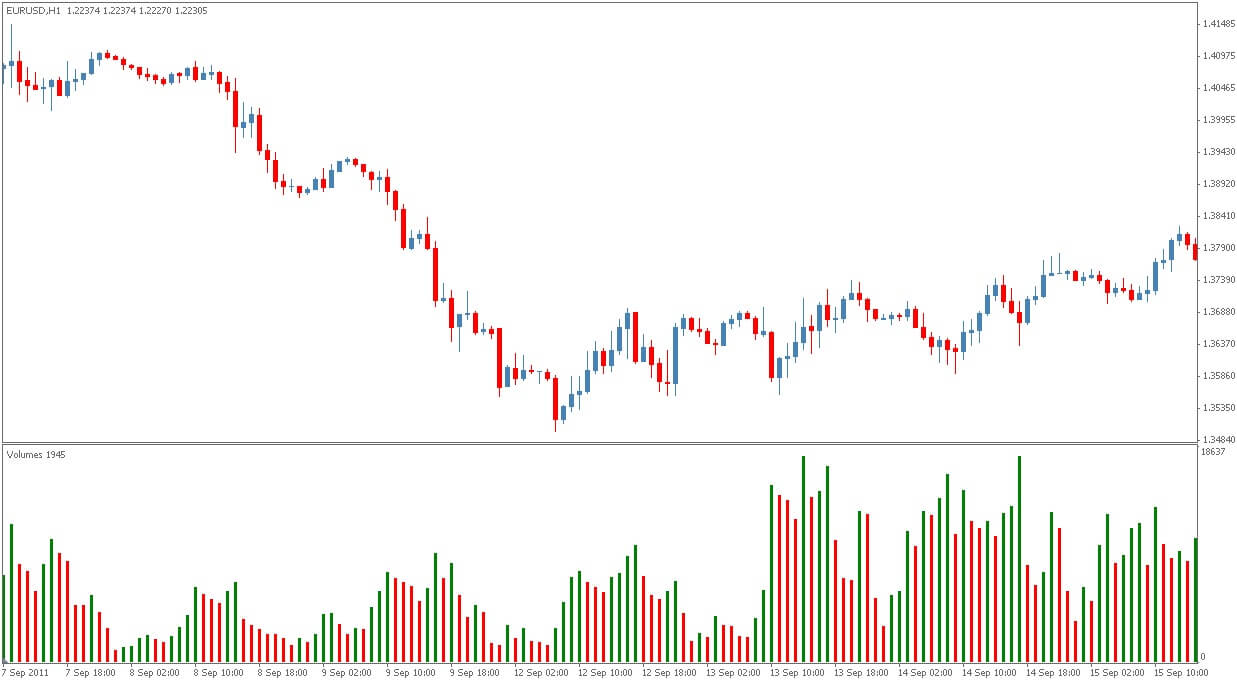
When one is looking into the volume at any point in time, he/she should also be aware of the fact that seeing the list of the prices is not indicative of the overall volume. For example, a dealing desk broker such as Oanda will even fail to do as much because the only item of knowledge one actually acquires, in this case, is the numbers, which are highly unreliable and insufficient for determining the direction of a price. Even if traders choose to use other indicators to access volume-related information, they in fact still never acquire the data on the long-term volume, which directly questions the sustainability of any given currency pair one may be interested in. Therefore, the only tool that can grant this type of information that goes beyond current values is an actual volume/ volatility indicator as DOM simply is not of much use in this respect.
In order to understand any given information concerning volume, traders need to learn how to read the numbers they are presented with. For example, should a trader see that the DOM indicator reveals a price that is several pips higher, he/she still cannot fully trust the indicator or what numbers it is giving. Such feeling originates from the fact that some of the crucial questions are still looking for an answer, as we do not truly know anything about the type of orders that comprise this volume, whether they are limit or stop orders, or if the majority is entering long or short trades at the time. The missing information is much required as qualitative support owing to the fact that numbers alone have no meaning unless we are able to interpret them meaningfully.
Long and Short Trades
Traders should also be invested in discovering the predominant percentage of long and short trades because it will help them determine the correlation between volume and the types of trades forex traders are typically entering at the time. In addition, only once they get hold of such information will they be able to tell if the big banks will react at all because the main requirement for their involvement is precisely the impact volume has on the above-mentioned percentage. Unfortunately, the DOM indicator is unable to provide the data required and traders will never be able to tell the quantity of long and short trades or the price level above or below either, which makes the use of this indicator increasingly futile.

Aside from understanding volume, its relevance in trading and the type of information traders need to possess so as to expect any success in forex, trading should generally not be intended to beat the traders’ greatest competition – the big banks. The reason for this remark lies in the understanding that the majority of traders attempt to do exactly what the big banks are doing and such an approach is exactly what makes so many traders lose most trades and accounts. The role of the big banks has always been clear and attempting to outsmart the one entity with more information than anyone else in the forex market possesses at any given time is a sure way to experience great losses. Hence, in order to beat the competition, you should learn how to use and interpret the information you come by rather than strive to be in the midst of the greatest concentration of activity in the chart.
Understanding Market Activity
The focus on the numbers has, as we explained above, never been the best of allies simply because we do not really understand the activity even when we can see that the concentration is extremely high. There is a number of indicators that can provide the same types of information, yet they lack the key ingredient to really be of any use. Interestingly enough, much of such data actually reflects past activity, which can only confuse you and blur your vision with regard to future activity. Therefore, the ability to see heavy trading does not reflect true volume nor does it indicate any future development. The sole reliance on indicators in the hope of them fulfilling all our intentions, goals, and needs is not going to lead to sustainable success and the same can be said about the reliance on volume alone.
In order to achieve the expertise of not falling in the majority group, both in terms of the concentration in the chart and the number of people losing, traders must learn to take the road less traveled and attempt to take a different approach. As the use of one indicator alone, focus on one aspect such as volume, reliance on numbers alone, and hope to outsmart the big banks all seem to be inadequate, traders can turn to some other highly effective activities that have a much greater chance of helping them succeed long-term. The intention to grow and ensure sustainable development by far outperforms any quick fixes the majority of traders are interested in, which is why indicators such as DOM are so often used and why so many traders keep making the same mistakes.
Instead of putting all of your eggs in one basket, strive to dive deep into the psychology of trading, understanding why you keep experiencing losses and invest in money management so that you are a stable and balanced trader first and foremost, and the success will follow. Traders commonly assume that their careers should reach a peak the moment they come up with an algorithm, but the reason they still fail lies in the lack of understanding that some criteria are far more important than using the right tools.
Challenging Traditional Beliefs
Another important piece of information regarding the volume is that traders always believe that the higher the volume, the greater the success. Nonetheless, low volume, which is a usual part of the natural oscillations in the forex market, can allow traders to learn about the nature of the market and invest in testing their systems. Human beings can get extremely greedy, but forex requires a different perspective from its participants who are intent on reaching the expert level. In that respect, the greatest goal is not only to gain wins but also to mitigate losses and the same broad perspective can allow traders to see outside the narrow world of perfect tools and quick solutions.
And, finally, to return to the title of this article Is Volume Enough to beat the Big Banks?, traders should by now see through this the ideology and beliefs forming the basis of this question. Neither volume nor a volume indicator can be said to be the sole savior in the battle, especially when the battle is similar to that of Don Quixote. What you as an aspiring forex trader can do is learn to interpret the numbers you obtain and work on yourself as an individual, and any desired success will surely stem from these fruitful and sustainable decisions.