Then we will answer the following questions: Why is the volume of transactions in the stock market so important? What are the basic concepts of volume analysis? What exactly is volume analysis? What is behind this analysis? Why do professional operators pay so much attention to the volume of trading and what is the benefit of their analysis?
The Path to Volume Analysis
The first steps of newcomers to the stock market usually consist of: opening a demo account, or with real money, on a broker and downloading a platform like Metatrader. A posteriori begins the great experience of using the strategies and the search for the Holy Grail.
Beginners often fail because they trust the advertising promises of brokers, as they expect to make big profits and quickly. Of course, these expectations are disappointing for most beginners. Efforts to recover increasing losses by increasing positions will only result in a complete sweep of your accounts.
Therefore, many newcomers leave trading without money and frustrated soon after starting their trading careers. After all, only the youngest, most motivated, and persistent traders try to find a sensible way to succeed on the stock exchange, which often leads to volume analysis.
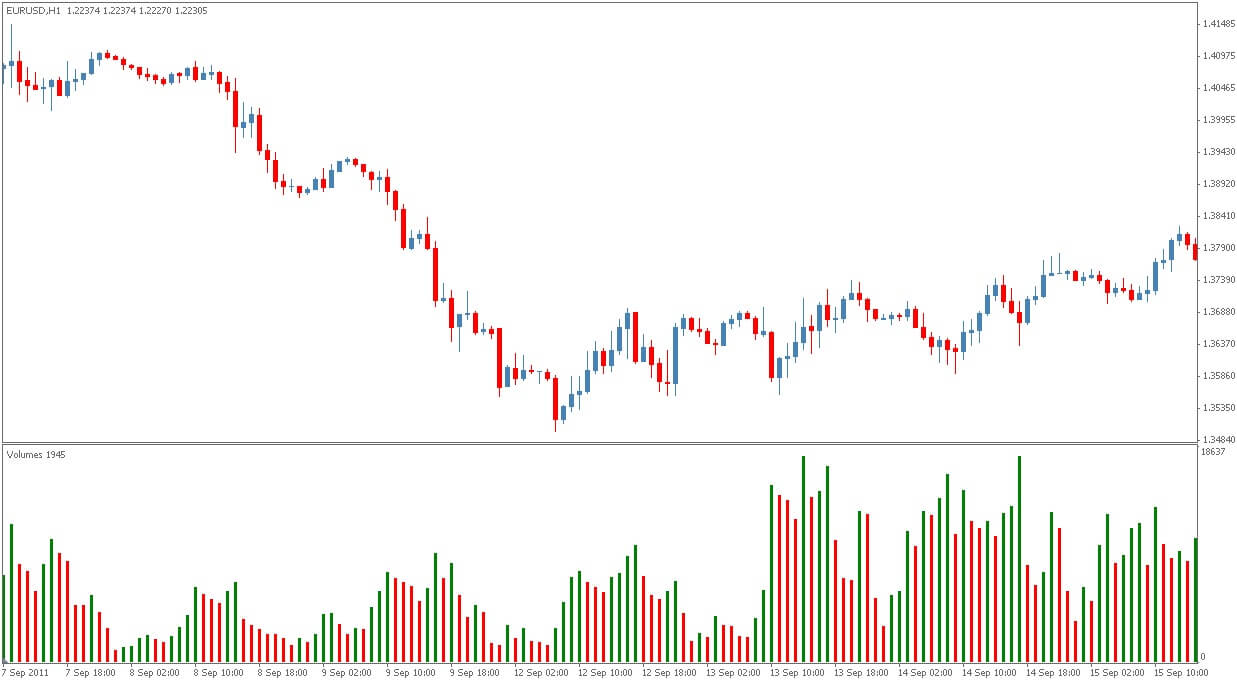
What makes the volume indicator different?
The relationship between supply (in red) and demand (in blue) is the basis of trading. The intersection of both curves shows a fair price. The absolute majority of technical analysis indicators (moving averages, MACD, stochastics, RSI, Bollinger bands, and many more) are calculated on the basis of historical prices.
The volume indicator, on the other hand, works differently: the special feature of the volume is that it leaves the price out of the calculation. The volumes do not pass through formulas but are delivered directly: in tics (each tic corresponds to an executed operation), in absolute terms (a series of executed operations), or in money (sum of the costs of executed operations).
The first type of volume, the volume in tic is mainly known by Metatrader users. Volumes in absolute and financial terms are real volumes of transactions provided by official markets in real-time.
In principle, this volume in tics could already be used for the analysis of transactions, since both tics and actual volumes show market activity. However, the use of real volumes offers a more precise analysis, especially if we examine the volume and break it down into groups of purchase and sale prices. Only the movements of the progressive volumes provide this “X-ray view”.
Indicators of Progressive Volume
Thanks to the growing computing capacity available on the market and accessible to the general public, everyone is able to perform professional volume analysis using specialised platforms.
- Analysis of the volume and interaction of supply and demand.
- Demand and supply continue to play a very important role in volume analysis.
- Developing strong trading ideas.
Analysis of the volume of negotiation provides the most likely answers to the following questions:
- Why did the price increase (decrease) and the volume increase (decrease)?
- How much did the volume increase (decrease) while the price went up (decrease)?
- Why did you increase the volume while the price didn’t move?
- How has the delta changed (the difference between buying and selling)?
- How did the price behave when there was an abnormal volume?
- What happened after that abnormal volume happened?
Therefore, each trader can form his own opinion on the change that is taking place between supply and demand by analysing the correlations between volume and price. Therefore, it is able to understand in real-time the dynamics between buyers and sellers directly from the graph.
In this way, solid trading ideas are developed. If, for example, the price slowly increases to the level of resistance, as the volume drops, the force of purchases is exhausted. There is a demand deficit which creates a sales signal, as the current price is likely to be higher than the fair price.
On the contrary, if the price falls slowly to the support level with a decreasing volume, the sales pressure disappears, which means that there is a supply deficit and therefore a clear signal of purchase since the current price is probably lower than the right price. But it is also possible that the price will refuse to go up despite a large volume of purchases. This means that, if there is a large company that sells assets using limited sales orders, on this occasion we have before us a clear signal of sale.
This is where we come to the issue of market rationality. Proponents of this theory believe that the current price is always fair and that the market automatically takes into account all the factors that may influence the price. However, market prices are formed in people’s minds, and people make mistakes.
Therefore, when you study the charts of prices and volumes you will find that the price at the ends is far from always fair. Unusual volume spikes in the market are often accompanied by media activities. At such times, the current price is likely to deviate from fair value. For example, Bitcoin reached a peak of purchases in December 2017 when prices were quoted at $20,000, and in late June 2019 when prices hovered around $13,000.
Advantages of Volume Analysis
Volume analysis does not require consideration of key factors, expert forecasts, and other additional sources. All the necessary information: time, price, and volume, is already included. This is the great advantage of volume analysis: from it, we can draw conclusions about the forces of supply and demand while providing us with all the necessary information in an appropriate way for analysis. It is not important what are the reasons for the buyers and sellers are: if they come from an intersection of moving averages, a deficit in demand in the area of oversold, a tweet from Donald Trump, or an unexpected accident.
If a graphics reader correctly interprets the interaction of price and volume on time, it will acquire the ability to trade online with stronger traders and make mistakes less frequently. The major experts will have already carried out their fundamental analysis and conducted their negotiation in the market (which can be followed in their volume chart) which will reveal their true intentions. Let’s see how the following example shows using the price and volume chart.
Example:
We mentioned above the high point of the purchase of Bitcoin at the end of June 2019. To analyze the volume of trading during this period, we must look at the footprint of the Bitmex markets over a period of 1 day.
The peak of purchases on June 26, which, as we all remember, was accompanied by an avalanche of positive news in the major media, shows a particularly high buying activity when the level of $12,500 was reached. The question then is: if these green groups show real buying power, why did the price of Bitcoin fall so low over the next few days?
On July 10, the level of 12,500 was tested. In fact, there are green “buying groups” (traces of activation of loss limits), but the main body of the sail is made up of red groups, which illustrate the pressure of sellers.
After comparing these facts in the price and volume charts, it seems that the market is not interested in moving forward so then we should expect a downward movement. Traders could then benefit from a good entry point with the help of Smart DOM or Smart Tape data.
Conclusion
Analyzing graphs based on price, volume and the changing relationship between supply and demand is a good way to interpret market sentiment. Without volume in the graph, it is impossible to analyse supply and demand.
A price chart without volume is like a bike without wheels: you can’t move forward. And this is what we have made absolutely clear in this article: only with volume analysis is it possible to have long-term success in trading!