Introduction
The Gartley is one of the most traded harmonic patterns in the market. Just like the AB=CD pattern that we discussed in the previous course lesson, the identification and confirmation of the Gartley pattern are based on the Fibonacci levels. Technical traders use this pattern to trade the retracement and continuation that occurs when the trend temporarily reverses before continuing to move in its original direction. This pattern is also referred to as a Gartley222 because the inventor of this pattern, H.M Gartley, first described this pattern on page number 222 in his famous book ‘Profits in The Stock Market.’

Moves Involved In The Formation Of Gartley Pattern
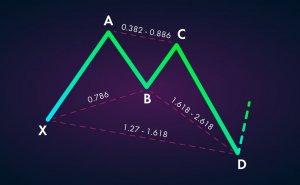
X-A – In the bullish version, the first leg forms when the price rises sharply from point X to point A.
A-B – The AB leg changes its direction and retraces to Fib level 61.8% of the XA leg.
B-C – In the BC leg, price action changes its direction and retraces from 38.2% to 88.6% of the distance that is covered by the AB leg.
C-D – This is the last leg of the pattern, and it reverses again to the downside. It must retrace to 78.6% of the XA leg.
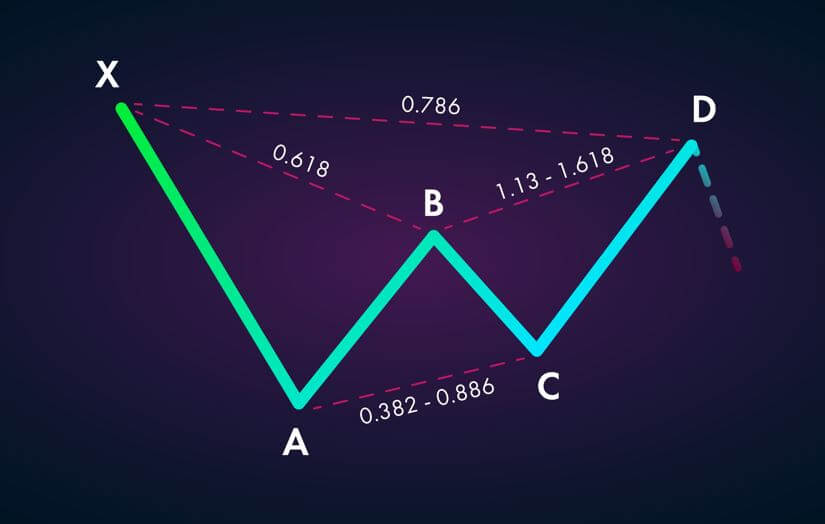
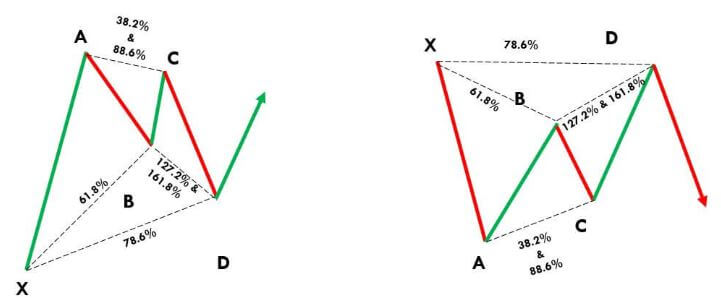
Below is how the fully formed Bullish and Bearish Gartley Patterns look like:
Trading The Gartley Pattern
Bullish Gartley Pattern
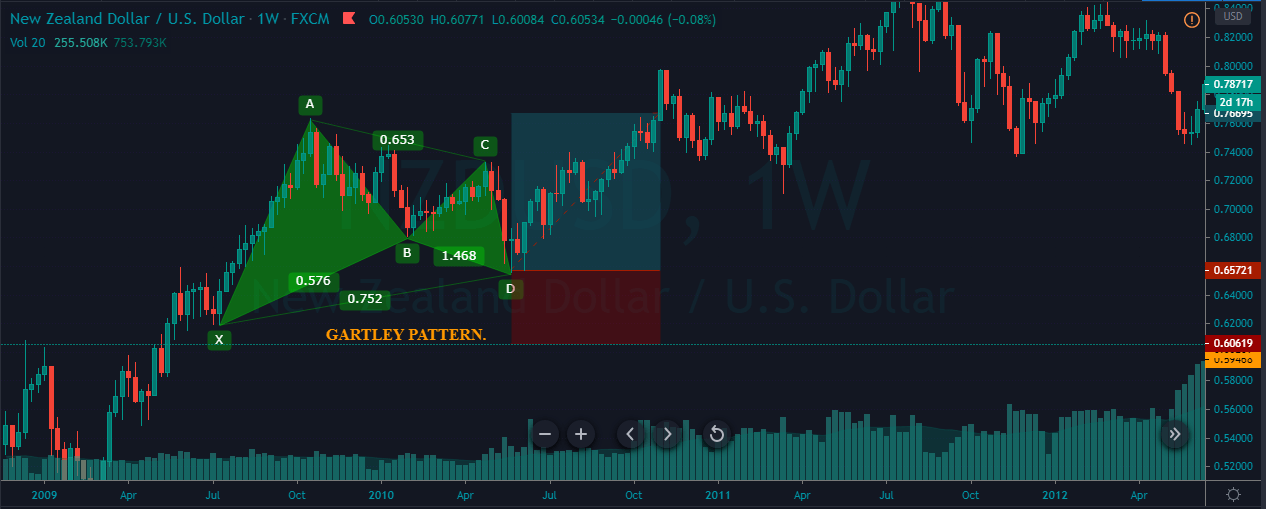
The chart below represents the formation of a bullish Gartley pattern on the NZD/USD weekly chart.
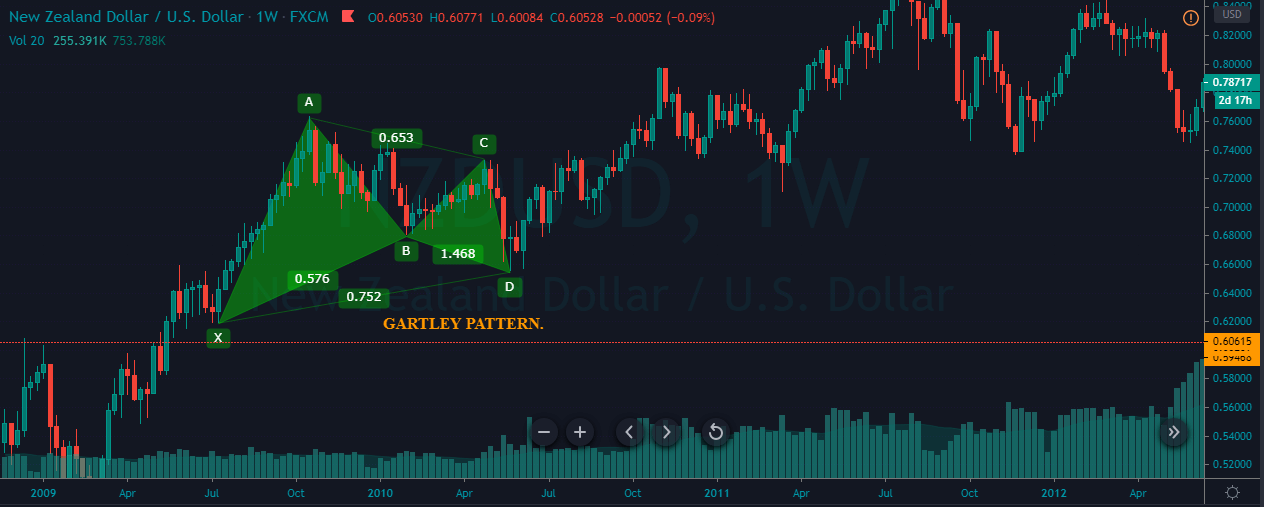
In the below chart, the four swing highs and swing lows bind together to form the bullish Gartly pattern. It is crucial to validate the fibs ratios on the price chart. The first XA leg was the bullish move, and the successive AB leg was a bearish move. We can see that the AB move was close to the 61.8% level of the AB leg.
Furthermore, BC is a bullish move, and it is retracing close to the 88.6% fib level of the AB move. The last step was the CD leg, and if this one goes wrong, the whole pattern gets invalidated. However, the CD move was bearish, and it is close to the 161.8% fibs level of the BC leg. The trade activation was at point D, and we have placed the take profit order at Point A.
Bearish Gartley Pattern
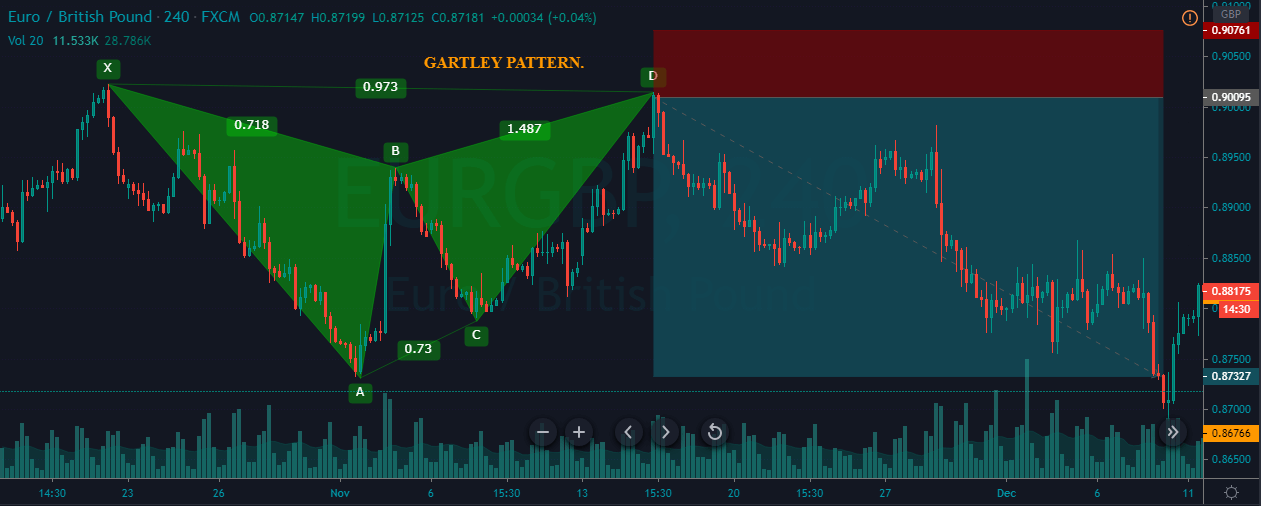
The price chart below represents the formation of a bearish Gartley pattern on the EUR/USD 240 Forex pair.
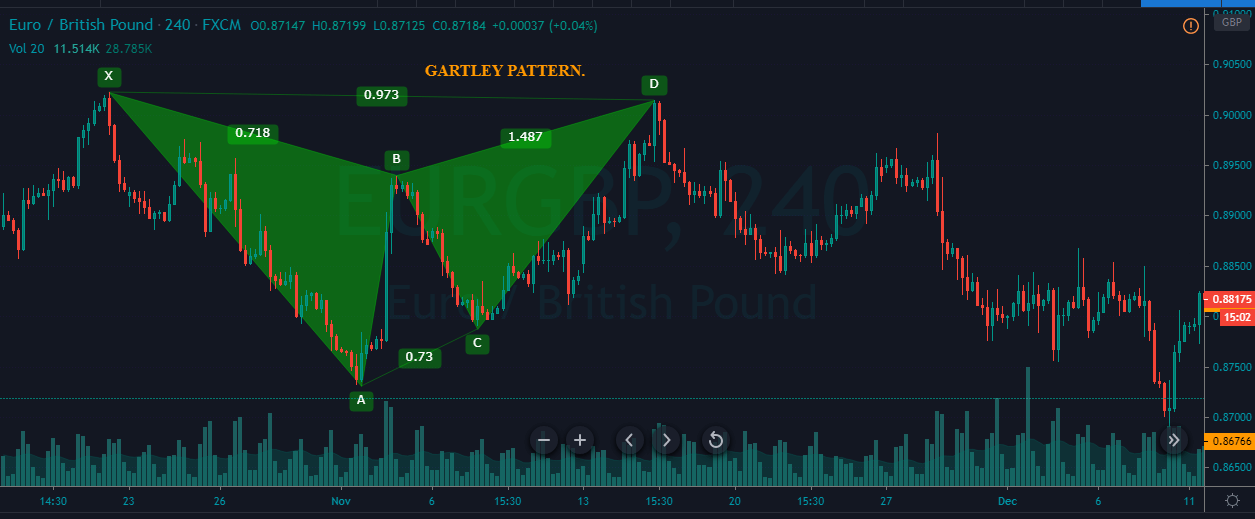
We can observe that the first leg of this pattern was XA, which is a bearish move. It is followed by the reverse in trend printing the AB leg, which is close to the 61.8% extension of the XA leg. The third leg, BC move, was bearish again, and it is close to the 88.6% fibs of the AB move. The last leg is the CD move, and this leg is 161.8% fibs ratios of the BC. The activation was at Point D, and the stop-loss is placed above point D. For take-profit, we have gone for the Point A. You can also partially book your profit at point C and exit your positions at point A.
Conclusion
The confirmation of the Gartley pattern must be done using the fib ratios alone. In the beginning, it can be difficult for you to spot this pattern on the price chart, but you will eventually get used to it. Hence, in the beginning, try to identify & trade this pattern on a demo account. Once you master all the rules involved while trading this pattern, you can go ahead and trade it on the live markets. Cheers! [wp_quiz id=”76837″]