
Advanced learning on technical Analysis – trading with technical confluence
As a financial trader in the forex market, we are looking for evidence that underpins our trading decisions and ensures our decision making is correct and that, therefore, the tools we use are stacking the odds in our favour. When these technical tools are aligned, this is called technical confluence. This is where price action and technical indicators converge and help us to make informed decisions. The clearer the indication pointing to directional movements, the better idea we will have to trade-off of our technical analysis charts.
Technical confluence is when we have at least two technical elements on the same chart. And because we are not gamblers, traders look for confluence to strengthen the case before making trading decisions. However, different traders look at different technical signals over different time frames. And this is why trading is inherently risky. But the good news is that all traders are looking at the same price movement and assimilating the same economic data, and therefore, all that we can do is take this into consideration and look for the best high probability setup we can achieve.
Let’s look at some technical confluence trading opportunities.
Example A
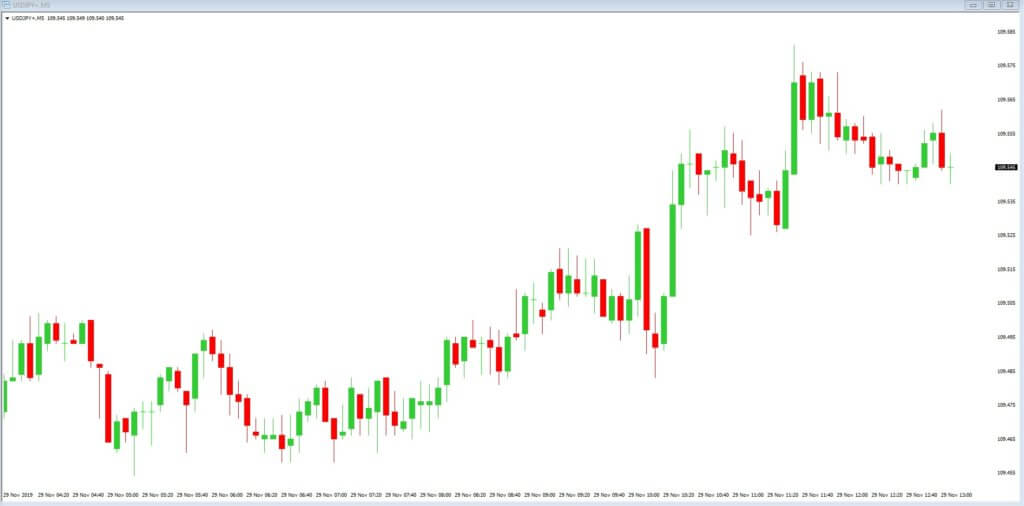
Example A is a 5-minute time frame chart of the USDJPY pair, with price action as denoted by Japanese candlesticks. It looks like initially, the market was trading sideways and then took on a bullish momentum around the middle of our chart. Let’s try and identify if technical indicators foresaw the push higher.
Example B
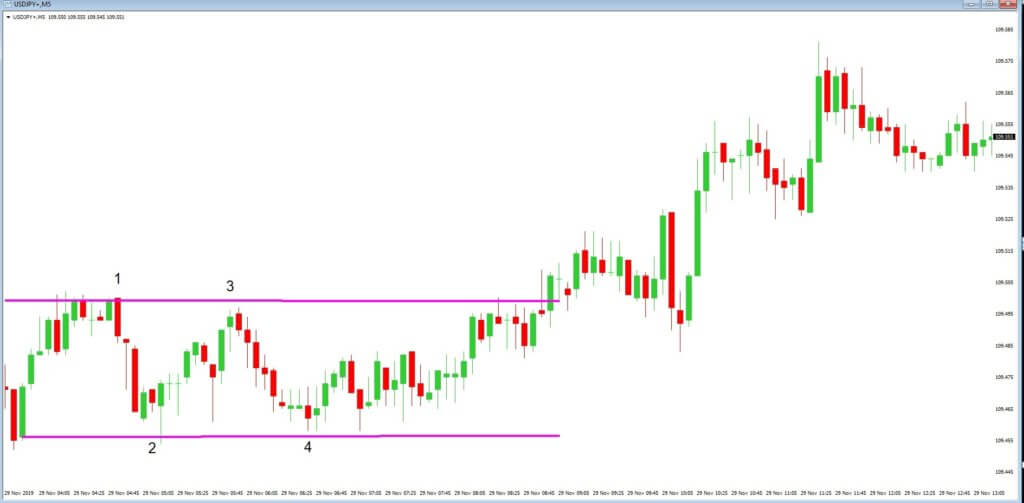
In example B, we have drawn a line of resistance and a line of support which confirms consolidation or sideways trading, and this is confirmed by at least two attempts to push through these areas in both directions.
Example C
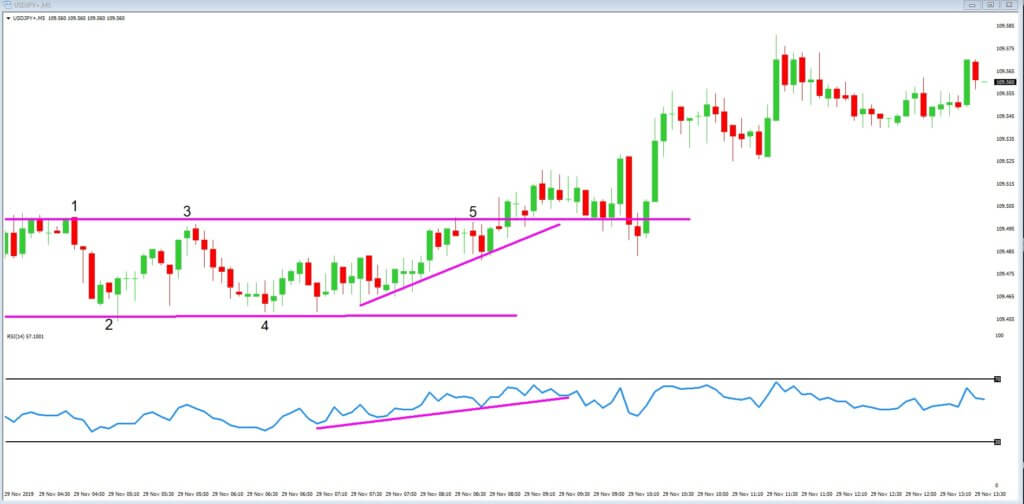
In example C, we have added a relative strength index (RSI) which is a technical indicator used in the analysis of the historical strength or weakness of a currency pair based on the opening and closing prices over a set amount of candlestick, in this case 14, and is defined as being weak when it hits the 30 line and strong when it reaches the 70 line. Price often reverses or pulls back from these key levels.
Our RSI initially touches the 30-line at the extreme left of our chart and then begins a slow ascent. At position 5 our RSI is showing most of its momentum to the upside, and price action is also maintaining its momentum to the upside and towards our area of resistance. Price action continues upwards and punches through the area of resistance, and this then becomes an area of support. Price action continues in a bullish tone from this point. This was a trade opportunity and was confirmed by price action and the RSI, plus our support and resistance lines. Therefore, this area of confluence presented a bullish trade signal to buy at position 5 with a stop loss just below our original support line.
Example D
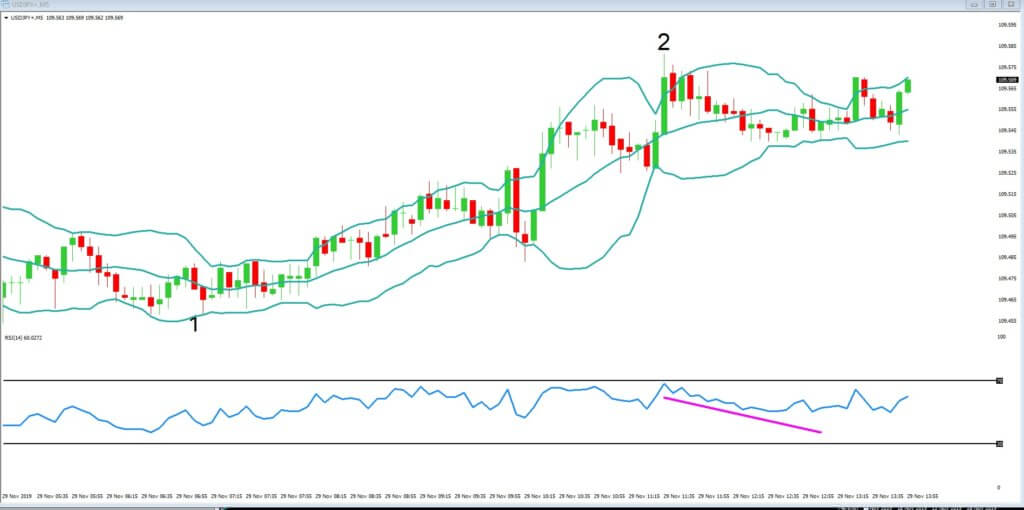
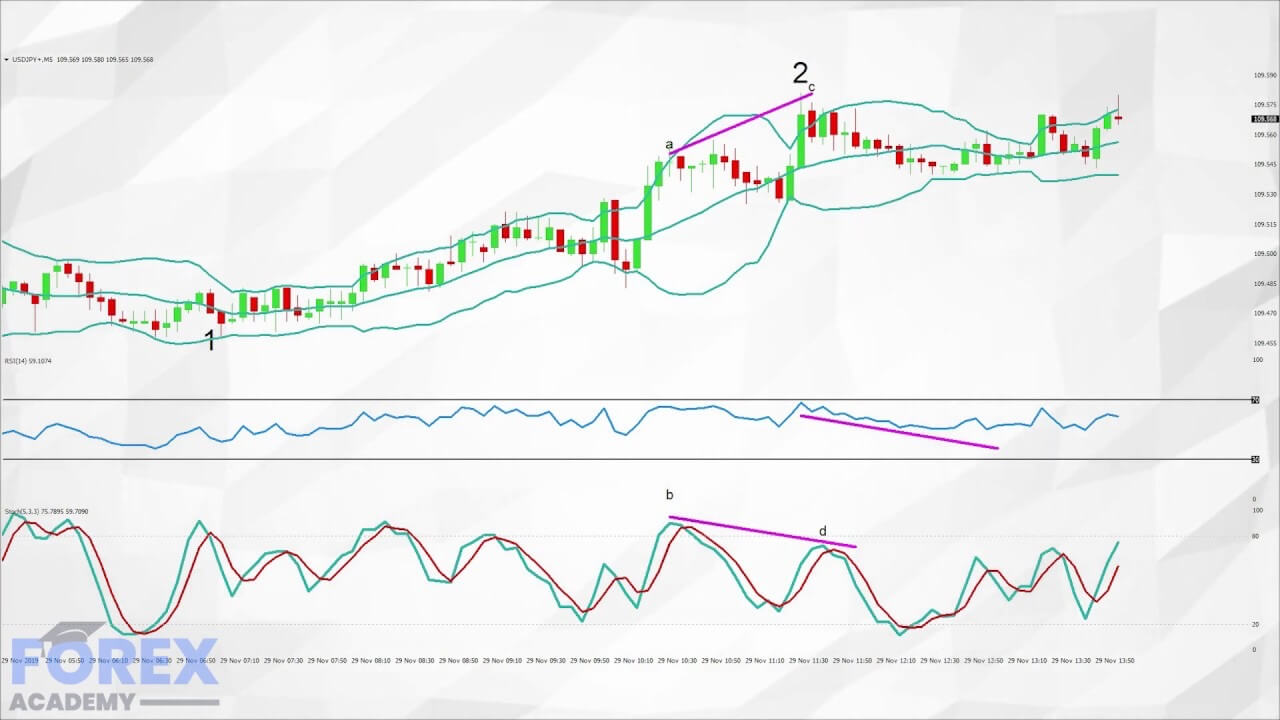
In example D, we have now identified the low of the move at point 1 and the high of the move at point 2. The area at point 2 would suggest to our earlier buyers that price action might be topping out here and for two technical reasons: Firstly our RSI almost touches the 70-line, and also our candlesticks have pierced the Bollinger bands, which we just added, and where we know that if this happens there is a 90% chance that price action will revert back inside the bands. Price action does level off to a certain extent before pulling back lower, and this is highlighted by our descending RSI line.
Example E
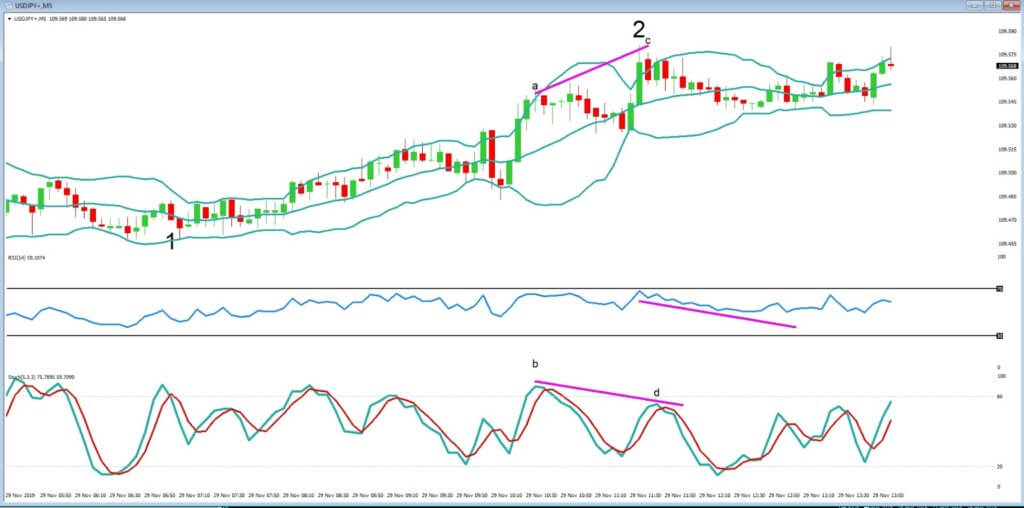
We also identified that price action is fading to the upside on this chart by introducing the stochastic oscillator, as in example E. We can see that while price action momentum continues upwards from point A to point C, the stochastic is overbought at point B and at point D it fails to reflect the high of the price action at point C, and this shows divergence, and where divergence tells us the market is slowing.
Possibly traders began to sell the pair at point A, being seen as overbought and that the subsequent price action began to lose momentum as volume begins to dry up from the bulls.
This is another good example of confluence where at least two technical indicators are working together stack the odds in our favour. It also helps us to identify areas where other traders began to close down or exit their previous buying trades in fear of a reversal in price action. And so it is wise to consider where other traders may be bailing out of their trades and that therefore this presents options to close trades and look for reversal setups.
Topping out here and for two technical reasons: Firstly our RSI almost touches the 70-line, and also our candlesticks have pierced the Bollinger bands, which we just added, and where we know that if this happens, there is a 90% chance that price action will revert back inside the bands. Price action does level off to a certain extent before pulling back lower, and this is highlighted by our descending RSI line.