
In today’s article, we are going to demonstrate an example of a failed entry on the daily chart. In a bullish market, the chart produces a bearish inside bar followed by a perfect looking bullish engulfing candle closing well above the level of resistance. However, the price heads towards the South and hits the stop loss. We try to find out what goes wrong here.
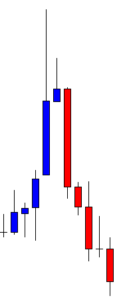
The chart shows that the price heads towards the South with strong bearish momentum. The sellers are having a feast here. Any intraday breakout at the lowest low of the last daily candle may get the traders to go short on the respective chart. Let us proceed with what happens next.

The last daily candle comes out as a bullish inside bar. Intraday buyers may search for a long entry on any breakout at the highest high of the last daily candle. On the other hand, the daily chart traders are to wait for the next day’s candle to close as a bearish engulfing candle.
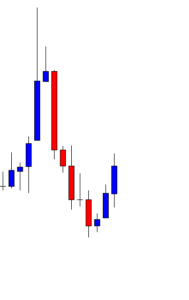
The price heads towards the North with good bullish momentum. The chart produces two more bullish candles after that inside bar bullish candle. The chart looks good for the buyers on the daily chart as well. If the chart produces a bearish reversal candle followed by a bullish engulfing candle closing above the level of resistance, the buyers may go long on the daily chart.
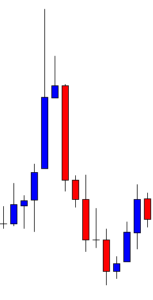
The chart produces an inside bar. This must excite the buyers. If the next candle comes out as a bullish engulfing candle closing above the resistance of this bullish wave, the buyers may trigger a long entry.
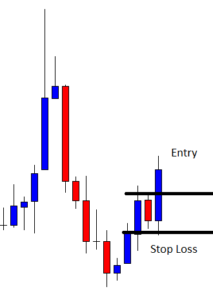
Here it comes. This is what the buyers wait for. They may trigger a long entry right after the candle closes by setting stop loss below the candle’s lowest low. The significant level of resistance is far enough, which offers them a tremendous risk-reward. Moreover, this is the daily chart, which is one of the most consistent charts in the Forex market. In a word, this is a good trade setup for the buyers.
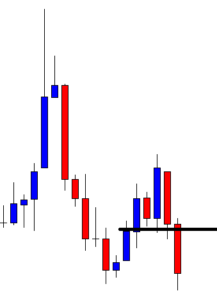
The price hits the stop loss the next day. The daily candle one after it comes out as a bearish candle too. The chart looked extremely good for the buyers two days ago. Now things are very different. If we dig into it, we do not find anything particular that the chart misses to produce such bearish candles all of a sudden. Technically, there is nothing wrong with the entry. We must remember this is how the market goes. It happens a lot. We must learn how to absorb such an unpleasant incident.