
In today’s lesson, we are going to demonstrate an example of an entry derived from the daily-H4 combination. Usually, the daily-H4 combination does not take that long to offer an entry once the price makes a breakout on the daily chart. In today’s example, things are a bit different. Let us find out how it starts and ends.

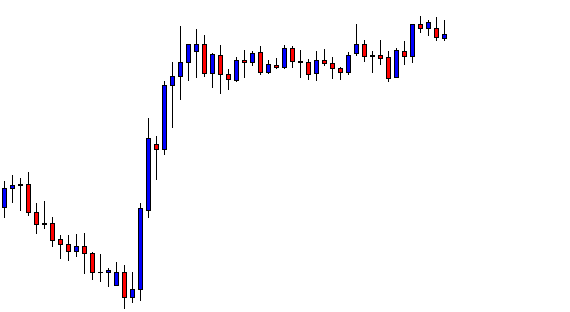
The figure above shoes the daily chart. After a strong bullish impulse, the price action gets choppy for several days. Do you notice anything here?
The price gets caught within a rectangle. Since it has been choppy for quite a while, it makes some traders think not to keep the pair on their watch list.
There is a saying in price action trading “the more it ranges, the harder it breaks’. Thus, the next breakout may be a very strong one.
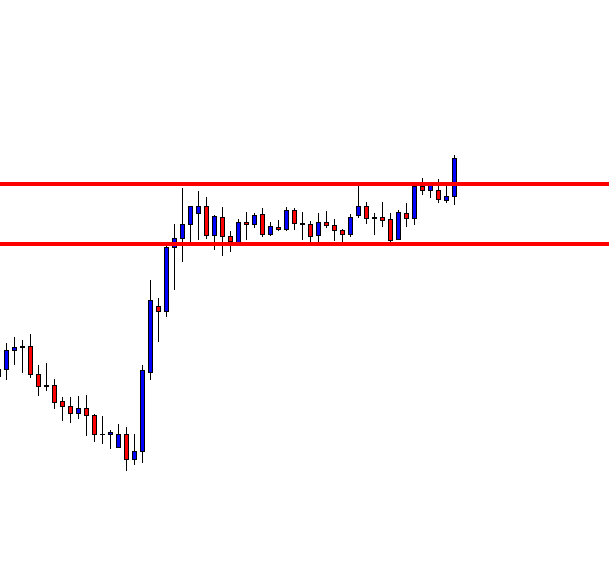
The breakout candle looks good. However, it is not that strong a breakout as we have expected. Nevertheless, it is a valid daily breakout, so traders are to flip over to the H4 chart to take a long entry.

The figure above shows the H4 chart. The price has been heading towards the North with an average bullish momentum. Traders are to wait for the price to find its support and make an upside breakout to offer them a long entry.
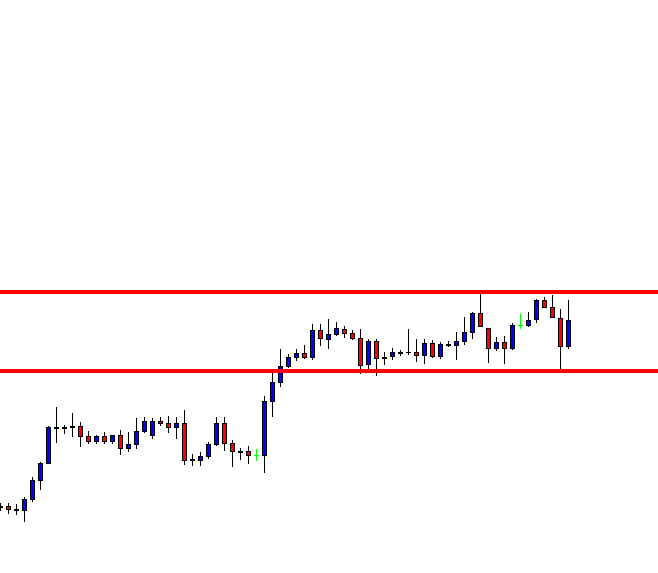
The price keeps being choppy on the H4 chart as well. It neither has consolidated nor produced a bullish reversal candle on which buyers could take a long entry. It has instead been within another bullish rectangle. This time it is, of course, an H4 bullish rectangle. Let us proceed to find out which way it makes its next breakout.
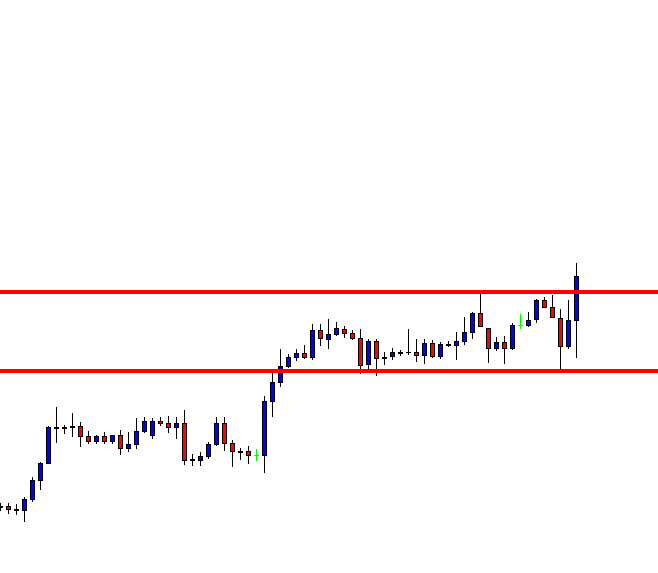
The price makes an upside breakout again. A bullish engulfing candle with long lower shadow makes the breakout. The buyers have been waiting for it, so a long entry may be triggered right after the candle closes. The Stop Loss shall be set below the rectangle support. There is no visible swing high. This suggests that the profit taking should be managed manually.
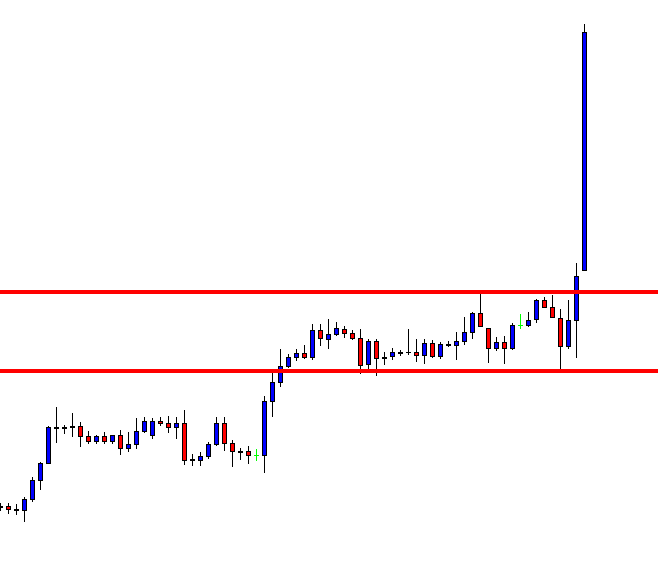
The plan has worked wonderfully well. The price goes straightway towards the North with extreme bullish momentum. The buyers may trail their Stop Loss in the middle of the big candle or at least above the breakeven point. As it has been going, it may keep pushing towards the North further. Let us find out what happens next.
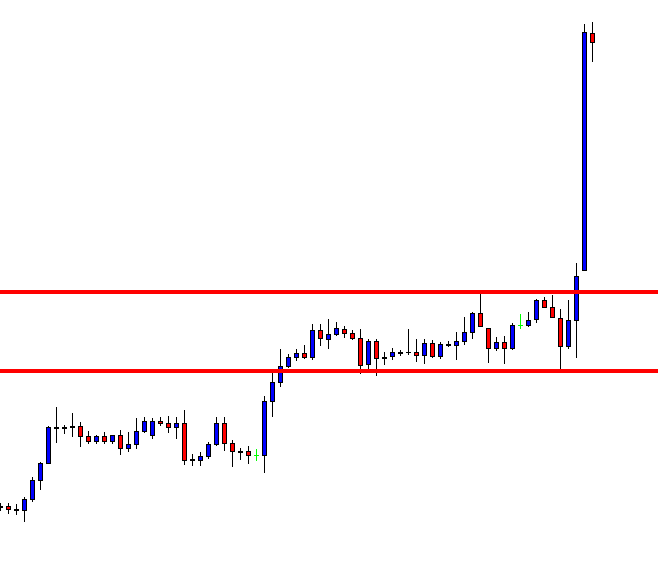
The chart produces a bearish reversal candle. It is an Inside Bar, but it is time for the buyers to close the entry.
The price takes so long to make a breakout on the daily chart. It also takes a long time to offer entry on the H4 chart as well. This situation does not happen frequently, but sometimes it may occur. Thus, traders are to be mentally prepared for it.