In today’s lesson, we are going to demonstrate an example of a daily-H4 chart combination entry. The daily char produces a bearish engulfing candle at a significant level of resistance. It makes the daily-H4 chart combination traders flip over to the H4 chart to look for a potential entry. The H4 chart shows that the chart creates a double top. Simply, an ideal combination for the traders to go short on that chart. However, things do not go as smoothly as traders expect it to go in the Forex market. Let us find out what happens.

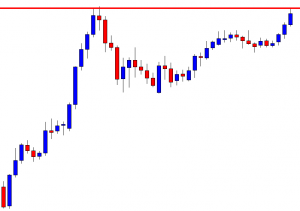
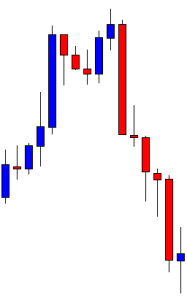
This is the daily chart. The chart shows that the price, after being bullish, has a rejection at the level of resistance marked with the red line. The price comes down and makes a bullish move again. If it makes a breakout, the buyers may push the price further up. On the other hand, sellers are to wait for the price to produce a bearish reversal candle to consider short opportunities. Let us find out what happens next.
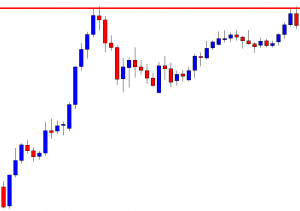
The chart produces a bearish engulfing candle. Since it shows in the daily chart, the combination traders may flip over to the H4 chart to look for a short opportunity. A double top resistance and a bearish engulfing candle suggest the sellers may jump in here to drive the price towards the South further.
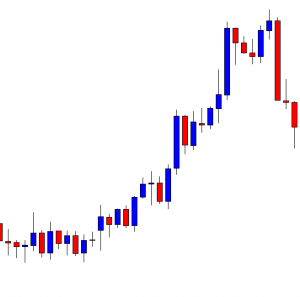
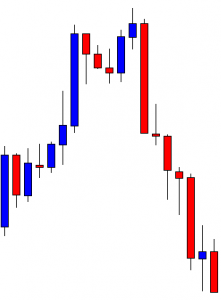
It is the H4 chart. The chart produces a double top and makes a breakout at the neckline. The combination traders are to wait for the price to consolidate and produce a bearish reversal candle to go short below consolidation support. The price consolidates here. However, considering consolidation length, it is better to skip such entry.
The price heads towards the South with extreme bearish pressure. It travels a long way to produce a bullish reversal candle. The sellers would love to get the reversal candle earlier though. Anyway, it is better late than never.
The chart produces a bearish engulfing candle closing well below consolidation support. The sellers may trigger a short entry right after the last candle closes by setting stop-loss above consolidation resistance with 1R.
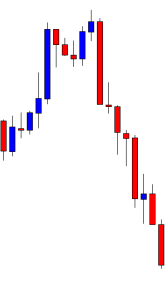
The price heads towards the South with good bearish momentum and hits the target. It seems that the price may travel towards the South further. The point to be noticed here is that the chart consolidates after traveling a long way. It would give a better reward if it consolidated and produced the signal candle earlier. It makes the sellers wait for more as well. In the end, the sellers make a profit out of it but think how hard they are to concentrate on it to make it work for them.Traders’ life is not as easy as some people may think.