Introduction
Moving averages are an important piece in analyzing the charts. Some traders simply use to determine the direction of the market, while others have solid trading strategies. The Bladerunner strategy is a powerful trading strategy based on the 20-period Exponential Moving Average (EMA). The best part about the strategy is that it can be applied to any time frame and currency pair. This strategy is given the term “Bladerunner” because the 20-period EMA cuts the price action like a blade.
What is the Bladerunner Forex Trading Strategy?
A market trading above the 20-period EMA indicates a bullish bias, while a bearish bias if it is trading below the 20-period EMA. If the price retests the EMA, traders look to long or short.
If the price is trading above the EMA, one can prepare to buy the currency pair once the drops and tests the EMA line and bounces back up. That said, if the market breaks below the 20-EMA, it can be comprehended as the market has switched directions – uptrend to a downtrend. Thus, traders can look for shorting opportunities.
On the flip side, if the price action is evidently below the EMA, traders may consider short selling the pair after the price retraces up to the EMA. However, if the market manages to break through the 20-EMA, it signifies that the buyers have taken charge of the market, and a potential reversal could happen. Thus, traders can catch the new trend after a proper test to the EMA line.
Criteria to trade the Bladerunner Strategy
Before taking an entry using the Bladerunner strategy, two criteria must be satisfied:
- Before entering based on the strategy, the price must breakout from a range or should already be in a strong trend.
- After the first criterion is satisfied, the price must successfully retest the 20-EMA. If the market is trading above the EMA, the test should be such that the price drops to the EMA, touches it, and reverses in the predominant trend. Finally, if the candle closes above the EMA, it is an indication that the uptrend is still active and intact. A similar concept applies to a downtrend as well.
These two points are vital to consider before attempting to trigger the order. Besides, traders who require more confirmation may trade those setups where the price bouncing off from the EMA is also a strong Support and Resistance level or a pivot point.
Trading the Bladerunner Forex Trading Strategy
The Bladerunner strategy can be traded in several ways, given the concept applied remains the same. Novice traders enter solely based on the EMA, while more professional traders combine this idea with their analysis and then execute their trade. Here are a couple of Bladerunner strategies designed for traders of all suites.
Buy Example
Below is the price chart of GBP/NZD on the Daily time frame with the 20-period EMA applied to it.
Reading the chart from left-most, it is observed that the market has been moving sideways in a range. During mid-May, the market finally broke above the top of the range. Also, the breakout happened such that the price was well above the 20-period EMA.
At the beginning of June, the market pulled back down to the EMA and left two tails at the bottom. This is an indication that the market is preparing to go north. Thus, a trader can go long as the holds for a couple of candles above the EMA.

Placements
Stop loss
The stop-loss must be placed few pips below the top of the range such that it is below the EMA as well.
Take Profit
There is no fixed take profit point for this strategy. However, the trade can be closed when the price drops below the 20-period EMA.
Sell Example
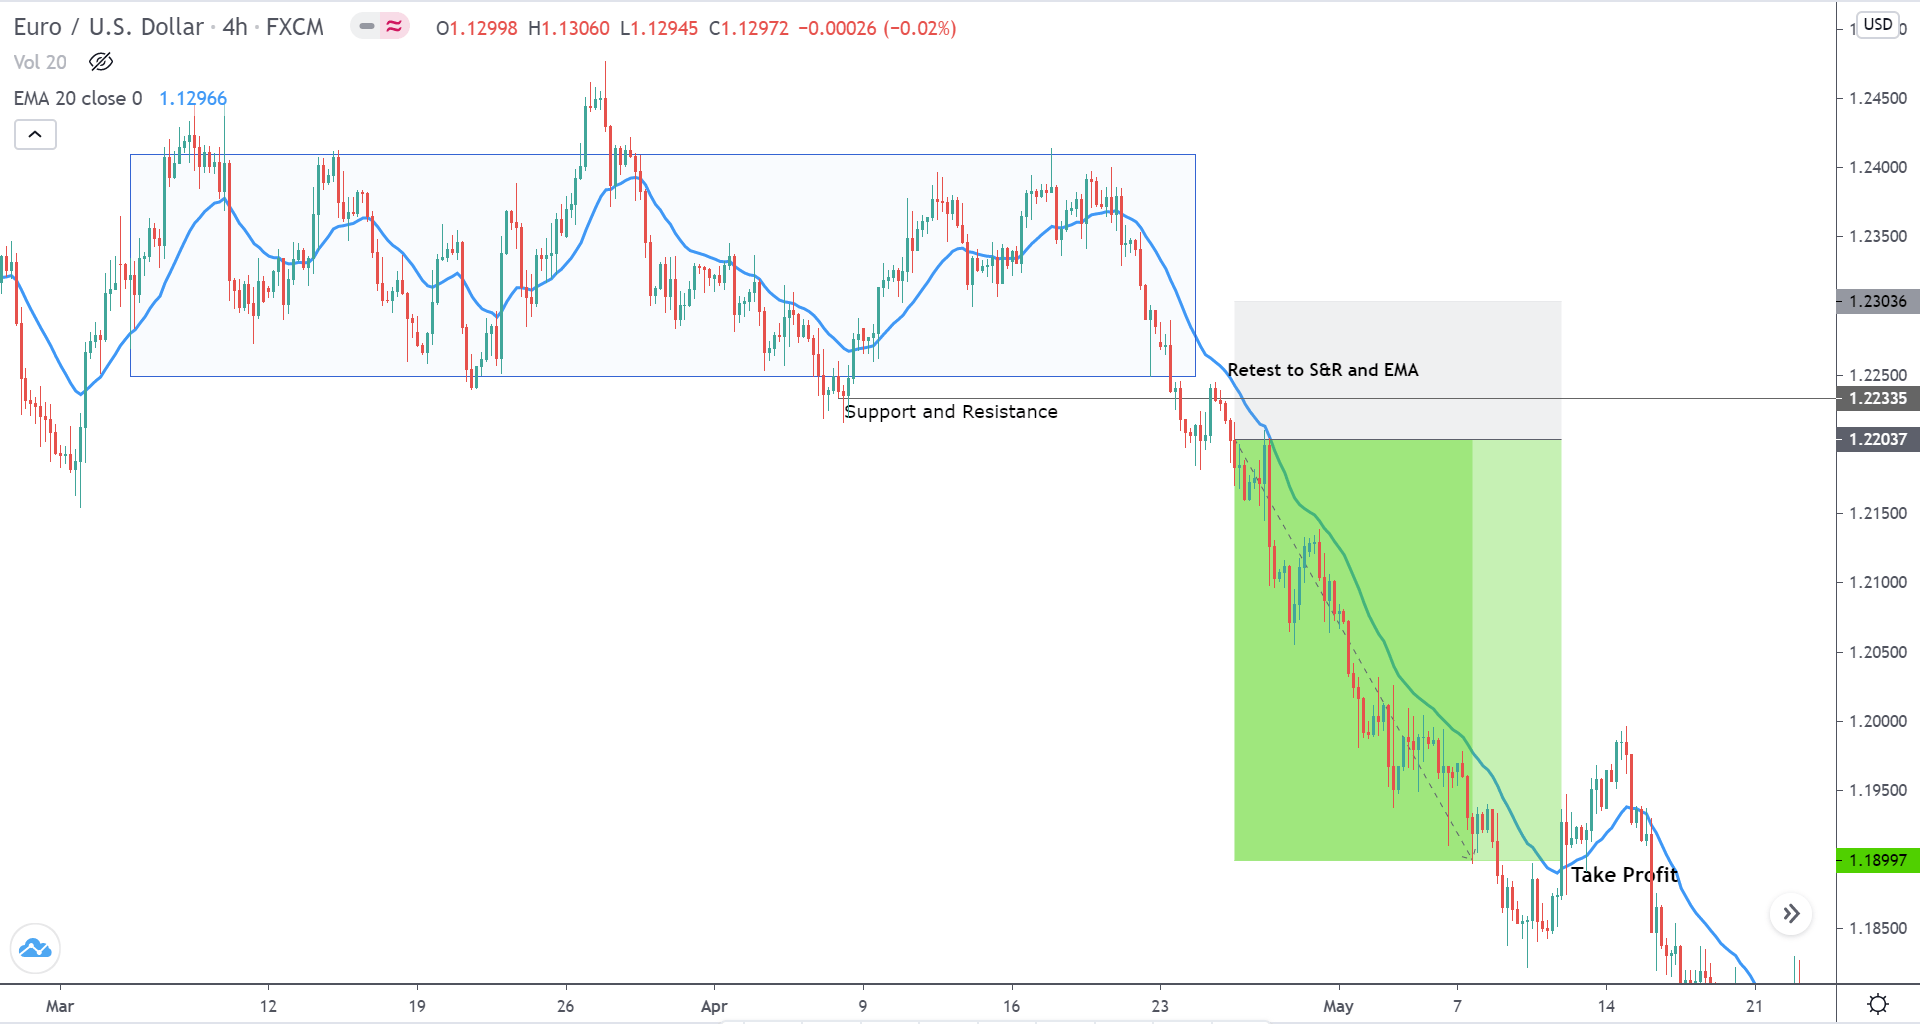
Below is the price chart of EUR/USD on the 4H time frame. Initially, the market was ranging, but later it was pushed down by the sellers. After the breakout, the price retraced and tested the EMA as well as the S&R. When the sellers pushed the market down yet again, it is an indication that the downtrend is going to continue. Thus, one can prepare to go short at these levels.
Placements
Stop loss
The stop loss can be placed safely above the Support and Resistance and the bottom of the range.
Take Profit
Since there is no reference to the left, there is no fixed take profit. However, traders must liquidate their positions once the market crosses above the 20-period EMA.
Bonus Example
Consider the below price chart of AUD/USD on the Daily timeframe. We see that the overall trend of the market is down. The level 0.68745 represents the most recent Support and Resistance area.
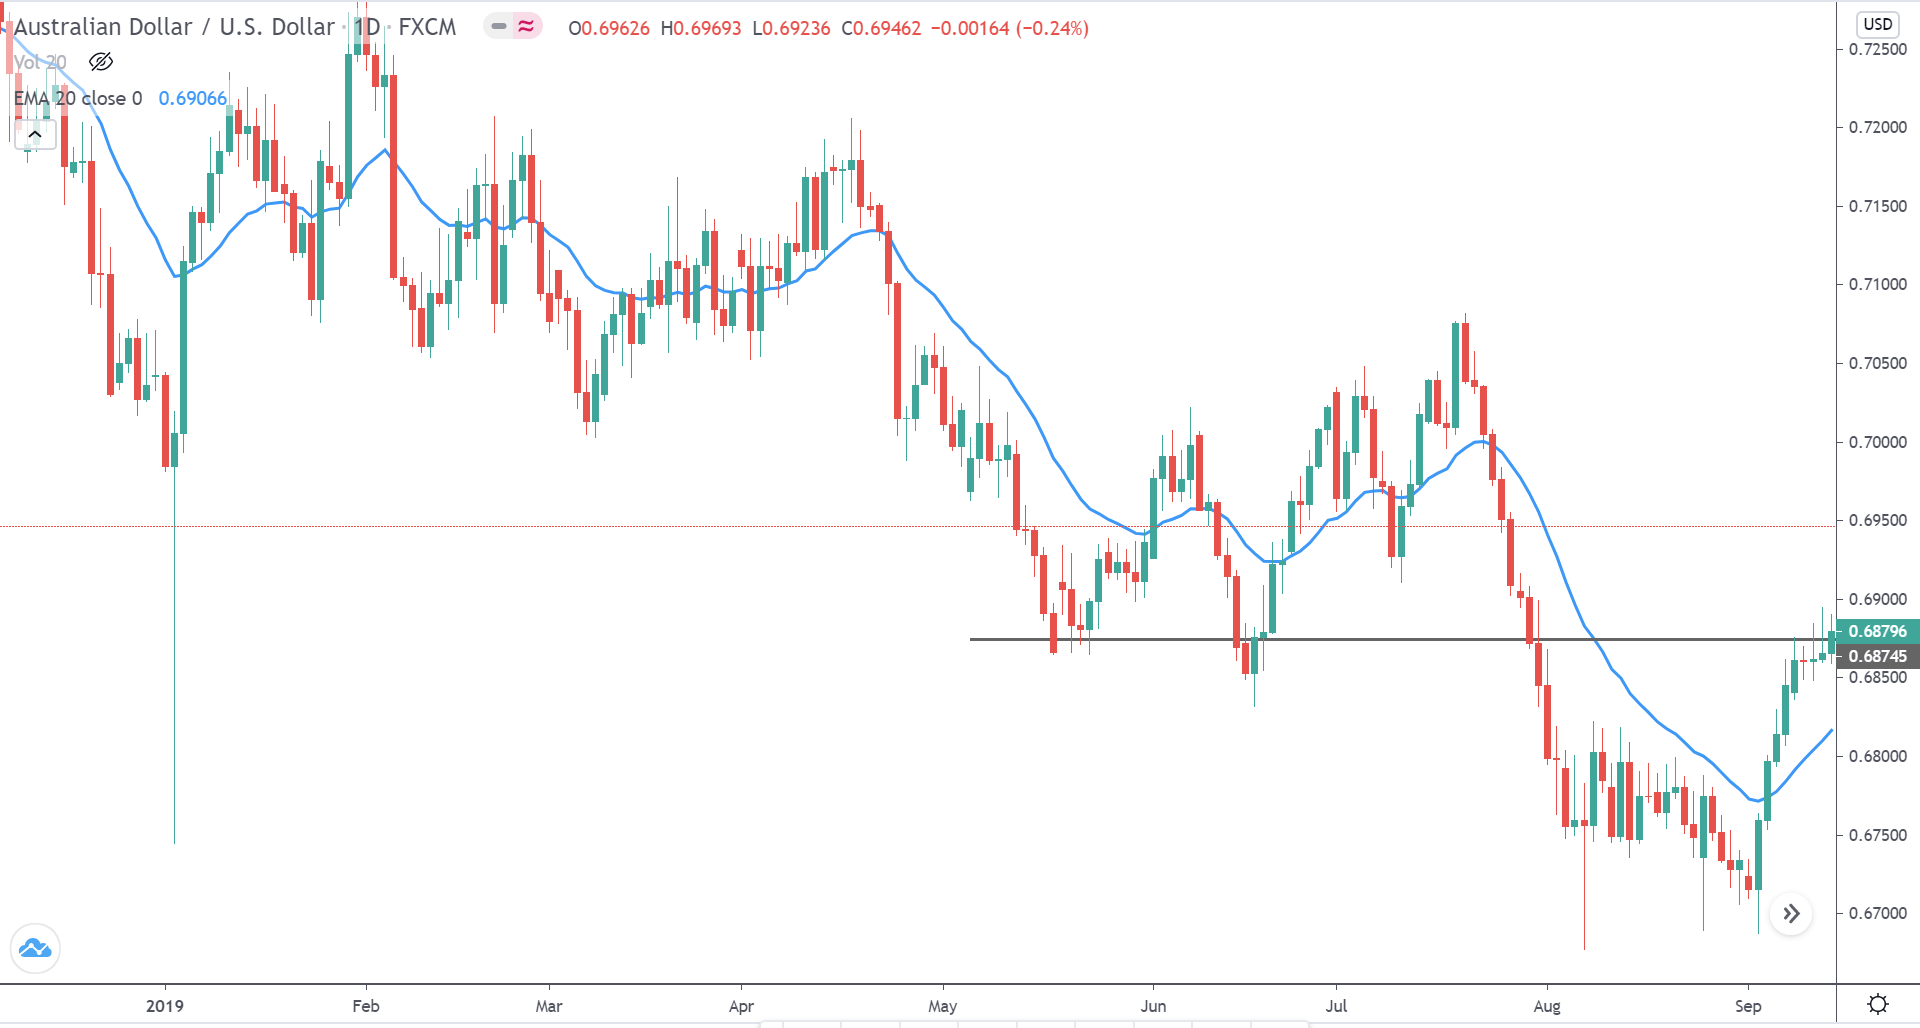
To trade this market, we wait for the price to retrace up to the S&R level (grey ray) before entering the trade. Below is the same chart of AUD/USD on the 4H time frame. The pullback for the massive downtrend began in September. Observe that the price action of the retracement is above the 20-period EMA.
Once the price approaches the Daily S&R, it begins to consolidate, yet above the EMA. Later, as the market slows down, the price aggressively drops below the 20-period EMA. The price then retests the EMA, tries to go above it, but gets drawn down by a bearish candle. Thus, when another bearish candle appears, one can short sell the pair.

Placements
Stop loss
Since the market took a turnaround at the S&R level, the stop loss can be placed right above this level. Besides, one should ensure that the stop loss is above the EMA.
Take Profit
This strategy is basically a trend pullback trade that incorporates the Bladerunner strategy. Thus, the take profit can be placed at the recent lows.
The Bladerunner is a great strategy and helpful to several traders because it blends with any other strategy. Do try this strategy by combining it with your primary strategy and level up your trading skill. Cheers!