In today’s lesson, we are going to demonstrate an example of a daily-H4 chart combination trading, which has a good lesson to give us. Usually, daily-H4 combination traders look for a strong reversal candle in the daily chart. Then, they flip over to the H4 chart to trigger entry upon consolidation and a signal candle. We get all these in our today’s example, but the price acts a bit differently after triggering the entry. Let us proceed to find out what happens there.
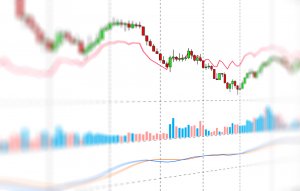
It is the daily chart. The chart shows that the price produces a bullish engulfing candle at a level of support where the price bounces several times. The combination traders may flip over to the H4 chart now and wait for the price to consolidate and produce a bullish reversal candle.
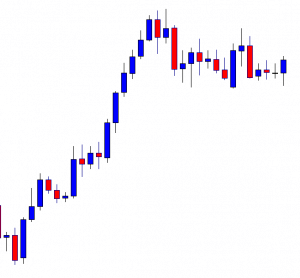
This is how the H4 chart looks. It looks very bullish. The last candle comes out as a bullish candle closing within a level, where the price gets rejection twice. The pair may consolidate here.
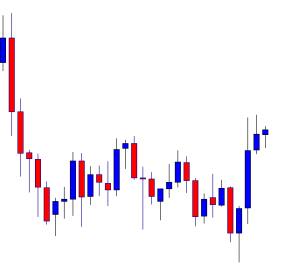
The pair produces a bearish engulfing candle. This is a strong bearish reversal candle. However, the H4 buyers must not lose their hope since the last daily candle comes out as a bullish candle. They must wait with hope.
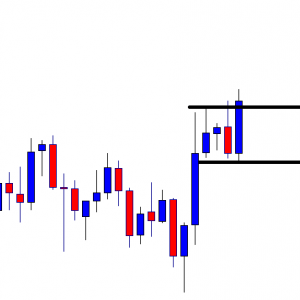
The next candle comes out as a bullish engulfing candle closing above the level of resistance. The buyers may go trigger a long entry right after the last candle closes by setting stop loss below consolidation support and by setting take profit with 1R. Typically, this is an ideal price action to go long for the daily-H4 chart combination traders. Let us proceed to the next chart to find out what happens next.
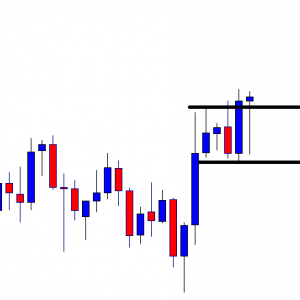
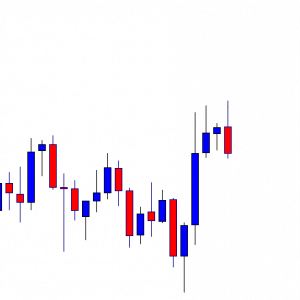
The next candle comes out as a bullish pin bar. Look at the lower shadow. The price is about to hit the stop loss. However, if the stop loss is set here accordingly, the entry is safe. Nevertheless, the last candle comes out as a surprise for the buyers. It has three lessons to give us. We will learn them in the conclusion. Meanwhile, let us find out how the entry goes.
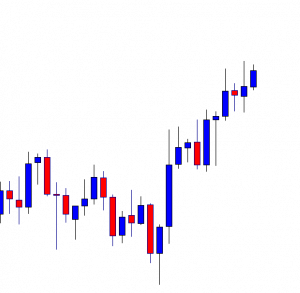
The price then heads towards the North with a moderate pace and hits the target. The combination traders make some profit out of the trade. It is good. Let us now find out what those three lessons are.
- Look at the daily chart again. See the price consolidates within two horizontal levels. There are two resistances. It means the price does not have enough space to travel towards the North as far as the daily chart is concerned. It may have held some buyers in the H4 chart back to go long in the pair.
- Set your stop loss accordingly with some safety pips as well.
- Be patient. If a trade does not go according to your expectation, do not panic.