This indicator, created by Sergey Efimenko in 2015, analyses the price using the Heiken Ashi candle generation principles. However, moving averages (instead of prices) are used as input data. In addition, the result is further softened by the average. Up to 26 types of moving averages can be used to obtain input data.
The trading system with the indicator Heikin Ashi (HA) allows you to trade in the direction of the trend and should not leave prematurely because HA filters out primarily noise and lower price fluctuations that are not useful. This system uses a chandelier whose direction of movement is the same as what occurs on the market, but there are differences:
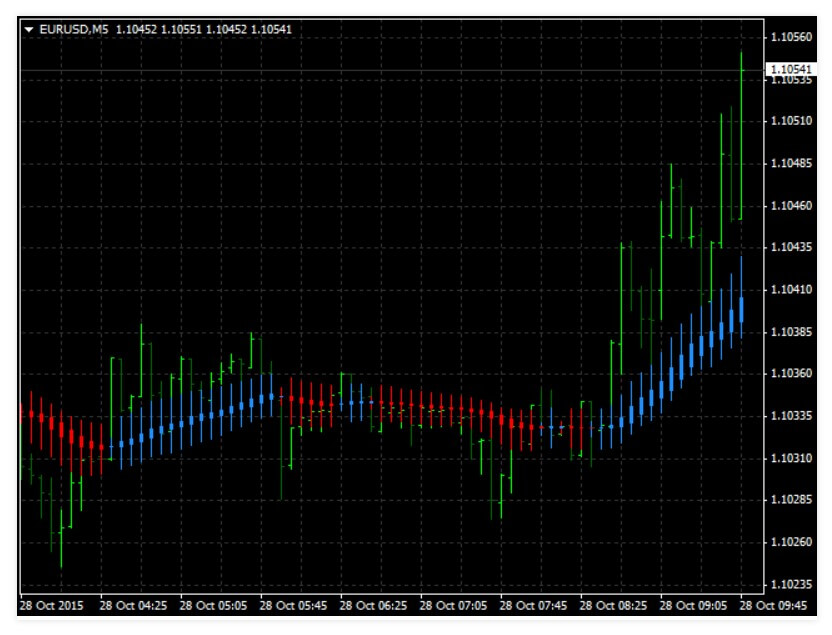
1- In the table of price movements, each candlestick contains 4 different prices: the opening price (open), the lowest price (low), the highest price (high), and the closing price (close). Every candle that happens afterward has nothing to do with the previous candle.
2- In the chandelier Heikin Ashi (HA) each candle is calculated on the basis of the quantities of the previous candle, namely: HA opened = (previous open candle HA + previous closed candle) / 2 HA close = (current open candle price + current closed candle price + current highest candle price + current lowest candle price) / 4 HA high results the highest between the highest candle price now, open or closed HA low = the lowest between open or closed. The use of the HA candelabra is the same as the ordinary candelabra.
The Gap prices are also removed to make the reading clearer. Also, all price action rules also apply to HA candlesticks.
- Time frame: 15 minutes or longer
- Pairs of currency: Any
- Single moving average 9
Heiken Ashi Trading Rules with Moving Stockings
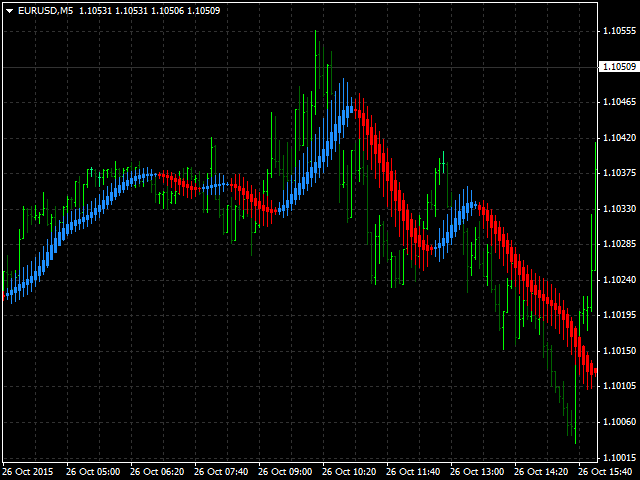
Long entrance ticket: When the curve of ema 9 is crossed with ema 18 from the bottom, wait for the rally price above the ema curve. After some time the price movement will pass a correction (scroll down) to cut one or both corners of the indicator ema (A) The purchase signal occurs when the quote rises again at the end of the corrective period, marked with an HA bullish candle (in blue). It can be purchased at market price (market price), with a stop loss to a few pips at the bottom of the lowest entry-level of the candle.
Short entrance ticket: When the indicator curve ema 9 intersects ema 18 from above, wait until the price falls below the ema curve. After some time the movement of the prices will pass a correction (rise) to cut one or both curves of the indicator ema (B) The signal to be able to sell will occur when the price is again bearish at the end of the corrective period, marked with a bearish HA candle, of red color. The sale of the ticket can be made at the market price (market price), with a loss of stop on several pips above the highest entry-level of the sail.
This is one of the many indicators that exist and that Heiken Ashi uses. We cannot offer the consensus of the users because this indicator has no reviews. It is a simple indicator and can be used by beginner traders as a trend indicator. Besides, its price is only 10 USD, and it also offers a free demo version.