Categories
Forex Basic Strategies

Filtering The Most Profitable Trading Signals Using The ‘Zig-Zag’ Forex Trading Strategy

Introduction

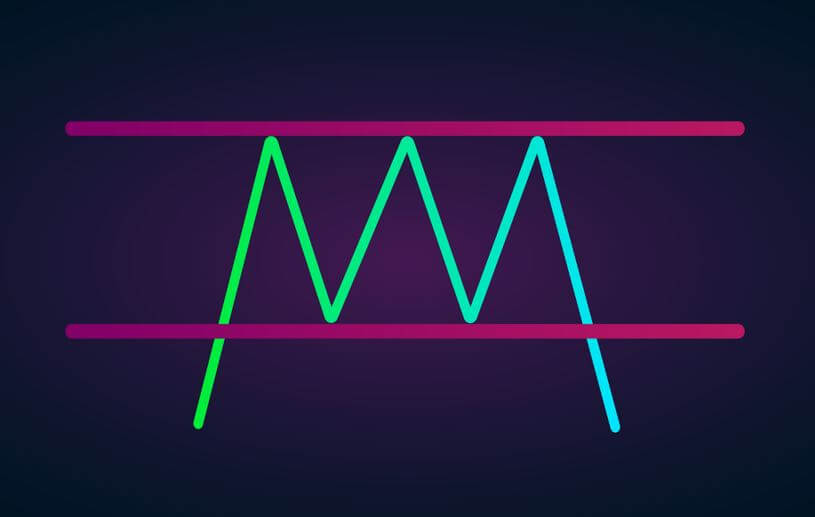
In today’s article, we discuss a strategy that is based on the unfamous zig-zag indicator. The zig-zag indicator serves to shows changes and continuation in trends that occur in price movements. Usually, this indicator is used by traders to look for reversal points in the market. But in today’s strategy, we will use the zig-zag indicator to trade the continuation of a trend. However, if we think a little deep, this type of trading is also a form of ‘reversal trading’ where we will be finding the reversal points in a smaller trend within the larger trend.

At first glance, the indicator appears very simple but is not easy to understand by novice traders. The trading strategy that uses this indicator is not special because it uses this indicator, but since we are imparting various other concepts of technical analysis such as chart patterns, trend lines, and price action. But using this indicator alone too can generate good trading signals provided the trader is having good skill of this indicator properly.

Time Frame

The ‘zig-zag’ strategy can only be applied to the ‘Daily’ time frame. Hence, this strategy is not for intraday and short-term traders. We need to have a longer time horizon to trade using this strategy.

Indicators

We use two technical indicators in this strategy

  • Simple Moving Average (20-period)
  • Zig-Zag (default setting)

Currency Pairs

We can apply the following strategy on both minor and major currency pairs. Liquidity and volatility will not be a major issue here as we are trading on higher time frames.

Strategy Concept

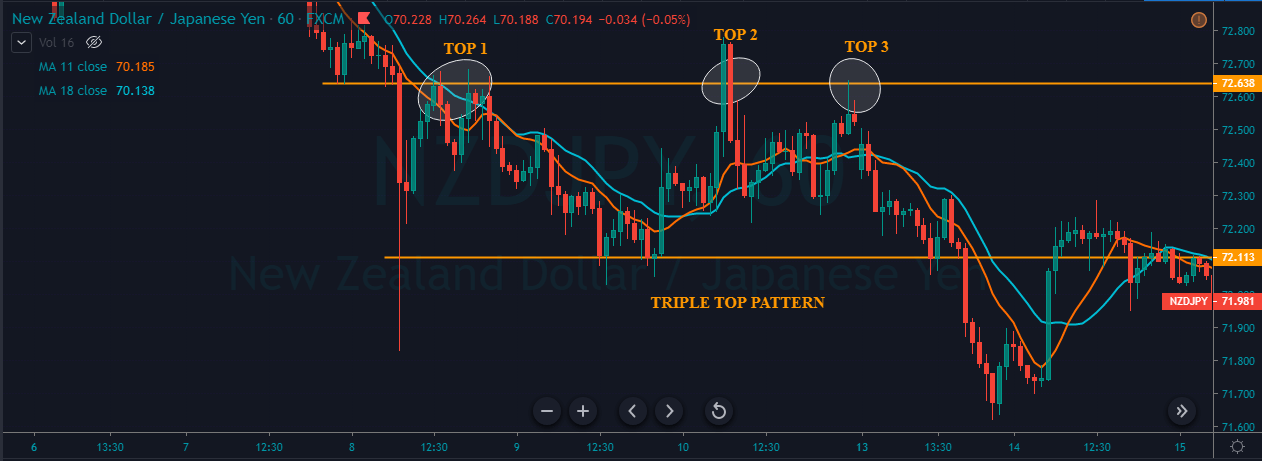
We are basically using the zig-zag indicator to identify classic chart patterns of technical analysis and trade them. The indicator is very effective in reducing the noise by helping the technical trader in viewing the larger picture and general market direction. Here, we look for appropriate chart patterns and associated price action indications within the context of a trend.

When these patterns are formed just anywhere on the chart, they do not hold much value as there is no logic to that. Once we identify a trend using the simple moving average (SMA), we wait for trend continuation signs provided to us by the zig-zag indicator and the chart pattern. The formation of the chart pattern is the first sign of trend continuation. Once price action develops and the market moves in the direction of the major trend, we look for ‘entry’ signals and then only enter into a trade.

One of the astounding features of this strategy is it’s risk-to-reward (RR) ratio. Trades executed this strategy have high risk-to-reward (RR) because we are trading with the major trend and the need for a smaller stop-loss. Not only is ‘RR’ of trades high, but also the probability of winning is much higher in this strategy due to stricter rules and time given for a trade setup to be formed. Now that we got a gist of the strategy, let us find out the actions required to execute the strategy.

Trade Setup

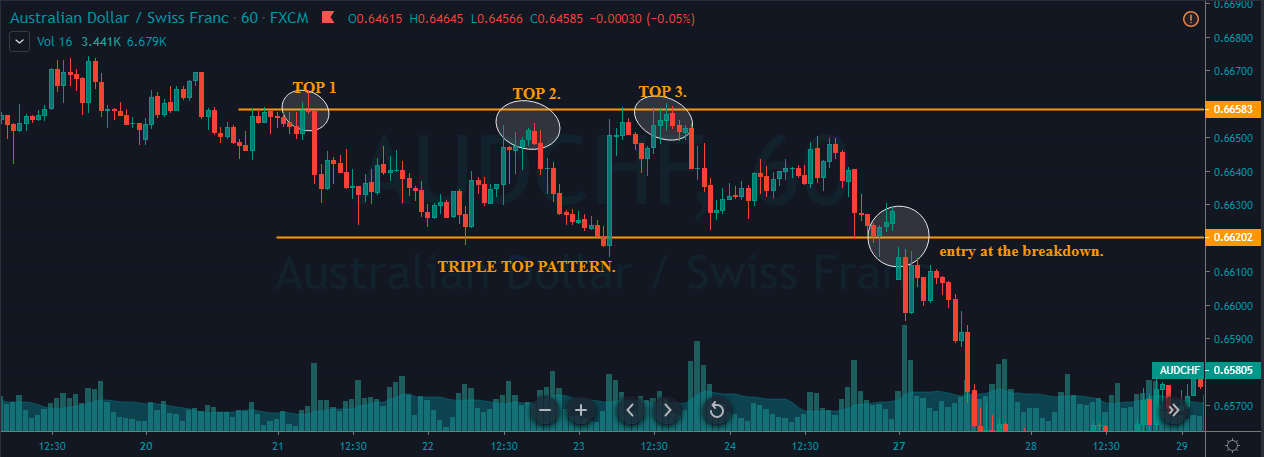
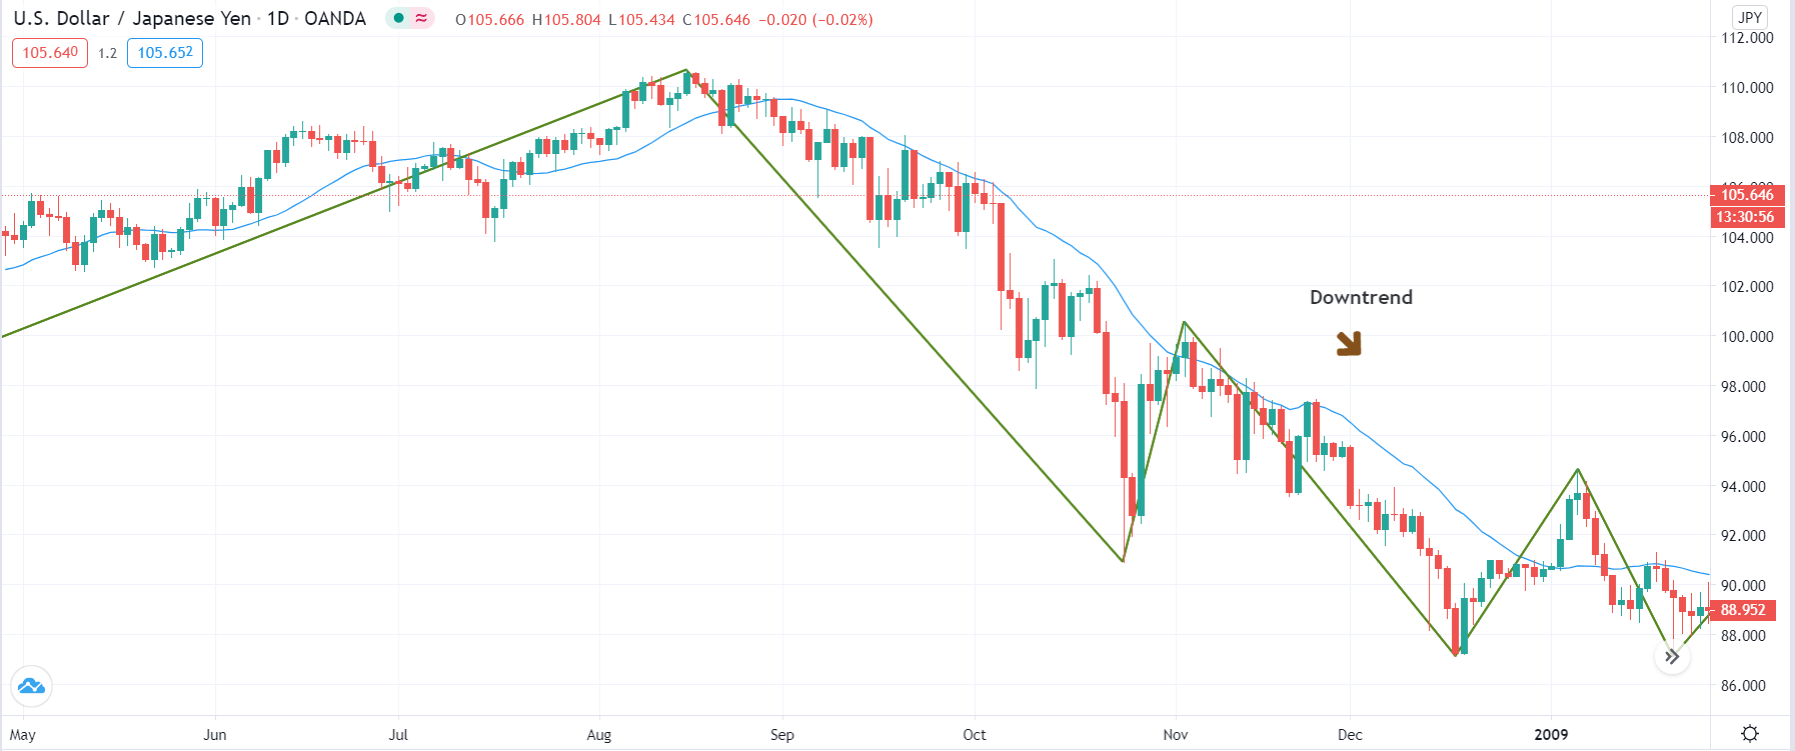
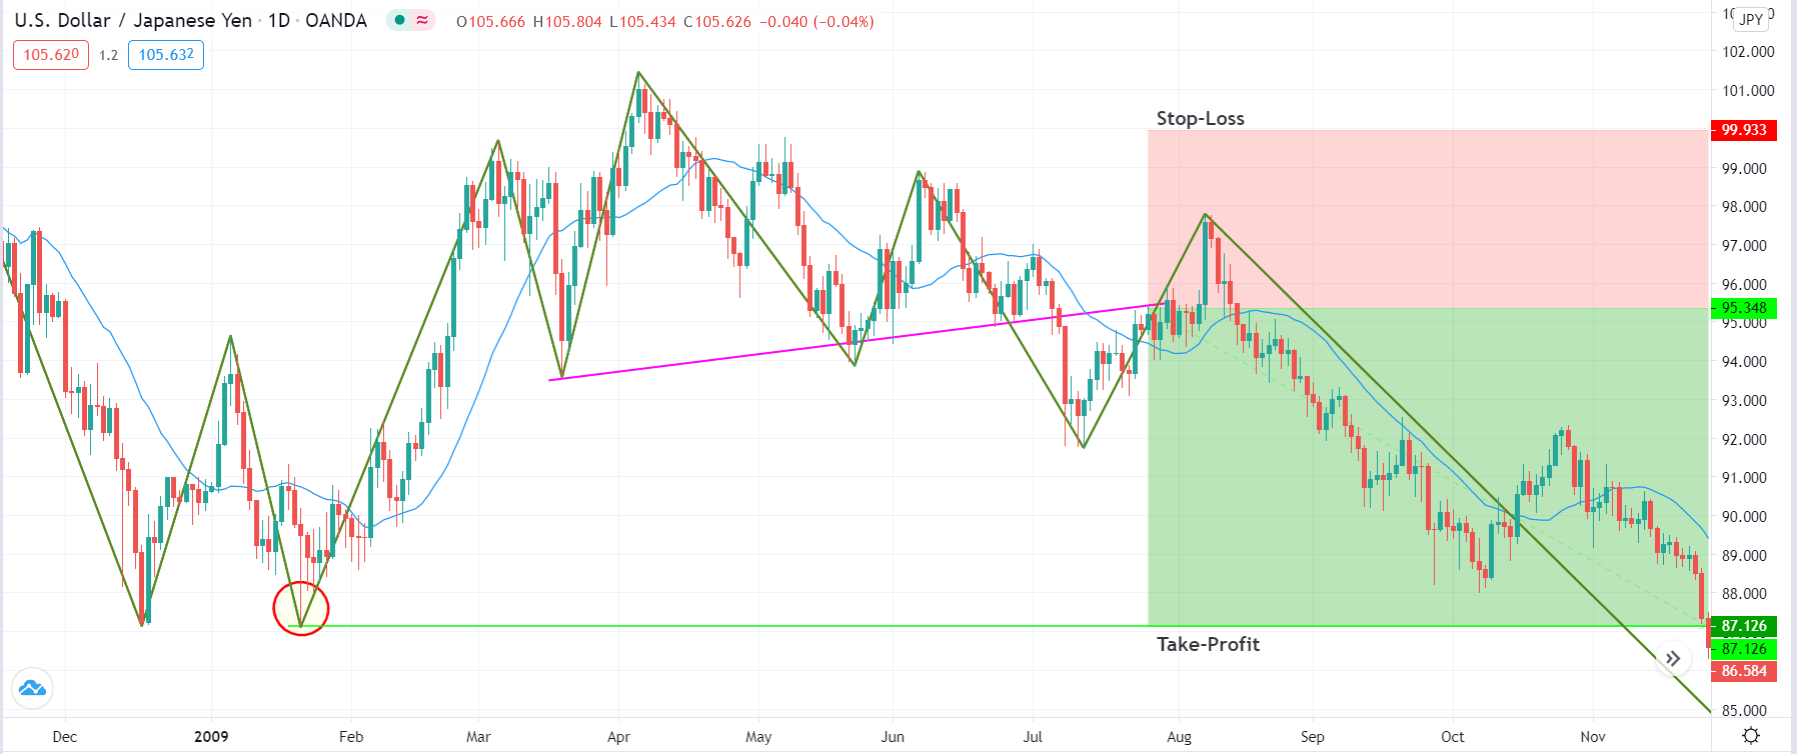
In order to execute the strategy, we have considered the ‘Daily’ chart of the USD/JPY currency pair, where we will be illustrating a ‘short’ trade. Here are the steps to execute the strategy.

Step 1: Firstly, we have to identify the trend of the market on the ‘Daily’ chart. This can easily be done with the help of the simple moving average (SMA) indicator. If the price stays below the SMA for a long period of time, we say that the market is in a downtrend. And if it remains above the SMA for a sufficient period of time, we say that the market is in an uptrend. It is worthwhile to note that zig-zag is not being used for establishing the trend.

The below image shows that the market is in a strong downtrend in the case of USD/JPY.

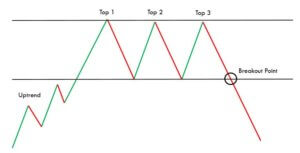
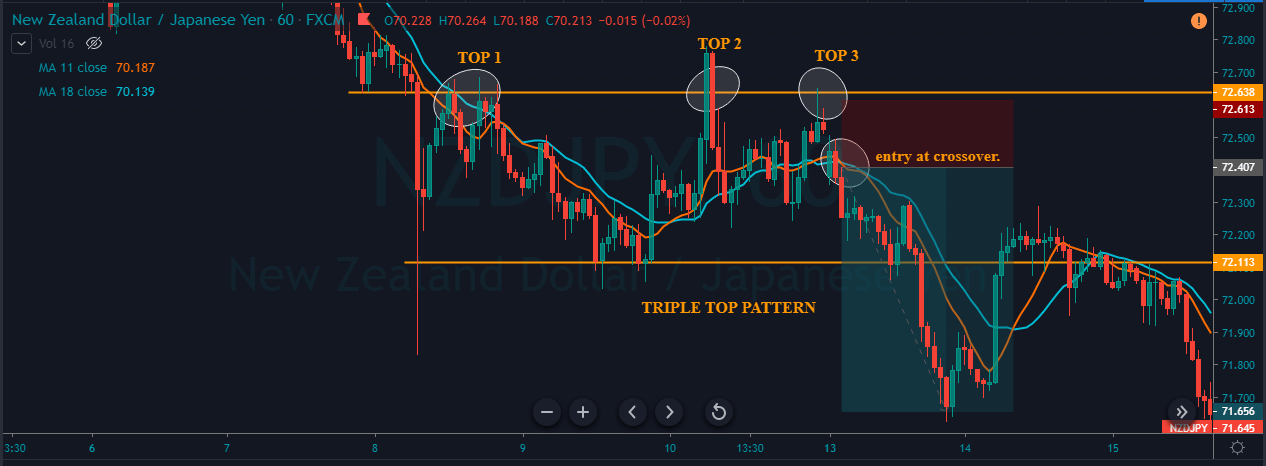
Step 2: After identifying the trend of the market, we wait for the market to form a ‘head and shoulders’ pattern in a down-trending market and an ‘inverse head and shoulders’ pattern in an up-trending market. Here’s where the application of the zig-zag indicator comes into the picture. The chart pattern should essentially be indicated by the zig-zag pattern—the lines of indicator show the ‘real’ formation of the pattern in the market. In addition to this, we plot a trendline that connects the ‘lows’ (head and shoulders) or ‘highs’ (inverse head and shoulders) of the pattern as indicated by the indicator. This completes the execution of 80% of the strategy’s rules.

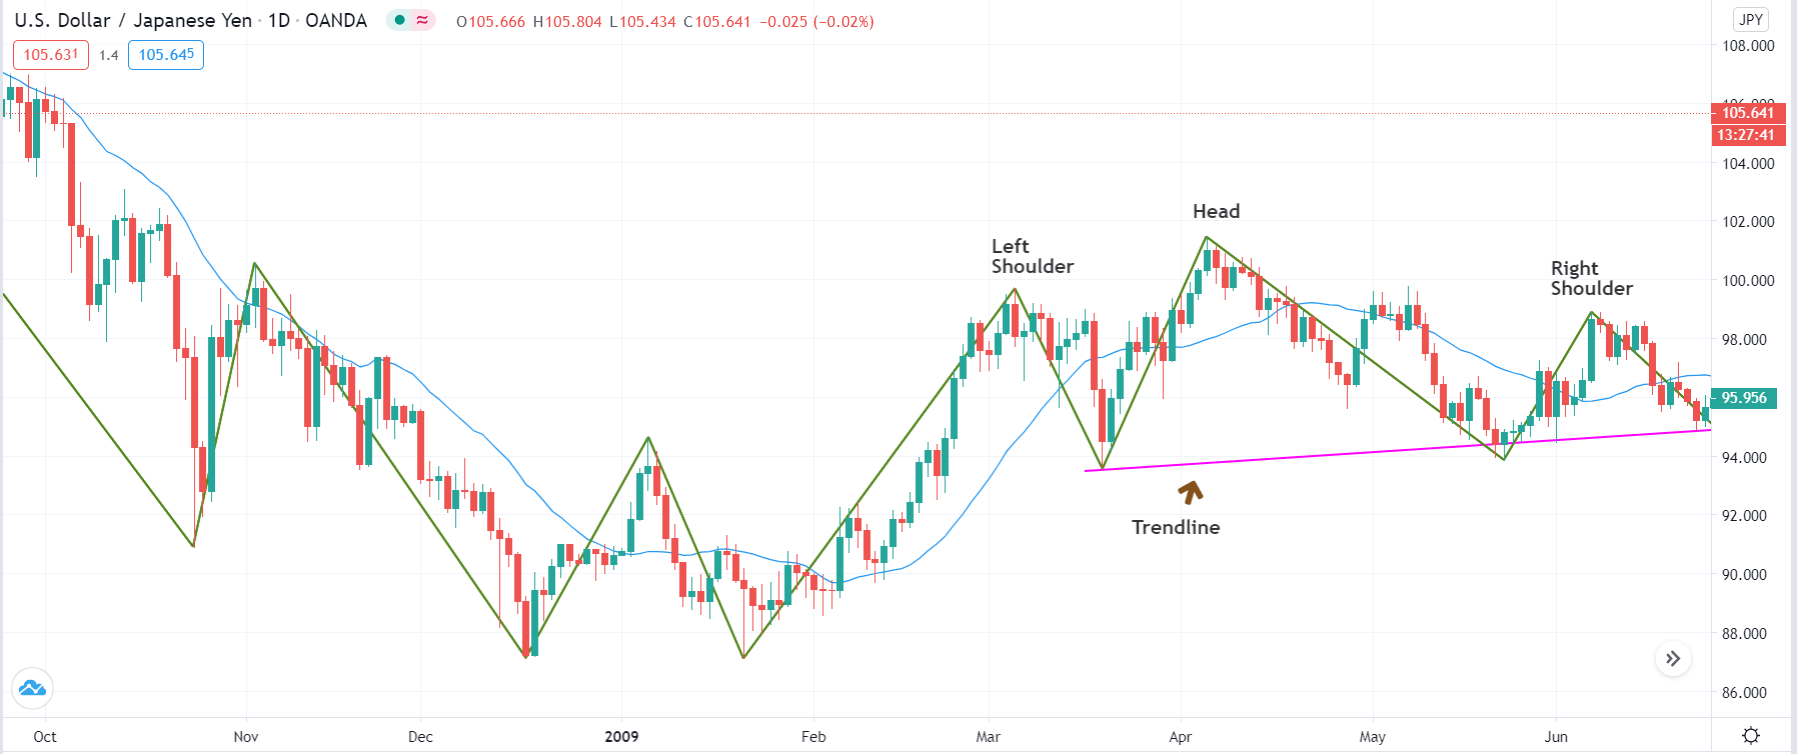
Step 3: We enter the market for a ‘buy’ or ‘sell’ after the price breaks the trendline and ‘tests’ it on the other side. In simple words, in a ‘head and shoulders’ pattern, we enter for a ‘sell’ when price breaks the ‘support’ trendline and re-tests after making a ‘lower low.’ While in an ‘inverse head and shoulders pattern,’ we enter for a ‘buy’ when price breaks the ‘resistance’ trendline and re-tests after making a ‘higher high.’

The below image shows how a ‘short’ entry is taken.

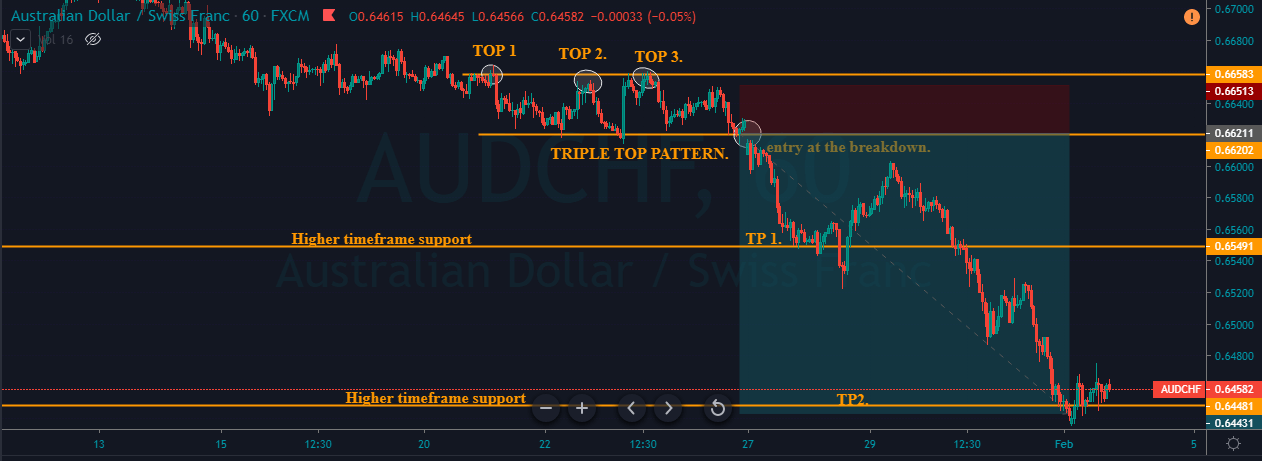
Step 4: Now, let us determine the stop-loss and take-profit levels for the strategy. When ‘short,’ we place a stop-loss above the right shoulder of the ‘head-and-shoulder’ pattern. Similarly, when ‘long, stop-loss is placed below the right shoulder of the ‘inverse head-and-shoulder’ pattern. Take-profit will be set at the ‘lower low ‘of the major downtrend and at the ‘higher high’ of the major uptrend. The risk-to-reward (RR) of trades executed using this strategy will be at least 1:1.5.

The below image shows the result of sample trade executed using the zig-zag strategy.

Strategy Roundup

Even though the above strategy takes a lot of time to present a potential trade, the risk-to-reward and probability of winning of these trades are worth waiting for. There are many applications of the zig-zag indicators. Traders make use of other technical indicators like the Stochastic Oscillator and Relative Strength Index (RSI) together with the zig-zag indicator to locate the overbought and oversold conditions of the market.

Categories
Forex Basic Strategies

Most Profitable Ways To Trade The Triple Top Chart Pattern

Introduction

The Triple Top is a bearish reversal pattern that helps traders in identifying the peak areas of the market. This pattern occurs when the market prints three consecutive tops nearly at the same price level of any underlying asset. The areas of the touchpoints are the resistance levels, and the pullback between these points is known as the swing lows. After the third high or third touchpoint, if the price breaks the support and goes below, the pattern is said to be complete.

Traders can then activate their positions on the sell-side. Most of the traders try to be extra conservative and wait for the exact pattern to occur. But it can be challenging to find the Triple Top Reversal pattern with all the three highs at the same in size. We should always remember that the technical analysis is more of art and less of science. So even if 80% of the pattern rules are met, we can take the trades by confirming those signals with other credible technical indicators.

The Psychology behind the Triple Top Pattern

The appearance of a Triple Top Pattern implies that the buyers are slowly losing momentum in the market. It might also mean that the buyers are not willing to push the price higher. At the same time, the sellers are interested in taking the price lower. The Triple Top pattern is a way more powerful pattern than most of the other credible patterns in the market. This is because the third failed attempt of the buyers implies that the sellers are way too aggressive than the buyers. Hence we can expect stronger downward moves.

Triple Top Pattern – Trading strategy

The Triple Top pattern occurs very rarely on the higher timeframe. Even if it occurs, this pattern often takes a lot of time to develop fully. However, on an intraday timeframe, this pattern can be observed quite often.
Step 1: Identifying the TTP on a price chart

In the below AUDCHF Forex chart, we can see the market printing a clear Triple Top chart pattern.

Step 2: Entry 

The strategy is to wait for the breakdown to happen so that we can activate our short positions. On the 27th of January, we can observe the breakdown that occurred in this pair, and that can be considered as a clear Sell Signal.

Step 3: Stop-loss & Take Profit

We can activate our sell positions as soon as we see a bearish confirmation candle. We can go for two different targets in this trade. Both are at the higher timeframe’s support area. Most of the traders believe that their target must be double as compared to the size of the Triple Top pattern, but it’s just a myth. Always book the profit according to the market circumstances.

If the trend is super strong, go for the deeper targets. Contrarily, if the market momentum is fading, book the profit at any significant area. Traders who are well versed with pattern trading can add positions when the market goes back to the entry point so that they can ride the whole show again. While trading the breakout or break down patterns, always place the stop-loss near the recent low.

Triple Top Pattern + Double Moving Average

In this strategy, we have paired the Triple Top pattern with the Double Moving Average to identify accurate sell signals. A moving average will help us in identifying significant trends, trading opportunities, and entry/exit levels. Many traders believe that if they find the magic number of the period, then they can easily beat the market, but it’s not true. There are infinite numbers of periods available, and traders should practice only 3 to 4 periods, to use this indicator effectively.

Step 1: Identifying the TTP on a price chart

In the below chart, we can observe the market printing the Triple Top pattern on the NZD/JPY 60-minute Forex pair. We have applied the double MAs on to the price chart.

The traditional way to trade this pattern is to wait for the break down to happen and then go for sell just like we did in the above example. But in this strategy, let’s tweak things a bit by adding the double moving average to the plot. In this strategy, we are using the 14 and 9-period average. This strategy is purely for the intraday traders only.

Step 2: Entry, Stop-loss & Take Profit

After price action printing the third top, if we observe an MA crossover happening, we can activate our sell positions even before the breakdown. By following this approach, we get to enter the trade ahead of time, while the breakdown traders wait for the break down to activate their position. Most of the professional traders use this approach to maximize their profits.

There are many ways to close our positions. We can book profit at a significant support area. The placement of stop-loss depends on the trader’s trading style. If you are an aggressive trader, the smaller stop-loss is good. But expect more hits before the trade performs. If you are a conservative trader, use an extra spacious stop-loss.

Bottom line

A pattern is said to be paramount when it offers the best risk-reward ratio trades. Also, the pattern must have a higher probability of occurring in intraday timeframes. The Triple Top is one such pattern that offers both of these demands to every trader. Also, remember that the Triple Top is a bearish reversal pattern, so only take short positions when you see this pattern on the price charts. Apart from the ones mentioned above, there are different other ways to activate our position in the appearance of this pattern. But the above ones are the safest and most profitable ways to trade.

Try identifying and trading this pattern on a demo account before trading on the live charts. We hope you find this article informative. If you have any questions, please let us know in the comments below. Happy Trading.