In this course, we will further explain, with an example, how you can trade a news release with a directional bias. In the US, the labor market report is one of the most anticipated new releases in a month. The report has a significant impact on any pair with USD. Note that every trader has their approach to trading the news with a directional bias. Here’s our approach.
If you are a forex trader with a directional bias, you need to have in-depth knowledge of the news release you are trading. What do we mean by in-depth knowledge? Firstly, you have to know what that particular news release tells about the economy. For example, the US labor market report has the unemployment rate and nonfarm payroll data.
When both these indicators beat the analysts’ expectations, we can expect that the USD will become stronger than other currencies. The US labor market report is a leading indicator of consumer demand, contributing up to 70% of the GDP. Furthermore, in the current coronavirus pandemic, the labor market report is used to show the rate of economic recovery.
You’d also expect the USD to weaken relative to currencies it is paired with if the news of the labor market report doesn’t meet analysts’ expectations. In this case, it means that unemployment increased, and the economy didn’t add as many jobs as expected.
To make a proper directional bias trade, you need to understand how the labor market report impacts the forex price charts. You have to look into past releases and establish how much the market moved; this will help you get the average pip movement. You also need to be aware of the prevailing macroeconomic conditions and the recent unemployment rate trend.
What to do before the news release?
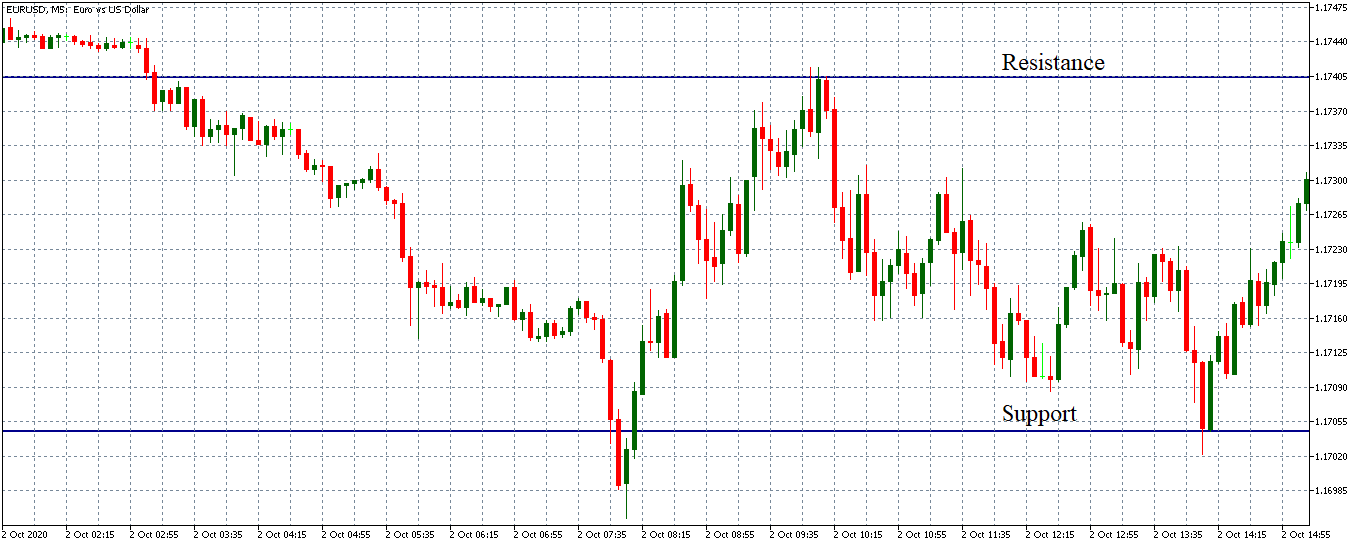
Go back a few hours on your chart and establish the intraday support and resistance levels. You will use these levels as your ‘take profit,’ and ‘stop-loss’ levels after the news is released.
Let’s check out the news release of the US unemployment rate on October 2, 2020, at 8.30 AM EST.
EUR/USD: Before US Unemployment Rate Release on October 2, 2020,
just before 8.00 AM EST
Since the unemployment rate was lower than the previous release and also beat analysts’ expectations, our directional bias is to be bearish on the EUR/USD pair. In this case, we will use our previously established Support Level as the ‘take profit.’
EUR/USD: After US Unemployment Rate Release on October 2, 2020, 8.00 AM EST
By now, you have a clear idea of how to make a news trading plan and schedule. The next thing you need to understand is that there are two primary ways of trading the news in the forex market. These ways involve whether or not you have a directional bias towards the news being released.
Having a Directional Bias
Among the first lessons you learn about the release of economic indicators is how they impact different currency pairs. For example, let’s say that you are interested in the GBP/USD pair, and there is an upcoming news release of the UK GDP.
We would expect that if the GDP shows that the UK economy has expanded, then then the GBP will appreciate relative to the dollar the pair will rise. Conversely, if the GDP shows that the UK economy contracted, you will expect the GBP to depreciate against the USD, and the pair will fall. This is what having a directional bias means.
We’re sure you have noticed the ‘consensus’ aspect from the economic calendar. This number is usually what the majority of financial analysts and economists agree on, as the forecast for a particular economic indicator. It is commonly referred to as “Analysts’ expectations.” In most cases, the market reaction to a news release is determined by whether the news was better than the analysts’ expectations, worse than the expectations, or in line with the expectations.
Let’s say that the analysts’ expectation for the upcoming UK GDP is a growth of 2% and when the actual GDP data released turns out to be 2.3%. If you have a directional bias, you will buy the GBP/USD pair as you expect the GBP to appreciate against the USD.
In another scenario, assume that the news release did not meet the analysts’ expectations and the actual GDP growth is 1.6%. For a forex trader with directional bias, they would sell the GBP/USD pair since they expect the GBP to depreciate relative to the USD. The analysts’ expectation is vital to a trader with a directional bias.
Non-Directional Bias
A news trader with non-directional bias ignores the analysts’ expectations. Such traders are aware that high-impact news will result in a significant movement in price action. For them, it doesn’t matter the direction of the market movement; they only follow the trend. They don’t bother whether the news release beat expectations or not.
We hope you got an understanding of what Directional and Non-Directional bias are while trading the news. Don’t forget to take the below quiz. Cheers!
https://youtu.be/urtMhx5oBls
Assessing Directional Bias – Predicting Long Term Trends
Directional bias and personal bias, i.e., the feeling that the markets will either go up or down, should not be
https://youtu.be/urtMhx5oBls
Assessing Directional Bias – Predicting Long Term Trends
Directional bias and personal bias, i.e., the feeling that the markets will either go up or down, should not be
Assessing Directional Bias – Predicting Long Term Trends
Directional bias and personal bias, i.e., the feeling that the markets will either go up or down, should not be confused because they are two entirely different factors relating to trading.
When it comes to personal bias, a lot of traders are right, but not necessarily at the right time! In fact, one of the safest bets in trading is that traders who hang on to trades that are going against them, because they have a biased opinion of the market, are the types of traders who regularly lose money. Therefore, the longer you hang on to a losing trade because of your biased opinion about the market, the more likely you are negatively affect your win to loss ratio.
There is an old saying in the market is; buy the rumor and sell the fact! And rumors abound in the markets. In fact, more so now than ever before, and especially with the advent of Twitter and the myriad of news release platforms. Indeed, it will probably have been from one of these that you formed your biased opinion in the first place.
Another problem with personal bias, and especially when it comes to retail traders, is that at what level do you define the value in a given exchange rate? A level that might seem correct to you might not be the same level as a large hedge fund, or institution, or, more importantly, a sovereign wealth fund or government!
When it comes to directional bias, traders want to see that their technical tools are working hand in hand with fundamental analysis and sentiment. After all, when we are all singing from the same hymn sheet, so to speak, this is when primary trends tend to develop.
So, if you do have a personal bias towards the market direction, the best time to run with that (to open Spot trades) is when you have the technicals, fundamentals, and sentiment backing you up. In other words, wait for the market to come to you and don’t go chasing it!
Let’s take a look at example A. This is the British pound against the US dollar, also known as Cable. The best way to read a chart is from left to right because it tells a story. In this particular chart of the 1-hour time frame, we can see that price action levelled off at the 1.22 exchange rate. Prior to this, directional bias was to the downside for this pair. This was due to the fact that Britain is getting closer to the 31st of October deadline, where it could possibly leave the European Union without a withdrawal agreement in place, thus crashing out, which would have been detrimental for the British economy. But at the point on the chart where the upward arrow has commenced, the European Union agreed to reopen the Withdrawal Agreement negotiations and thereby potentially opening the door to a managed divorce between the UK and the eurozone. Market sentiment changed at this point. Fundamental analysis also changed at this point because when the United Kingdom voted in the 2016 referendum to leave the European Market, the danger was that we would leave without a deal, and this caused the depreciation of the pound. However, with a mutually beneficial Withdrawal Agreement in place and backed by a strong economy, the pound was heavily perceived by the markets to be undervalued and, therefore, ready for a bull run.
The subsequent strong push higher in Cable to the 1.24 level and the lack of a pullback from that exchange rate meant that technical traders could see that everything was in position for a continuation in directional bias to the upside. And so from the 1.22 level, it was a case of when to get in and buy into the potential bull run during pullbacks and corrections.
Let’s go back to our chart and take a look at example ‘B,’ where we have added a blue trendline and some areas of support and resistance. The first thing to point out is that a previously a ceiling, just below trendline ‘A’ has been breached to the upside. Price action continues to just above trendline ‘B,’ where we see a slight pullback and then a flattening of price action. Level ‘B’ then becomes a level of support. This came about shortly after an announcement by the European Union to reopen the UK Brexit Withdrawal Agreement and enter into fresh negotiations. Price action continues to surge before pulling back to the area of support marked ‘C.’ Price continues to move up to various points or resistance before pulling back to areas of support found at ‘D,’ ‘E,’ ‘F’ and ‘G,’ thus providing traders with a strong directional bias the upside. Each level of support is defined by the blue trendline, which is drawn at the base of the pullbacks and where this trendline acts as a simple moving average.
Here at Forex.Academy, we strongly recommend you incorporate your own trading style and methodology with technical and fundamental analysis and market sentiment and let the trend be your friend.
Introduction
A challenging question every trader comes across in his trading career is: whether he should be buying a call option or a put option? Traders establish directional bias by
Introduction
A challenging question every trader comes across in his trading career is: whether he should be buying a call option or a put option? Traders establish directional bias by
Introduction
A challenging question every trader comes across in his trading career is: whether he should be buying a call option or a put option? Traders establish directional bias by studying high-level charts, support and resistance levels, price action, and fundamental indicators. Dow Theory suggests that the market will continue to move in the same direction until an external force causes a reversal or break in the trend.
Directional bias plays a major role in the ‘trend-reversal’ strategy than in the ‘trend following’ strategy. Directional bias will help a trader decide if he should be going long or short in options. You can also identify the direction of the market trend. Once you establish a directional bias, you will have greater confidence in executing your trading strategy. During the process of execution, none of the actions are emotionally driven.
How to develop a directional bias?
Any trade which includes thorough preparation should consist of establishing directional bias, and it is a two-step process.
Predicting the direction of the price move and overall trend.
Identifying the trigger points and trading rules that will confirm our directional bias.
Determining a directional is just one step towards making a successful trade. There are many more things we need to put together before taking a trade. After backtesting a few strategies, establish some trading rules. Remember to include only those rules that confirm your directional bias. Confirming directional bias is an excellent habit that improves the success rate of trades.
A successful trading strategy is more about the right planning and psychology rather than a single entry technique or trading system. Options trading is said to be complex, hence requires a lot of knowledge before one can trade it. Other than that, you need to consider factors that are specific to options like time decay, option theta, option beta, and option gamma. We explain here how it is to be done correctly.
Directional bias through momentum indicators
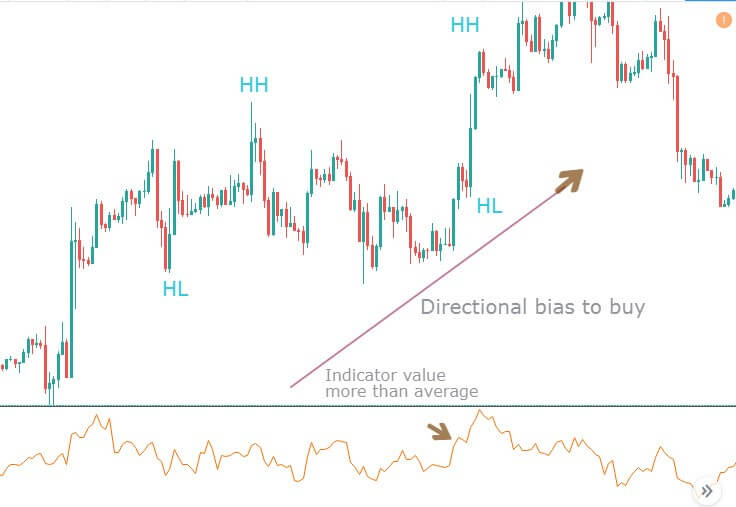
The easiest way to establish directional bias is by using momentum indicators and price action analysis. If prices are trending in an upward direction, making higher highs and higher lows, traders should look to buy. On the other hand, if prices are making lower lows and lower highs, traders should look to sell. In this strategy, momentum indicators can be used as an additional confirmation tool.
Example of buying a call option
In the above picture, the orange line graph represents the momentum indicator. The price action pattern shows a formation of higher highs and higher lows, with the indicator pointing towards the buy-side. The candlestick pattern should be such that there is no opposing force that could possibly reverse the current trend.
Point of entry: The exact point of entry would be after the formation of at least one higher high and higher low. This is confirmed by the momentum indicator, which shows a sudden rise above the average value. This is a low-risk entry with maximum reward.
Take profit and stop loss: When the momentum indicator no longer makes higher highs and higher lows with the main trend, it is a sign that the trend might be coming to an end. Hence, you should book profits here. Stop-loss in this strategy should be placed below the previous higher low.
Note: All the trades discussed above are to be executed using a call option and not using the cash segment. It is advised to choose the strike prices accordingly. There could be some differences in the entry price and stop loss of options when compared to spot prices.
The same rules apply for sell trade as well, but here a put option needs to be bought, and you would essentially want to look for lower lows and lower highs.
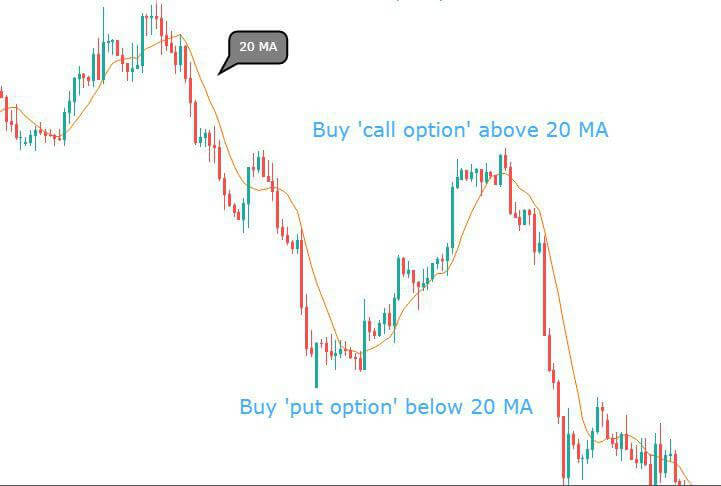
Directional bias through Moving averages
We would like to conclude our methods of establishing directional bias with the use of ‘moving averages.’ This is one such technical indicator, which can be used to develop any new strategy. For this strategy, we use the 20-day moving average as it is considered to be one of the most powerful moving averages.
In the above figure, we have plotted the 20-day Moving average using the yellow line. This is a simpler strategy as compared to the momentum indicator strategy. Here, if you see the price trading above the 20-day MA, you should form a directional bias to buy. And if the price is trading below the 20-day MA, you should form a directional bias to sell.
Point of entry: When price crosses the MA line on any side and stays there for more than four candles, you should be taking entry in that direction of the trend. More the number of candles better will be the entry.
Take profit and stop loss: You can continue to hold on to the trade until the price reverses and crosses the other side of the MA line. If it crosses, book out your profits. Stop-loss can be placed at the high or low from where the market reverses.
Conclusion
If you use any other way of developing directional bias, make sure that it needs to be simple. If it becomes complicated, it can increase the complexity of your trading strategy. Having a directional bias will make you trade in the direction of the dominant trend, which is less risky. Finally, a trader needs to abstain from opening positions that have no directional bias.
We hope you find this article informative. If you have any questions regarding this strategy, please let us know in the comments below. Happy Trading!
Hello and, welcome to this latest edition of courses on demand, brought to you by Forex Academy. So, in this course, we’ll be looking
[embed]https://youtu.be/C7FHmjgn_1Y[/embed]
Hello and, welcome to this latest edition of courses on demand, brought to you by Forex Academy. So, in this course, we’ll be looking
Hello and, welcome to this latest edition of courses on demand, brought to you by Forex Academy. So, in this course, we’ll be looking to discuss directional bias and, the importance that directional bias can have in the traders’ decision-making processes. So, just before we begin then if we could start as we always do with our disclaimer, please do familiarise yourself with our disclaimer and, also, the risks involved in trading these financial markets okay.
So, let’s do let’s cover a brief outline in terms of what you can expect over the duration in this course. We’ll start with an introduction to directional bias just explain to you what it is in detail and, then we’ll we will discuss the importance of, as a trader being able to have a direction of bias and, it’s not to be confused with having a biased opinion on a market. So, there is a difference to be made and, we’ll also, look at market conditions and, how those can change very quickly and, therefore, what role directional bias can play in a changing market environment then we look at directional bias in practice. So, some of the things that you would need to consider if you’re looking at a price chart and, you’re a technical trader and, we’ll have a look at how you can apply these things in practice it’s it’s also, important to know, and, understand, the type of trend that you might be looking to trade. So, what we’ll do is we’ll have a look at direction of bias in and, primary trend but also, directional bias in the secondary trend and, we’ll explain what we mean by that and, then we’ll just finish off with some final considerations to be made about the topic of directional bias okay. So, let’s start we always deal with our introduction to directional bias and, we’ll start by a brief definition from a training perspective a directional bias is when a tray has a really strong conviction that a market will either move to the upside or to the downside. So, it’s just predetermining that as a potential outcome. Now, there is a school of thought that suggests that bias must not play any part in trading decisions; it’s something we hear all the time you know, don’t be biased when you trade. Now, from a risk management perspective we absolutely and, categorically agree allowing various to cloud your judgment when in the losing trade, for example, is a big no-no for consistently profitable traders. So, it’s that desire for the markets to perform in a way in which we want to be proved correct. Now, that’s not really what training is all about. So. So, try not to be too biased in your judgments where you can look at a chart it’s clearly moving in one direction but for some reason you seem to perceive it as a market that is moving in the opposite direction to the way the market is actually moving and, and, therein lies the difficulties. Now, being able to clearly evaluate market movements allows a trader to establish the directional bias. So, if you have a methodology which can evaluate which way the market is moving that can, therefore, allow you to with a high degree of probability establish a direction of bias. Now, this is key before trading opportunities are identified. So, this is at the very early stage of that decision-making process. So, for example, if you if you do your analysis and, you believe that a market you know, it’s a strong likelihood that the market is going to push to the upside you can then have a very bullish bias to that market and, therefore, then you will be looking specifically for buying opportunities in that market.
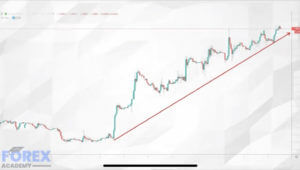
So, an awareness of this bias is absolutely essential in your in any traders trading making processes. So, as a key note understand, the difference between having a trend bias meaning you you’re conducting your analysis and, you are looking to actually look to buy a market or to sell a market for a specific set of reasons as opposed to simply having a biased opinion of the market, for example, a throwaway comment which could be I think the gold market is going to move to the downside. Now, that’s having a biased opinion, you might have read an article. There might be some reasons for that, but is it based in anything tangible that you can work with as far as trading these financial markets. So, and, that’s where having a trend bias is actually far more stable; let’s say to be able to base those opinions on okay. So, let’s have a look at the importance of directional bias and, the role that it can play in traders’ decision-making processes. So, technical traders understand that directional bias is absolutely important to their approach. It is important to know when trading the direction of the primary trend that its movement is generally always supported from both a technical and, fundamental perspective. So, that’s the beauty about the principles of trading the trend of following the trend if you know, which direction the primary trend is moving in and, this is the overall trend of any particular market and, we’ll discuss will discuss primary and, secondary trends very shortly and, but if you have a comprehensive understanding about the overall direction of a market then often a lot of that move is very much supported with from a fundamental perspective as well. So, that there’s something behind that market which is continuing to drive prices higher and, the technicals start to work hand, in hand, with the sentiment and, the fundamentals behind these market moves and, that’s where a little comes together quite nicely for those technical traders looking to apply a directional bias and,. So, really take control of the markets wait for the markets to come to you. So, if you do have if you have a direction of bias but the market has to be pulling back then allow it to pull back to maybe a level of support resistance of some kind where it’s a technical tool or whether it’s an indicator whatever you base your decision-making processes on you know, please do. So, and, do take control. So, really it’s a case of looking at the charts and, deciding if the market pulls back to this particular price I’m gonna look to buy it from that level and, that’s what we mean by taking control rather than allowing the market to be very choppy move up move to the upside where you’re looking to buy it and, then all of a sudden the price turns around and, all of a sudden you’re looking to sell it. So, that’s someone that is that doesn’t really have a particular direct directional bias based on anything meaningful. So, do try to wait for the market to come to you and, don’t go chasing those markets because nine times out of ten there’s only one winner if you don’t really understand, what type of trade you’re going to execute and, the parameters of that trade as well. So, always try to develop a direction of bias when you trade determine in advance and, it’s very important that this is done in advance whether you are actually looking to buy or to sell a market um or even do nothing which of course is very much a viable option depending on the market conditions. So, you will experience certain market conditions where the prevailing opinion would be for you to effectively do nothing and, we’ll discuss what those market conditions are like very shortly. So, ultimately having a direction of bias prior to entry where you do have a certain degree of conviction on the direction of that market that all underpins a very successful approach to trade in these markets. So, moving on then to market conditions and, again it works hand,-in-hand, with being able to make the decision in terms of what you are looking to do when you trade these markets and, having a comprehensive understanding of market conditions is is very important. So, just to focus on market conditions for and, market conditions relate to the way in which the market is currently trading. So, in other words is the market trending are we getting big moves to even the outsider to the downside is it consolidating is it actually moving sideways and, and, so-called taking a break is it incredibly volatile we’re getting big market swings or is it lacking direction or is it is the market actually technically illiquid and, these are just a few descriptive terms where people use to discuss market conditions volatility illiquidity lacking direction consolidating trending. So, these are all the terms that can be associated with market conditions. Now, markets can move from one phase to another quite seamlessly, and, it can happen very quickly. So, therefore, it is a traders responsibility actually to be able to identify varying market conditions and, knowing and, understanding what those conditions are. So, to just touch upon a few of those I’m just looking at his first chart currently up on screen you can quite clearly see we have price action moving from bottom left-right the way to the top right of this chart and, you don’t need to be a genius really to identify that we are in a bull market with prices moving quite explosively to the upside. So, so, in this market condition it’s a trending marketit’sfairly volatile we even get these significant pullbacks in this market and, but we get to see a significant direction in this market and, it’s just looking for opportunities to buy and, this type of market and, if you do. So, you’ve got a higher degree or a higher chance of being successful when you trade these markets.
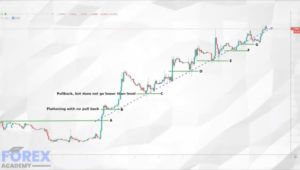
So, that’s definitely worth bearing in mind somewhat when we trade. So, looking at if I take this off the page and, we look at the second example. Now. So, this too is a trending market; however, we are trading this market from top left as you can see the bottom right. So, on this occasion, it’s a trending market, but the direction of bias without a doubt is to the downside until you get to these lower levels down here. So, this marketing can give you loads of opportunities to look to sell these markets at various price points as prices push lower and, that’s how a trader can use this information to look to capitalise on what would be a higher probability trade setups. Now, in addition to trending markets moving to the upside, we can also, have consolidated markets and, these are just markets that maybe straddle a level of support resistance where the lows and, the open and, closes really struggle to break above this period of consolidation or below it. So, what you find and, they will experience is just this kind of indecisive price action which is ultimately moving sideways and, and, it may be a little bit more illiquid and, it’s really a case of understanding looking at the charts and, identifying what the market conditions are in terms of how that will enable you to have a direction of bias. So, one approach might be to if you get a confirms break below the level of consolidation you might look for a no brainer sell trade and, the same applies to the upside if we get a confirmed break to be to the upside in this market you might look for an opportunity to buy this market. So, it’s about having a directional bias if x y happen to conform with that view of perhaps conducting the technical analysis and, then applying that information in a very practical manner and, understanding market conditions as a fundamental part of that decision-making process. So, that’s just touching upon market conditions. So, putting directional bias into practice. So, how do we go about doing it and, we’ve identified it kind of briefly a couple of areas but we’ll document them. Now, first of all, a visual observation. So, understanding that markets are moving from bottom left to top right, you’re in a trending bull market top left to bottom right you’re in a bearish market. So, visual observations are very useful. So, to our technical charting tools we can use diagonal lines and, horizontal lines to assist us in that decision-making process we can also, use technical indicators to assist us with a directional bias to look to provide potentially support and, resistance in those markets but to generally give us a bit of an overview about these markets and, also, your ability to be able to analyse Japanese candlestickswill assist you as well with being able to apply a direction of bias when you trade these charts. So, what we do is we put all these together in a practical fashion. So, we’ll have a practical look at directional bias in practice. So, for this I’m just going to bring up our trading chart and, we just have a look at the oil market and, this is the current price up here by the $70 level and, we can see looking at this market and, effectively what’s been happening. So, and, the first thing is to have a visual observation and, again we’re just broadly and, it’s very crude and, just identify that this chart is starting from bottom left moving up to top right. So, we are very much in a bull market and, that is just purely a visual observation.
So, what you can what a trader would do when they see a market like this is just look for opportunities to buy this market. Now, what he needs to make these decisions and, as you can see it’s not linear it’s not just it hasn’t just moved from this bottom left hand, corner to top right and, the price down here and, the bottom left is around the $40 level. Now, we are close to nearly doubling that. So, we’re up at $70. So, we’re clearly in a bull market and, there’s their significant fundamental reasons for this price move from $40 to $70 that is just as a point of interest really is to do with the OPEC and, non-opec countries agreeing to restrict the supply of oil in order to push the prices to the upside. So, very volatile market you know, fast-paced very fast-moving but is been moving to the upside as a result of fundamental sort of developments that lay in wait in this particular market and, what you can do is you can use technical tools as well. So, we’ve got visuals that we can utilise and, technical tools well can allow us to identify support and, resistance and, you can you can apply a lot of this information fairly seamlessly and, it starts to build a little bit of a picture in these markets and, you can see how these prices range and, bounce from one level to another. So, you can capitalise if you conduct your analysis, you can do some significant and, you can use these technical tools to conduct some significant analysis on this market. So, in this example we can see we’re in a bull trend from this time last year effectively sort of summertime 2017 and, a trader can absolutely use this level use these technical tools to build a bit of a picture maybe give us some fantastic opportunities to look – to buy these markets on multiple occasions and, we’ll discuss these a little bit when we’re discussing Japanese candlesticksand, analysis and, the information that I can give us. So, we’ll zoom into this chart in a minute but just roughly broadly speaking using these technical tools to identify that yes an uptrend does exist you can see how price conforms to the to the technical analysis of which is currently up on screen and, that can give us some fantastic opportunities when it comes to entering and, exiting these markets. So, and,. So, in addition to a visual observation in addition to using technical tools like lines and, levels and, we can also, use technical indicators as well. So, what we’ll do is we’ll put over the analysis we’ve already carried out we’ll just put in a 20-period simple MA and, really if you were in any doubt whatsoever that this market is moving to the upside just look at the slope of this dis moving average and, it is a directional indicator it can help you indicate direction. Now, we can see it visually we can apply some technical tools and, we can also, apply you know, indicators to help us with that directional bias. So, really it becomes a no-brainer opportunity for traders to look for opportunities to buy this market and, that is where a traders’ understanding of technical support resistance and, technical Japanese candlestick analysis can actually come in quite nicely. So, if we zoom in you can see when these markets interact with these prices and, you could adopt a very straightforward if you understand, what is going on inside this level you can see just for this example, it coincides with a level of support at the 5865 or we can see three rejections to the downside, which is failing to close or to break below the ascending level, we can see that the close of the market is actually above the 58 64 and, we can see the bearish candlestick is not that enthusiastic in terms of pushing lower.
So, you could argue it is there an opportunity to buy this market at that level just from a common-sense perspective the answer would be yes. Now, it’s not just that interaction with these levels and, there is plenty others and, I’ll take that interaction off and, just broadly speaking, looking at this area. Now, and, we can see that the daily lows all roughly coincide with each other and, we can also, see the market is failing actually to either closed or open below this level and, we are still above an ascending level meaning it’s very likely to support prices to the upside and, that’s what we’re experiencing. So, then we can look at these Japanese candlesticks and, we can see can we see an injection of significant upward volatility in this market and, the answer is yes we can see the buyers coming into this market. So, it might be an opportunity to buy it above this level and, as you can see the market kind of rolls over to the downside, it still performs it still stays intact and, then you get that explosive move. So, the timing of this traders are all important as you can see however, if we decided to get in at this level up here you can actually use the ascending levels and, your understanding of the having a direction of bias and, knowing if you look for opportunities to buy this market you’re actually more likely to see positive returns when you trade but you can also, use it very effectively from a risk management perspective where you can use all of this information to place your stop-loss outside the ascending levels and, below the loaves and, below the open and, closes of previous candlesticksand, then when you get that bullish price action coming in you can actually get into this trade with a lot more confidence behind that particular trade because you just have many significant reasons to get into this market to the upside and, this is what technical traders do. Now, in addition to that, we also, have just the third and, final observation really. So, putting everything together we’re observing prices to the upside and, we can put in our odd technical levels to assist us we’ve also, got our we’ve also, got our should I say that was supposed to be a little tick there up on the screen. So, we also, have our moving average we have our technical levels as you can see in technical tools we have our observation that this market is pushing to the upside. So, when these prices interact with these levels, this is another good opportunity we can see how the price performs with this level it literally bounces off it and, we get to see some significant buying pressure reverse the previous day’s sell-off. So, really if you were selling this candlestick the following day, you wouldn’t be. So, confident in that move and, as you can see the price breaks above the moving average as well and, it becomes a no-brainer opportunity to take this market to the upside. So, it’s just about understanding what’s going on using the tools that are available and, there’s many other directional tools as well that can help you. So, it’s a case of picking the tools that work best for you and, then you can you can apply a fairly straightforward approach and, two to training these markets and, it’s been a case of applying a little bit of patience to those trades okay. So, that’s just looking to put the direction of bias and, being able to have a myosin what we should be looking for and, how to apply it in a very practical sense and, it’s just touching upon those points currently up on-screen okay. So, moving along, then we discussed understanding primary and, secondary trends are very very important. So, just to focus on directional bias in a primary trend, to begin with, and, it’s important to know, that you may have heard the phrase the trend is your friend. Now, this is not just a nifty catchphrase passed from trader to trader as they move from perhaps something like the ticker tape systems of old to the Bloomberg terminal which is very sophisticated with some incredible charting.
So, it stems from a profound belief that the individual trader is and, will always be a small fish when it comes to moving markets and, that’s just because of the natural size of the markets in which we trade huge volumes of liquidity in those markets. So, the amount of capital you will have as an individual will pay Lincoln civ in significance to the size of these markets. So, as a result, we are all technically relatively insignificant. So, as a result, a tip to help you succeed over the longer term requires you to develop a trading strategy that allows you to go with the markets as opposed to going against them. So, going against them is like standing in front of a train apologies for the analogy but really that is not a clever decision to make in the anticipation that you think that market is going to turn around before it hits you the reality is that’s probably not going to be the case and, it’s probably not going to work out too well for you know, in a metaphorical sense and, in a practical sense as far as your capital is concerned it is not a good idea to do that. So, if you are looking to sell a bull market you need to acquire a lot more experience and, training these markets you need to be super-efficient with regards to your exposure of capital and, you won’t really be able to make any kind of errors if that is your approach. So, really adopting an approach which looks to go with the market is profoundly it will enable a trader to become consistently profitable over the medium and, longer-term. So, although this long-term buy and, hold strategy which we all hear about especially in global equities and, another markets this type of buy and, hold strategy does hold more weight in global investment in the investment community it serves to teach the trader a very key principle the primary trend is perhaps the most significant indicator of where the market is heading over the longer term which should really be very useful information to you as a trader and, should help you some significantly. So, and, to just apply it in a practical sense let’s get up this chart currently up on the screen and, just conducting a little bit of technical analysis we can see that a primary trend without a doubt is moving to the upside. So, if we know, that’s the case and, we decide that in advance you know, we could just be looking for plenty opportunities to look to buy this market if you have an understanding of technical analysis like we’ve discussed previously and, even when these prices are up at these higher levels and, you could still experience this market to come back to the lower levels and, the same principle applies you could be looking to take this market again to the upside from a lower price. So, that’s where patience and, timing actually come into the trading process, of course, there is opportunities to trade above sort of highs like this and, breakouts and, stuff, of course, that is a viable option for those breakout traders and, you also, have your pullback traders which look at the capitalised these markets from lower prices because we one thing we all know, and, people that are trading this market and, even from a fundamental perspective that the likeliest outcome is that this market is going to move to the upside. So, what we talked about going with the market is looking for opportunities to buy this market based on having a directional bias and, there is many traders out there that keep looking to fade these highs keep looking to drive these prices lower from these higher prices and, although that is a method that some traders use and, I’m sure some use it very profitably it comes with its own risks and, you would especially when you’re starting out your trading career it’s much more advisable to look to trade the primary trend even the overall direction of a market.
So, and, hopefully, it will make sense as well and, be relatively easy to apply okay. So, that’s just directional bias in a primary trend what we also, have is a potential direction a directional bias in a secondary trend. So, let me explain what this is in contrast to a primary trend. So, as discussed, the markets move in different phases or cycles. So, an uptrend will not solely move in an upward direction meaning Corrections will take place and, the markets will consolidate at some point. So, every trend comes to an end at some point, markets can’t continuously move in one direction forever. There’s going to have to be moments and, times and, opportunities where those markets correct. So, that’s a that’s effectively a pullback and, what you can often experience is consolidated markets at the end of a trend as well or even at the beginning of a trend. So, all trends originated from consolidation. So, when you think of it like that, it’s important to look for consolidation when you trade these markets. So, these look like pullbacks and, pauses in the main trend. So, the market will always have short and, medium-term secondary trends that form part of the long term or the primary trend. So, it’s just important to identify that the secondary trend is an important part of a primary trend. So, it’s just important to be aware that if you’re trading the primary trend, you’re going with the overall move of the market and, if you’re trading a secondary trend, then you are effectively trading the correction on a pullback. So, the reality is both trends are potentially tradable there’s opportunities to and, I’m not saying for a second that if you’re selling a primary trend, or you’re going against the overall trend that it’s not a viable option if you can identify a secondary trend and, you do your analysis accordingly, of course, there’s plenty opportunities to trade those moves, but certain conditions need to be met for that. So, however, the trader needs to understand, which component of the trend they are trading and, simply look to amend their technical approach potentially and, certainly their risk management and, risk-reward strategies accordingly. So, meaning you can adopt an approach on a primary trend which could be positive you know, three to one four to one positive risk-reward on that trade with them a very well-managed risk management approach and, you might even decide to give because you’re looking at a three to one you might decide to give that stop-loss a little bit more room because you are trading the primary trend and, the market is very much open to these secondary pullbacks. So, that’s the decision-making process you would go through in your mind and, whereas if you’re trading that secondary trend, you might decide to not give that stop-loss. So, much room. So, there is you’re amending your risk management approach and, then technically you might look to maybe even get in a bit earlier because you realise you’re trading the secondary trend Trading the correction and, a pullback and, as a risk/reward strategy you might look to adopt the one to one or maybe one and, a half to one in terms of a positive risk-reward or even a negative risk award and, whatever your strategy may Intel. So, to just apply it, then we can see from the chart currently up on the screen that we have a clearly defined primary trend which is to the upside. So, prices whether you like it or not are effectively moving from top bottom left to top right.
So, the primary trend I hope you would agree is clearly to the upside. However, there is loads of opportunities to capitalise on some secondary trend moves and,. Now, some will be more profitable than others. So, we can identify potentially moves like this and, again when you get this kind of structural failures. So, you can identify many opportunities in this market to actually look to sell this market and, push it to the downside. So, and, the same continues you know, there’s opportunities to effectively sell these markets on many occasions and, that’s really why you as a trader would need to make that decision accordingly okay. So, and, that is just the principle of understanding that the primary trend could be to the upside and, you might find opportunities to trade the secondary trend to the downside. So, this is having a direction of bias in the secondary trend. So, it’s just knowing that you might be in this market looking to push these prices lower. You might look to adapt your risk-reward potential as a result. So, you might not be looking to see these markets extend down to these levels you might just be fully mindful that this might be a short live trade because there might be some considerable resistance in this market our support should I say preventing prices from pushing lower. So, it’s having an understanding of those and, pushing it further to the downside. So,. So, what we have then is let me take these off the screen. So, just to conclude, then we have some final considerations in observing the markets over a longer period of time, it is clear that a directional bias has to be considered. So, the time period chosen as well to trade is technically very significant when we look to trade we look to consider a number of final considerations let’s say. So, what is the market condition is the first question with we need to ask ourselves is the market bullish bearish is it a liquid is it consolidating what are the market conditions we need to take on board another consideration to take on board is whether the market is ultimately bullish or bearish. So, are we seeing a short-term bullish move are we seeing a long-term bullish move and, am I training with the market or are my trading against the market. So, and, these are very important questions to ask yourself am I trading. As a result, the primary trend or the secondary trend and, potentially on a bigger timeframe. So, and, all of these decisions can be made on smaller timeframes for various different reasons. So, you can have quite a bullish trend on a 5-minute chart which might be insignificant on a 4-hour or a daily timeframe, for example, the overall primary trend might be to the downside, but you’re getting a daily pullback on a 5-minute chart and, you might want to trade that 5-minute trend to the upside if that’s the technical setup, but it’s just important to know, in terms of what the overall what is the overall position in that market. So, do you bear that in mind and, ask yourself can my direction of bias change and, the answer is, of course, it can. Now, we’re not talking about moving from a buy trade to a sell trade because the market is quite choppy and, price action is very erratic that’s not really what we’re referring to you know, you can have a direction of bias to the upside for a specific set of reasons and, if all those reasons start to fail and, unwind and, then it may be very appropriate to change your direction of bias and, say right well from. Now, on I’m looking for opportunities to sell this market and, that may change again and, that’s really the evolution of trading these financial markets. So, it’s not flip-flopping in your mind from one to the other based on what the market is doing are there the choppiness of the market in which you’re currently experiencing it may be a case of doing some multi-timeframe analysis looking at much bigger time frames to see if it warrants a change of your direction of bias and, if that’s the case then of course, by all means, you can change that direction of bias and, then finally which is just more of a tip if you are in any doubt whatsoever you know, then are certainly or our advice and, certainly my own personal opinion really would be to stay out of that market until you have the conditions that you’re more comfortable with that you know, the setup begins to stack up for you and, the more reasons you have to execute that trade. So, that is just a principle that you won’t go too far wrong if you if you’re able to apply that in a consistent manner, okay. So, that just about concludes at this particular course. So, we’ve covered a number of topics currently there up on the screen. So, all that’s left for me to do. Now, it is to thank you very much for joining us. Do take care, and, we look forward to seeing you next time. So, from everyone here, bye for now!