Introduction
In the previous course lessons, we understood the importance, types, and various pros and cons involved in indicator-based trading. From this lesson, let’s start learning some of the most widely used indicators in the market. We will be starting with Bollinger Bands, which is arguably considered as one of the most widely used indicators in the Forex Market.
What are the Bollinger Bands?
They are a technical analysis indicator, which was developed by one of the famous technical trader John Bollinger in the 1980s. This indicator consists of three lines, which are simple moving average (the middle band), an upper and a lower band. In a volatile market, the bands of the indicator expand, and it contracts in tight market conditions.
Most of the traders think that the Bollinger bands indicator is similar to the moving average envelope, but it’s not true, because the calculations of both of the indicators are different. For plotting the upper and lower bands of the Bollinger Bands indicator, the standard deviation is considered. On the other hand, for moving average envelopes, the lines are calculated by taking a fixed percentage.
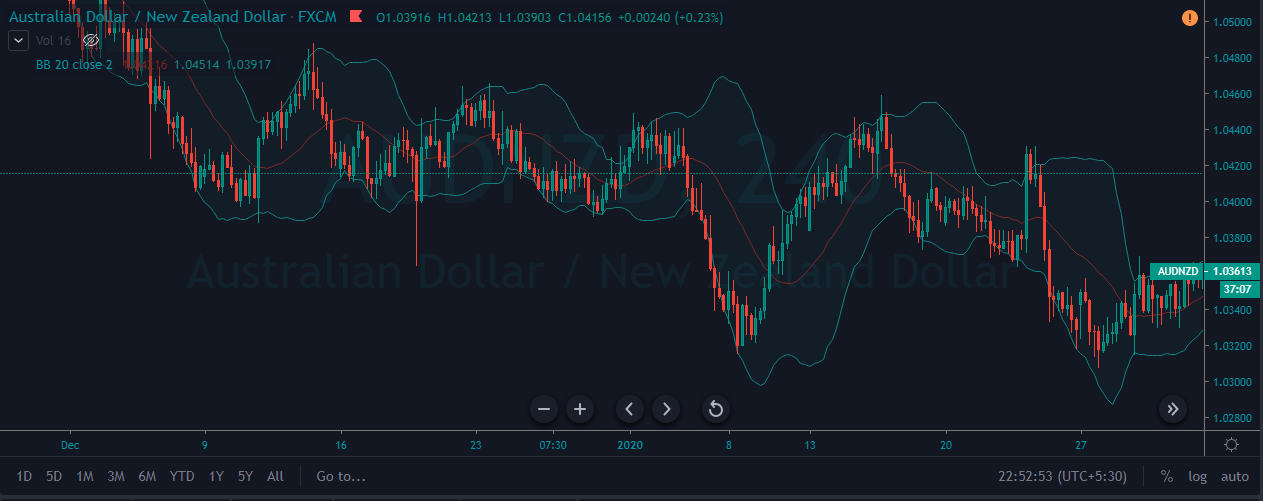
Bollinger Bands Indicator Plotted on a Forex Price chart
Using The Bollinger Bands Indicator To Take Trades
Most of the market experts and chartists believe that when the price action continuously touches the upper band, it means that the market is in an overbought condition, triggering a sell signal. Conversely, the closer the price action moves towards, the lower band, the more oversold the market is, triggering a buy signal.
This is the most common way to trade the markets using the Bollinger Bands. As much as this is true, we don’t suggest to use this approach to trade the markets where traders just blindly follow this one single rule. As we all know that the trend is our friend, we must first figure out the trend. Then it is advisable to trade only buy opportunities in an uptrend and sell opportunities in a downtrend. This is one of the most reliable ways to identify the trades on any trading timeframe.
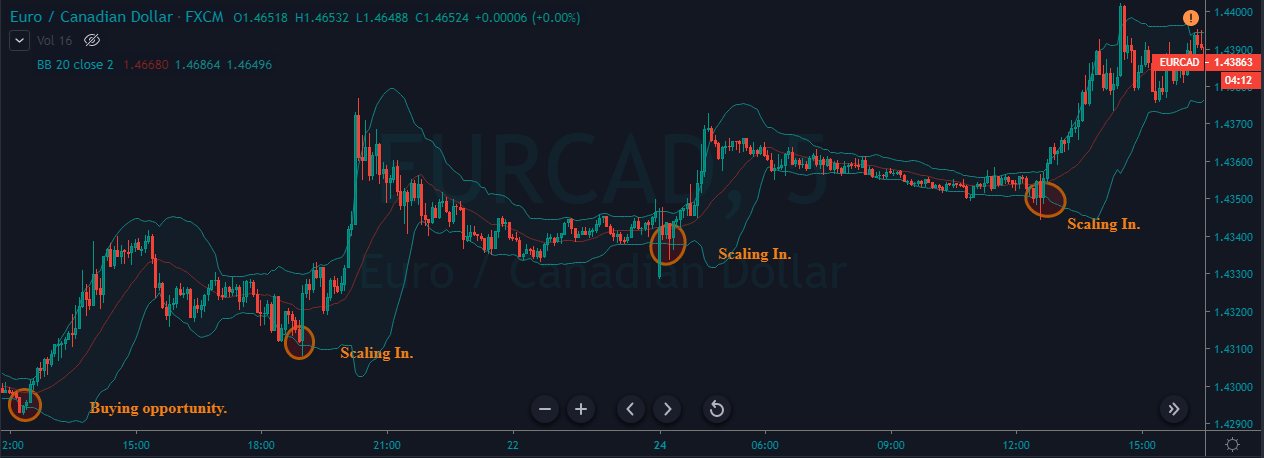
The below image represents the buying opportunities on the EUR/CAD 5 min Forex chart. As we can see, the market was in a strong uptrend. We have identified four buying opportunities in just a couple of hours. The chart clearly represents how many times the price action touched the upper band and didn’t drop instantly. This is the reason why most of the professionals use this indicator to trade the market.
Trading Ranges Using The Bollinger Bands
One more crucial applications of the Bollinger Bands indicator is while trading ranges. This is because the bands of the indicator act like dynamic support and resistance levels to the price action. Higher the timeframe we use to trade the ranges, stronger are the bands will be. That is, price relatively respects these brands than the bands in the lower time frames. Many successful traders ace the market by using this strategy alone.
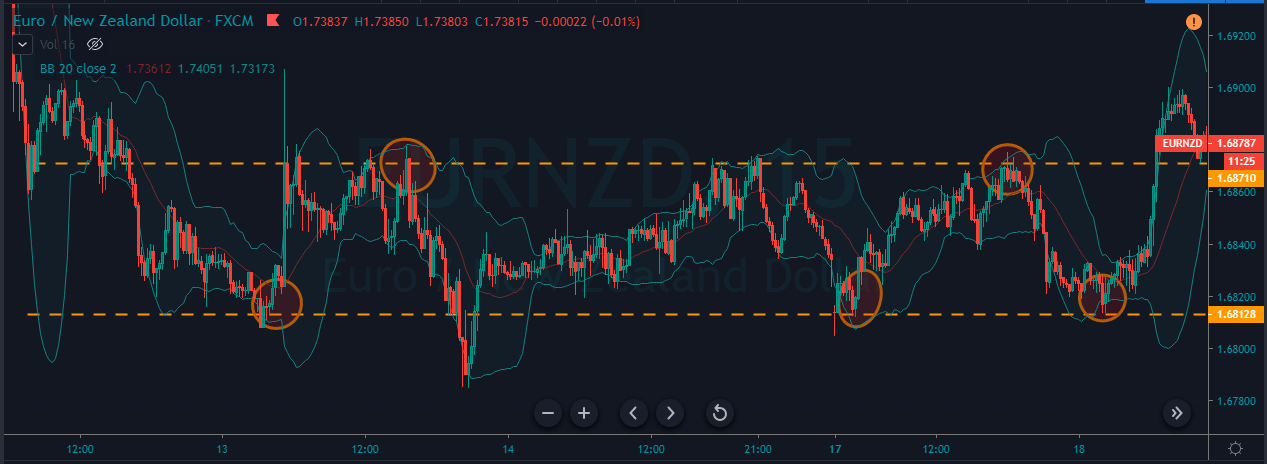
As we can see in the below chart, the market generated three buying and two selling opportunities when the market is ranging. Do not place the buy or sell orders blindly when prices reach the upper or lower level of the consolidation phase. Instead, wait for the prices to hold there for a couple of candles to activate your trades. In the below image, we have activated our trades only when we saw the confirmation candles. In this way, we can filter out whipsaws and false trading signals.
Conclusion
This lesson is an attempt to give you a basic idea of the working of this indicator. There are many more aspects to this, and you will be learning them once you start exploring Bollinger Bands on the price charts. You can refer to this and this articles to get advanced trading strategies using this indicator. Bollinger Bands can also be combined with technical tools like chart patterns and other reliable indicators to generate more accurate trading signals. One such example can be found here. Cheers!
[wp_quiz id=”66529″]