Chart Patterns
Chart patterns, or technical analysis, is how traders determine possible future price action direction by incorporating ‘technical’ tools onto their PC screens. The resulting patterns they see on their screens, including the current exchange rate of a Forex pair, while factoring in volume, time of day, recent and future economic data releases via fundamental analysis, provide an effective way of gauging future price action direction.
Forex trading only took off in the retail sector in the early 2000s. Before that, and largely thanks to the advent of the internet, technical trading was almost unheard of in the institutional Forex market. Today, retail Forex traders take for granted the myriad of available technical trading platforms such as the; Metatrader MT4 platform, Trade Station, Currenex, Ctrader, etc. These incredible platforms, which are mostly free to retail Traders, would have been an institutional traders dream come true in the 1970s, 80s, and 90s. Back then, traders, technical analysis depended on plotting exchange rates into a notebook or on a spreadsheet. However, time and technology have moved on, and the internet has allowed liquidity to increase exponentially year on year. People can now make a reliable living by trading in favor of recurring patterns that they see on their computer screens. It is quite amazing that many economies around the world are often affected, both negatively and positively, by exchange rate fluctuations because of patterns on traders’ screens which tell them to buy or sell.
Example A
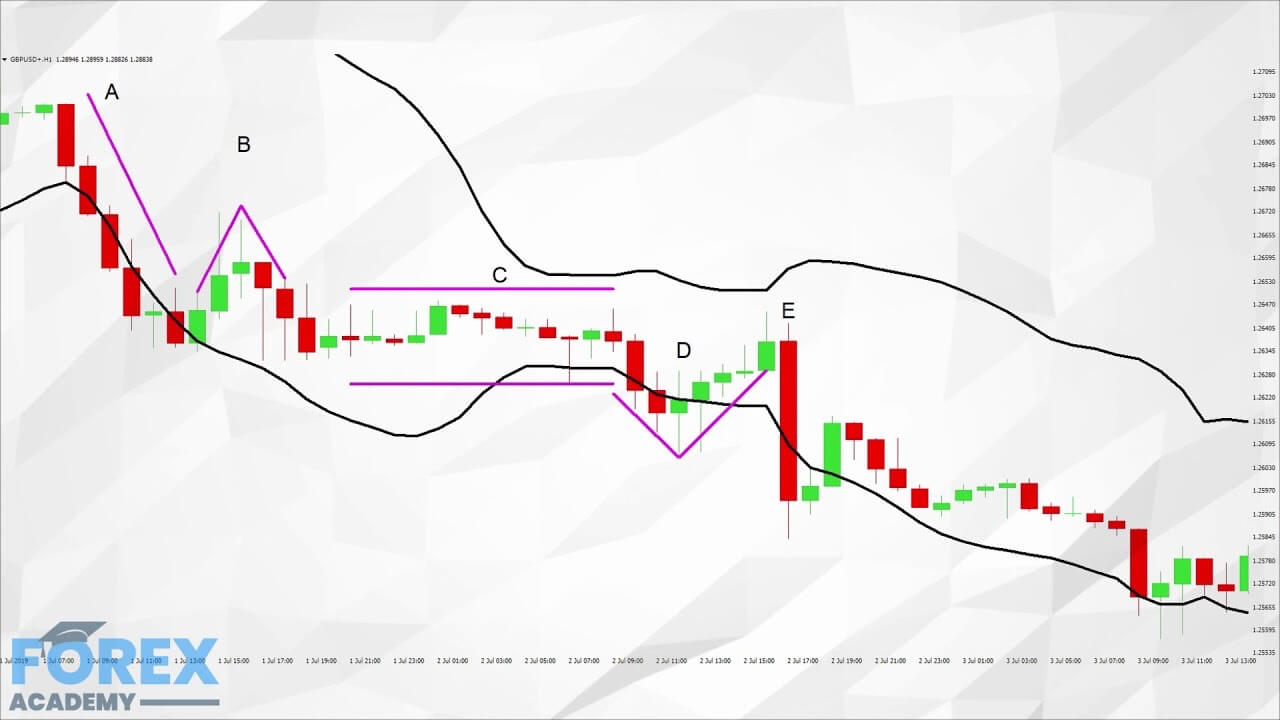
In the example ‘A,’ we can see a 1-hour chart of the GBPUSD pair. In the chart, we are only using Japanese candlesticks. We advise that you always read a chart from left to right because it tells a story. Traders typically draw their own trendlines, and that’s what we have done here. In this diagram at section ‘A,’ we can see that there has been a bearish trend. This was followed at section B’ buy a pull-back or consolidation and then continuation to the downside. This produced an upside-down V formation, which traders look for when considering a possible continuation in the downward trend. However, price stalls in section ‘C,’ which is littered with small candlesticks. Price action then slips into a sidewards momentum. These smaller candlesticks, some of which open and close at the same exchange rate, tells traders that there is a lack of liquidity in the market during this phase. Section ‘D’ is a continuation to the downside, and where price action has gone through the support line, we drew in at section ‘C.’ The continuation is short-lived, and we had a bullish pullback, again with the v-shape formation clearly evident. However, the bearish engulfing candlestick marked ‘E’ takes out all of the candlesticks in Section ‘D’ telling traders that a large amount of liquidity has gone through at this point and that the sellers are in command. Subsequently, we see price action continue to fall.
Example B
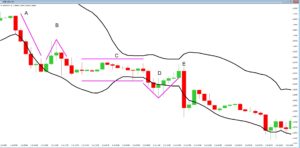
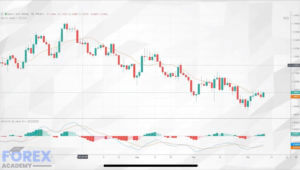
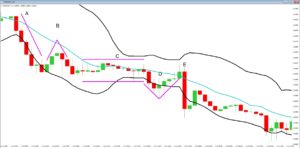
In example ‘B’ we have added Bollinger bands to our chart. Bollinger bands were developed by John Bollinger, whose book on the subject, “Bollinger on Bollinger Bands” (2001), was transcribed into over 11 languages and is widely used in the trading community. Bollinger bands plot deviations from the exchange rate onto a chart that materialize as two lines, one either side of the and outside of price action. The theory is that over 90% of price action will remain within the bands. Therefore, traders look for certain aspects to occur during the formation of the bands to help them with their trading decisions.
During the sell-off at section ‘A’ we can see that the bands are widening while moving in a downward direction. However, as volatility gains, price moves outside of the bands. But we can see that price action moves back inside the Bollinger bands to begin the V formation at section B. During the consolidation period at section ‘C,’ we can see that the bands move together to form a narrow tunnel. Typically traders will expect larger liquidity entering the market during times of bands expansion from a narrow contraction, and during the bottom of section ‘D,’ we see an increase in liquidity which pushes through the Bollinger bands, only for the bulls to buy the pair back inside. Subsequently, we see that the bearish engulfing candlestick marked ‘E’ pushes through the Bollinger bands to the downside, before buyers bring the pair back inside again. Price action then continues to the downside, while staying inside the Bollinger bands, until the bottom right-hand side of our screenshot, where we can see some tails piercing through the Bollinger bands, only for price action to pull the candlesticks back inside.
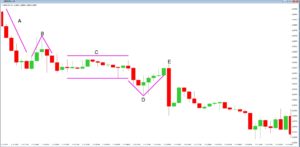
In diagram ‘D,’ we have added another favorite tool as used by technical traders: a moving average. The blue line is a 14 period, simple, moving average. It calculates the highest point and the lowest point of each of the previous 14 candlesticks and plots the average measurements on the screen in the form of a line. In our example we can see that once price action falls below our moving average at section ‘A’, it begins to form an invisible area of resistance, where price action moves up to it on a number of occasions at sections ‘B’, ‘C’, ‘D’ and ‘E’ before price action continues to the downside. Trainers typically use several moving averages on their screens in order to determine price direction, consolidation, continuation, and price reversal areas.
There are hundreds of technical analysis tools available to Forex traders. However, the more you have on your screen is not necessarily more of an advantage! In fact, too many analysis tools may hamper your trading by clouding your judgment. The best technical tool will always be the price action itself, which is a leading indicator. So, here at Forex.Academy, we recommend that you do not overload your screens with technical analysis tools. Keep things as simple as possible when deciding which technical tools to implement in your trading style and methodology.